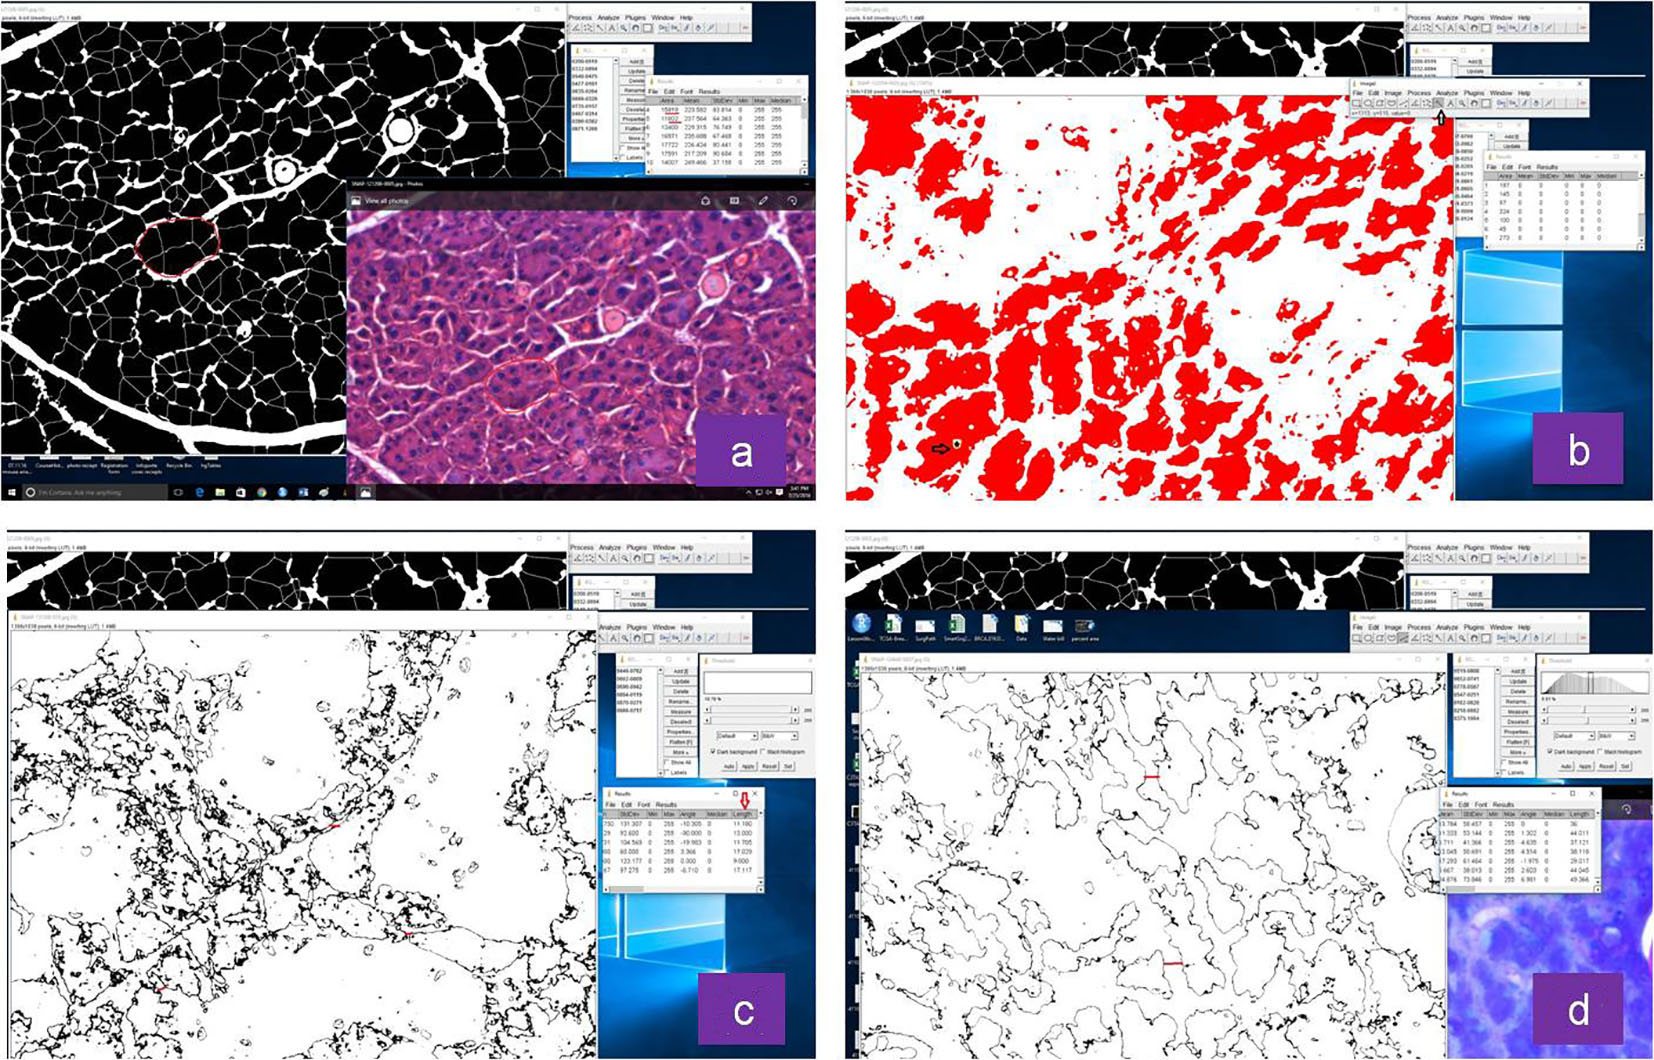
Figure 1. Representative images of histomorphometric analysis of normal and irradiated glands by Image J software: (a) acinar size, (b) vacuole size, (c) distance between acini in non-irradiated and (d) irradiated group.
| World Journal of Oncology, ISSN 1920-4531 print, 1920-454X online, Open Access |
| Article copyright, the authors; Journal compilation copyright, World J Oncol and Elmer Press Inc |
| Journal website http://www.wjon.org |
Original Article
Volume 8, Number 2, April 2017, pages 45-52
Acute Radiation-Induced Changes in Sprague-Dawley Rat Submandibular Glands: A Histomorphometric Analysis
Figures
Tables
| Feature | Control | Irradiated |
|---|---|---|
| *The values given are as mean ± SD. | ||
| Serous acinar area (%)* | 77.16 ± 5.05 | 36.55 ± 4.90 |
| Serous acinar size (mm2)* | 3,447.53 ± 461.03 | 428.25 ± 75.22 |
| Serous acinar shape | Round | Angulated |
| Vacuoles | Absent | Present |
| Vacuole features* | - | Round to ovoid in shape; 56.18 ± 18.62 mm2 in area |
| Space between serous acini (mm)* | 3.46 ± 0.67 | 10.08 ± 0.60 |
| Acinar degeneration | Absent | Acinar shrinkage |
| Ductal area (percentage) | - | Nuclear changes seen without much architectural change |
| Ductal dilation | Absent | Absent |
| Ductal degeneration | Absent | Present |
| Acinar nuclear size (mm2)* | 137.44 ± 25.66 | Nuclear pyknosis |
| Ductal nuclear size (mm2)* | 50.15 ± 29.23 | 53.63 ± 21.14 |
| Type of chromatin | Euchromatin | Euchromatin to heterochromatin |
| Shape of acinar nucleus | Round to ovoid | Flattened-shrunken |
| Shape of ductal nucleus | Round to ovoid | Round to ovoid |
| Blood vessel morphology | Normal | Normal |
| Blood vessel congestion | Absent | Present |
| Neural tissue | Normal | Normal |
| Fat cells | Not seen | Not seen |
| Collagen fiber sclerosis | Not seen | Not seen |
| Mucous acini | Normal | Normal |
| Parameter | Group | Mean ± SD | t value |
|---|---|---|---|
| **P < 0.001. | |||
| Serous acinar area (%) | Control | 77.16 ± 5.05 | 16.326** |
| Irradiated | 36.55 ± 4.90 | ||
| Serous acinar size (mm2) | Control | 3,447.53 ± 461.03 | 18.281** |
| Irradiated | 428.25 ± 75.22 | ||
| Vacuole features (mm2) | Control | - | - |
| Irradiated | 56.18 ± 18.62 | ||
| Space between serous acini (mm) | Control | 3.46 ± 0.67 | - 20.821** |
| Irradiated | 10.08 ± 0.60 | ||
| Acinar nuclear size (mm2) | Control | 137.44 ± 25.66 | - |
| Irradiated | - | ||
| Ductal nuclear size (mm2) | Control | 50.15 ± 29.23 | -0.272 |
| Irradiated | 53.63 ± 21.14 | ||