World Journal of Oncology, ISSN 1920-4531 print, 1920-454X online, Open Access
Article copyright, the authors; Journal compilation copyright, World J Oncol and Elmer Press Inc
Journal website http://www.wjon.org

Original Article

Volume 8, Number 4, August 2017, pages 97-104


4-Nitroquinoline 1-Oxide-Induced Tongue and Esophagus Carcinogenesis in Obese and Diabetic TSOD Mice

Figures

Figure 1.
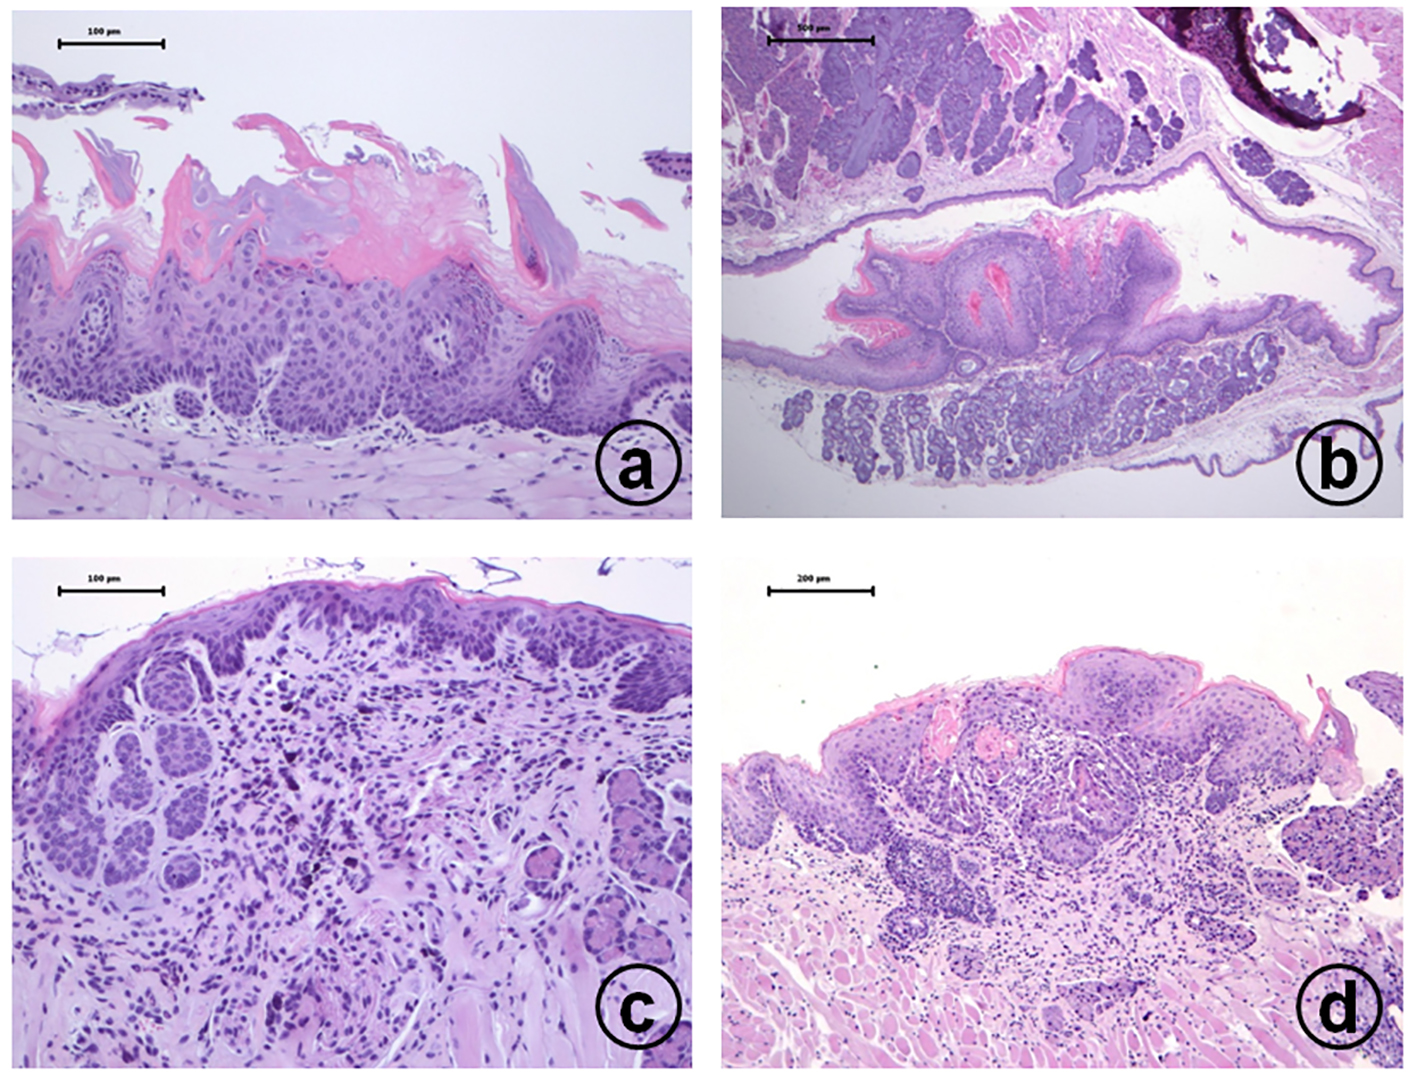
Figure 1. Histopathology of tongue proliferative lesions developed in male TSOD mice treated with 20 ppm 4-NQO in drinking water: (a) moderate dysplasia; (b) squamous cell papilloma; (c) carcinoma in situ; (d) invasive squamous cell carcinoma. Hematoxylin and eosin stain, bar = 100 µm.
Figure 2.
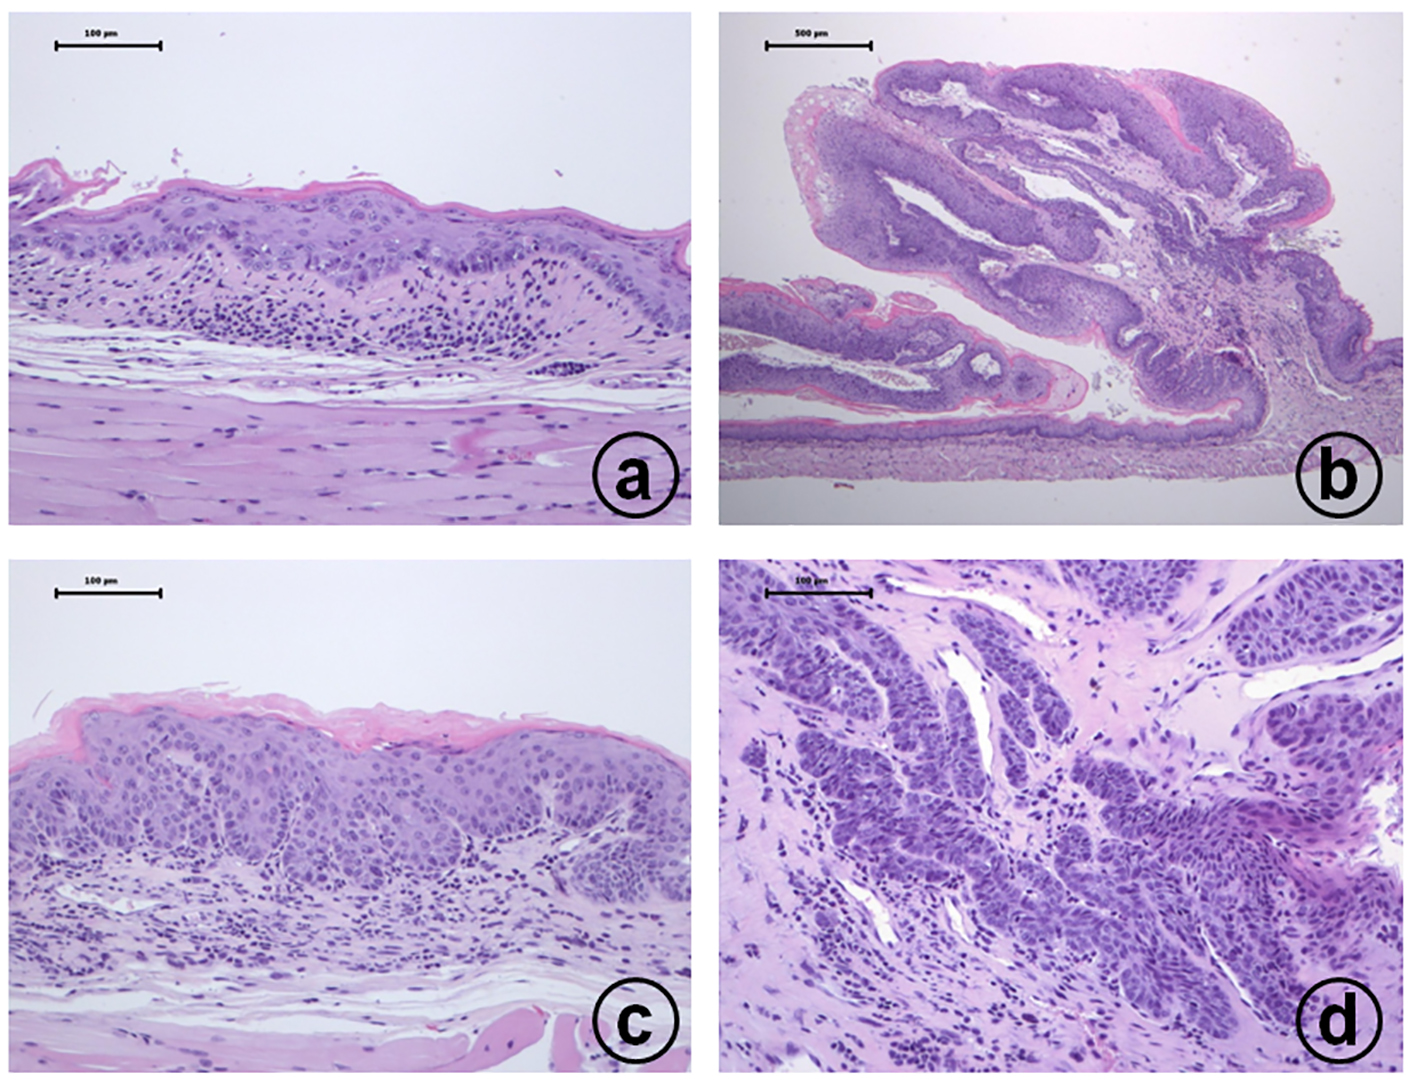
Figure 2. Histopathology of esophageal proliferative lesions in male TSOD mice treated with 20 ppm 4-NQO in drinking water: (a) moderate dysplasia; (b) squamous cell papilloma; (c) carcinoma in situ; (d) invasive squamous cell carcinoma. Hematoxylin and eosin stain, bar = 100 µm.
Figure 3.
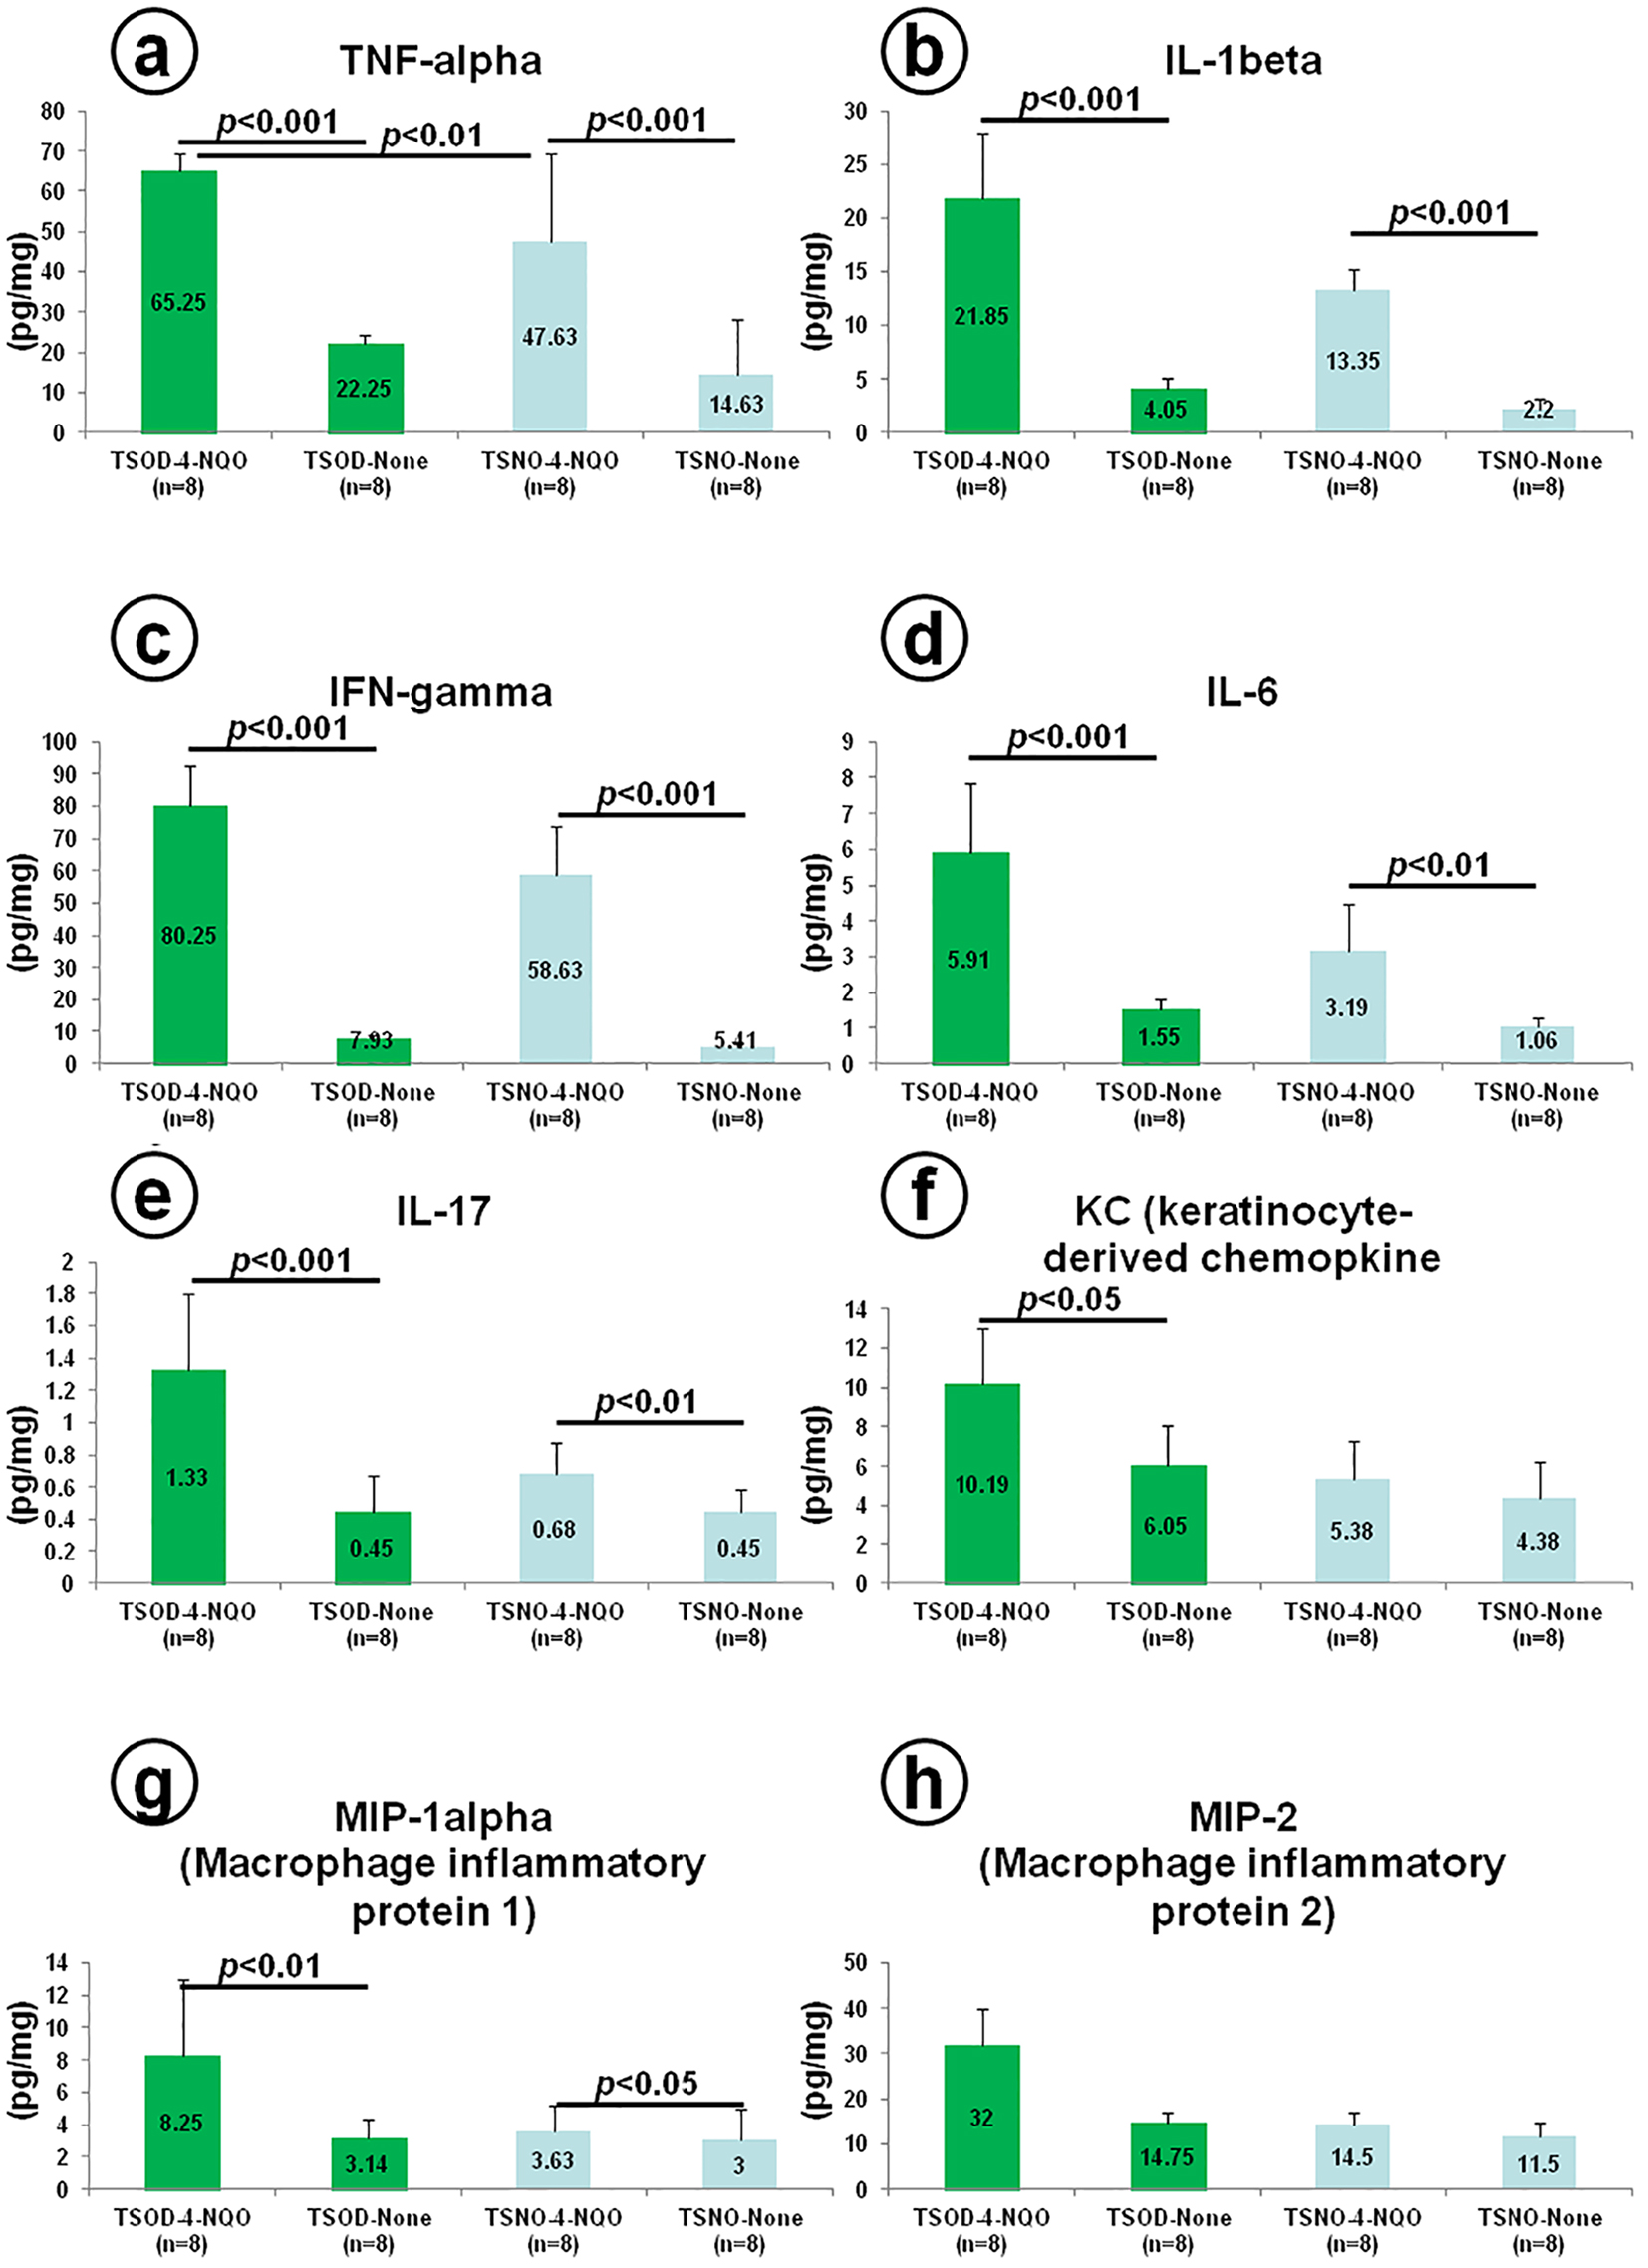
Figure 3. Measures of esophageal cytokines and chemokines in a short-term experiment using 16 male TSOD and 16 male TSNO mice given tap water with or without 20 ppm 4-NQO for 8 weeks. At 8 weeks after the start of the experiment: (a) TNF-α, (b) IL-1β, (c) IFN-γ, (d) IL-6, (e) IL-17, (f) CXCL1/KC, (g) CCL3/MIP-1α, and (h) CXCL2/MIP-2.

Tables

Table 1. Body, Liver and Visceral Fat Weights
 
TreatmentTSOD miceTSNO mice
4-NQO (n = 20)None (n = 8)4-NQO (n = 20)None (n = 8)
aMean ± SD. bVisceral fat includes epididymal, mesenteric, retroperitoneal and perinephric fats.
Body weight (g)
  Initial35.1 ± 1.2a35.4 ± 2.023.6 ± 2.225.1 ± 1.7
  Final63.3 ± 2.264.5 ± 2.743.5 ± 2.145.4 ± 2.1
Liver weight (g)1.64 ± 0.121.59 ± 0.201.48 ± 0.171.52 ± 0.14
Visceral fat weightb (g)5.52 ± 0.215.62 ± 0.191.39 ± 0.171.59 ± 0.21


Table 2. Clinical Chemistry
 
TSOD miceTSNO mice
4-NQONone4-NQONone
aMean ± SD.
Glucose (mg/dL)171 ± 29a135 ± 1990 ± 21102 ± 13
Triglyceride (mg/dL)233 ± 39113 ± 6133.6 ± 4.616.4 ± 3.5
Total cholesterol (mg/dL)227 ± 22183 ± 46137 ± 13121 ± 12
HDL-cholesterol (mg/dL)116 ± 20107 ± 13160 ± 16139 ± 20
LDL-cholesterol (mg/dL)37.8 ± 9.124.0 ± 11.212.2 ± 1.318.8 ± 4.7


Table 3. Tongue Proliferative Lesions
 
LesionsTSOD mice treated with 4-NQOTSNO mice treated with 4-NQO
Incidence (%)Multiplicity (no. of lesions/mouse)Incidence (%)Multiplicity (no. of lesions/mouse)
aMean ± SD.
Dysplasia1004.80 ± 1.44a1003.95 ± 1.47
Papilloma150.20 ± 0.52100.10 ± 0.31
Squamous cell carcinoma200.30 ± 0.66250.30 ± 0.57
Total tumors300.50 ± 0.89300.40 ± 0.68


Table 4. Esophageal Proliferative Lesions
 
LesionsTSOD mice treated with 4-NQOTSNO mice treated with 4-NQO
Incidence (%)Multiplicity (no. of lesions/mouse)Incidence (%)Multiplicity (no. of lesions/mouse)
aMean ± SD. b-dSignificantly different from the values of the TSNO mice treated with 4-NQO (bP < 0.05, cP < 0.001, and dP < 0.01).
Dysplasia1006.55 ± 1.73a1006.75 ± 3.32
Papilloma60b1.5 0 ± 1.70b300.60 ± 1.14
Squamous cell carcinoma50c0.75 ± 0.9100
Total tumors702.25 ± 2.29d300.60 ± 1.14