Figures
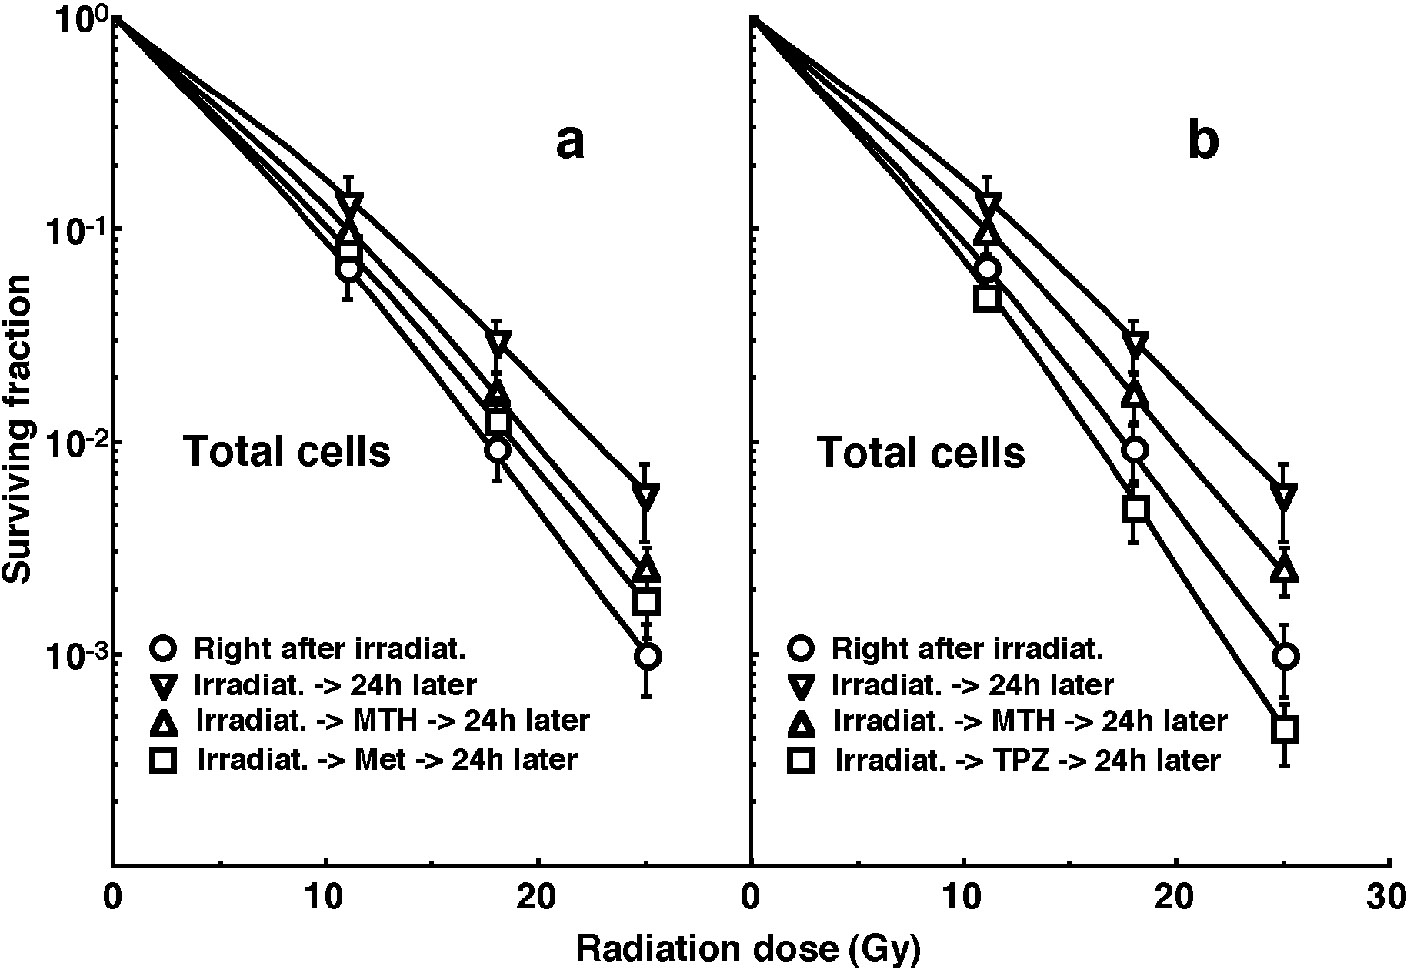
Figure 1. Cell survival curves for the whole tumor cell fraction in the total tumor cell population of EL4 tumors as a function of γ-ray radiation dose. Circles (○), reverse triangles (∇), triangles (Δ) and squares (□) represent the surviving fractions immediately after γ-ray irradiation only, at 24 h after γ-ray irradiation only, at 24 h after γ-ray irradiation followed by mild temperature hyperthermia (MTH), and at 24 h after γ-ray irradiation followed by drug (metformin (Met) for left panel (a) or tirapazamine (TPZ) for right panel (b)) administration, respectively. Bars represent standard errors (n = 9). In the use of Met (left panel, a), there were significant differences (P < 0.05) between any two curves except for between with MTH and with Met and between with Met and 24 h later without drug. In the use of TPZ (right panel, b), there were significant differences (P < 0.05) between any two curves.
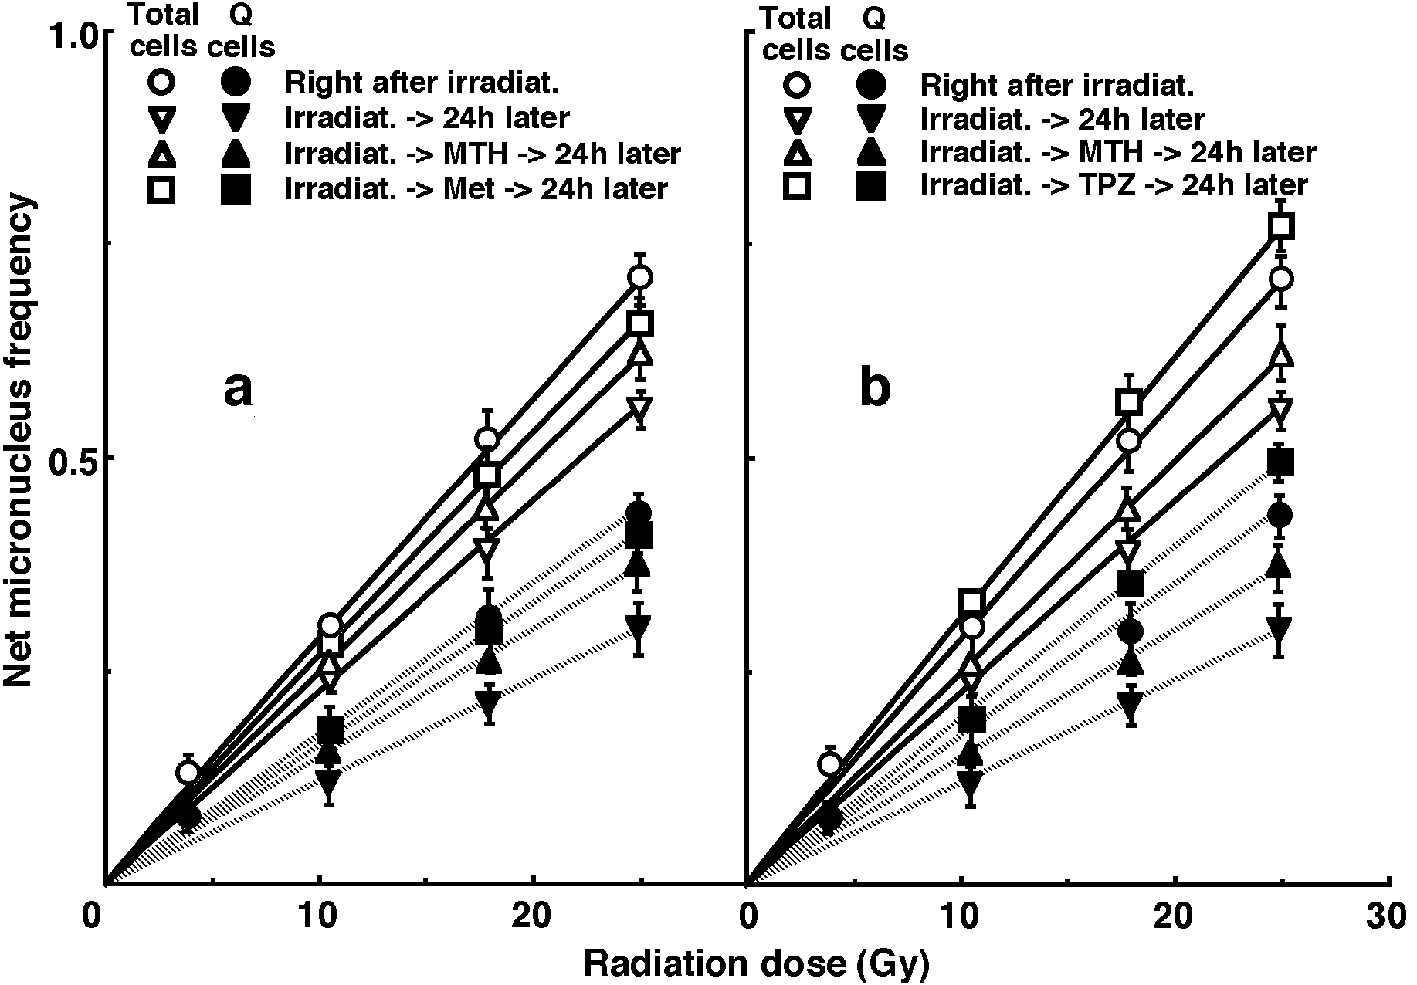
Figure 2. Dose response curves of the net micronucleus frequency for the whole tumor cell fraction in the total and quiescent (Q) tumor cell populations of EL4 tumors as a function of γ-ray radiation dose. Open (○,∇, Δ, □) and solid (•, ▼, ▲, ■) symbols represent the net micronucleus frequencies for total and Q tumor cell populations, respectively. Circles (○, •), reverse triangles (∇, ▼), triangles (Δ, ▲) and squares (□, ■) represent the net micronucleus frequencies immediately after γ-ray irradiation only, at 24 h after γ-ray irradiation only, at 24 h after γ-ray irradiation followed by mild temperature hyperthermia (MTH), and at 24 h after γ-ray irradiation followed by drug (metformin (Met) for left panel (a) or tirapazamine (TPZ) for right panel (b)) administration, respectively. Bars represent standard errors (n = 9). In the use of Met (left panel, a), there were significant differences (P < 0.05) in both total and Q cells between any two curves except for between with MTH and with Met and between with Met and 24 h later without drug. In the use of TPZ (right panel, b), there were significant differences (P < 0.05) in both total and Q cells between any two curves.
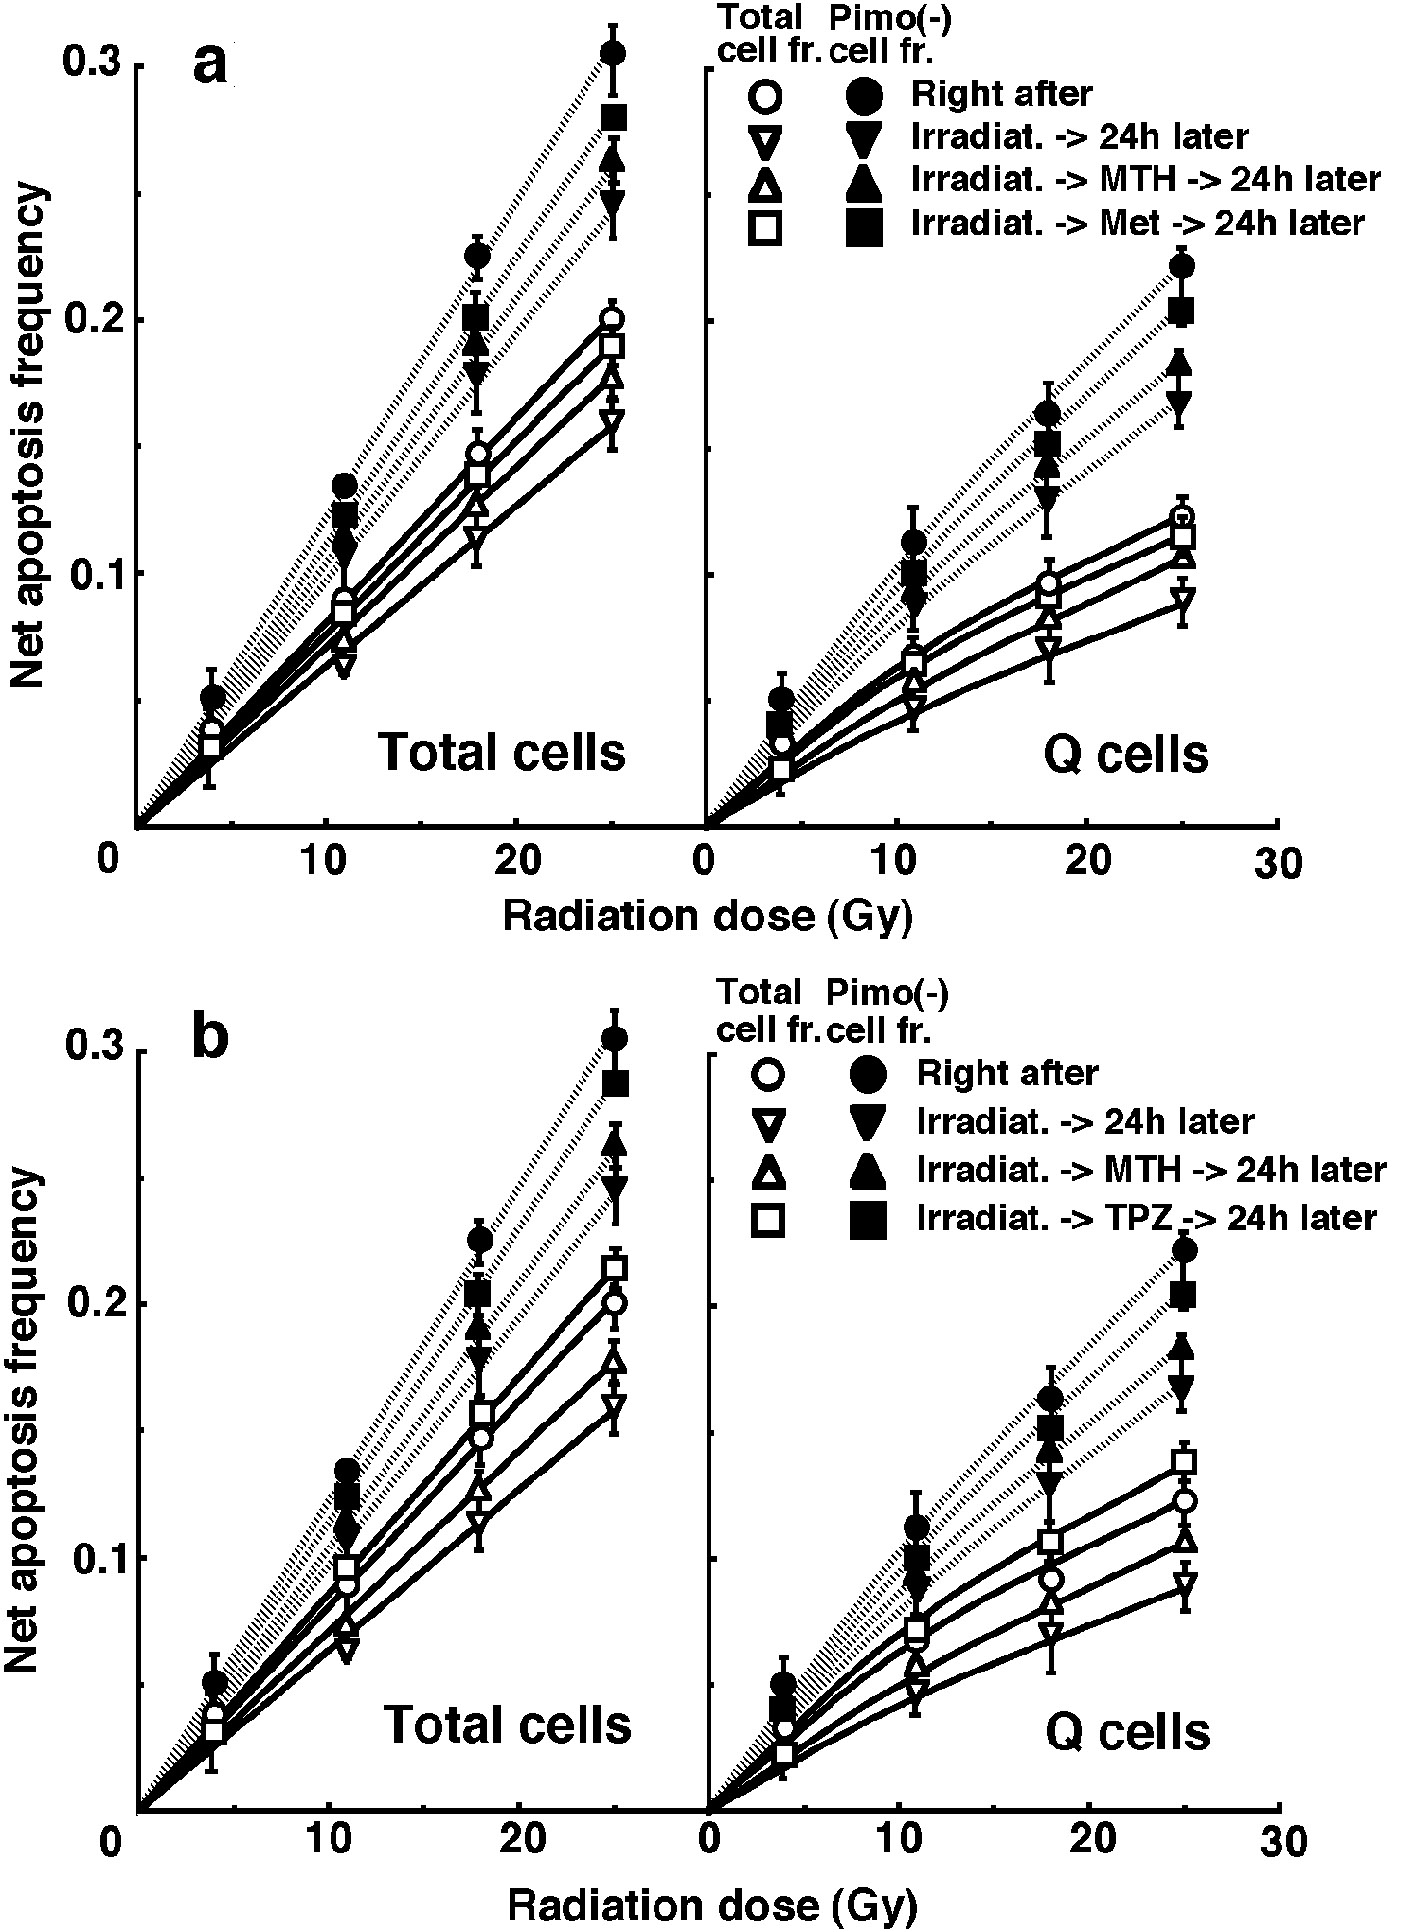
Figure 3. Dose response curves for the net apoptosis frequency of the total (left panel) and quiescent (Q) (right panel) tumor cell populations of EL4 tumors as a function of γ-ray radiation dose. Open (○, ∇, Δ, □) and solid (•, ▼, ▲, ■) symbols represent the net apoptosis frequencies for the whole tumor cell fraction and the cell fraction not labeled with pimonidazole (Pimo (-)) in both the total and Q tumor cell populations, respectively. Circles (○, •), reverse triangles (∇, ▼), triangles (Δ,▲) and squares (□, ■) represent the net apoptosis frequencies immediately after γ-ray irradiation only, at 24 h after γ-ray irradiation only, at 24 h after γ-ray irradiation followed by mild temperature hyperthermia (MTH), and at 24 h after γ-ray irradiation followed by drug (metformin (Met) for upper panel (a) or tirapazamine (TPZ) for lower panel (b)) administration, respectively. Bars represent standard errors (n = 9). In the use of Met (upper panel, a), there were significant differences (P < 0.05) in both total and Q cells including in pimonidazole-unlabeled cell fraction between any two curves except for between with MTH and with Met and between with Met and 24 h later without drug. In the use of TPZ (lower panel, b), there were significant differences (P < 0.05) in both total and Q cells including in pimonidazole-unlabeled cell fraction between any two curves.
Tables
Table 1. Surviving Fraction and Micronucleus and Apoptosis Frequencies at 0 Gy
| Total tumor cells | Quiescent cells |
|---|
| aMild temperature hyperthermia. bMean ± standard error (n = 9). The values for the combination with metformin, tirapazamine or MTH were determined 24 h after drug administration or MTH. In total tumor cells, the value of plating efficiency with tirapazamine was significantly smaller than those for other treatment groups (P < 0.05). In terms of both micronucleus and apoptosis frequencies for each treatment group, the values for quiescent cells were significantly higher than those for total tumor cells (P < 0.05). In both total and quiescent cells, the values of micronucleus and apoptosis frequencies with tirapazamine were significantly higher than those for other treatment groups (P < 0.05). |
| Plating efficiency (%) | | |
| Without drug or MTHa | 25.5 ± 3.8b | - |
| With metformin | 24.0 ± 3.6b | - |
| With tirapazamine | 18.4 ± 2.8 | - |
| With MTH | 23.4 ± 3.8 | - |
| Micronucleus frequency | | |
| Without drug or MTH | 0.023 ± 0.003 | 0.033 ± 0.006 |
| With metformin | 0.033 ± 0.004 | 0.043 ± 0.007 |
| With tirapazamine | 0.049 ± 0.005 | 0.134 ± 0.013 |
| With MTH | 0.039 ± 0.004 | 0.049 ± 0.008 |
| Apoptosis frequency | | |
| Without drug or MTH | 0.021 ± 0.002 | 0.032 ± 0.003 |
| With metformin | 0.021 ± 0.002 | 0.036 ± 0.004 |
| With tirapazamine | 0.027 ± 0.003 | 0.045 ± 0.004 |
| With MTH | 0.021 ± 0.002 | 0.037 ± 0.004 |
| Especially in pimonidazole-unlabeled cell fraction | | |
| Without drug or MTH | 0.017 ± 0.002 | 0.029 ± 0.003 |
| With metformin | 0.018 ± 0.002 | 0.028 ± 0.003 |
| With tirapazamine | 0.024 ± 0.003 | 0.035 ± 0.003 |
| With MTH | 0.018 ± 0.002 | 0.028 ± 0.003 |
Table 2. Dose-Modifying Factors for the Pimonidazole-Unlabeled Cell Fraction Compared With the Whole Cell Fraction in the Total or Quiescent Cell Populationa
| Total cells | Quiescent cells |
|---|
| aThe ratio of the dose of radiation necessary to obtain the net apoptosis frequency of 0.05 in a whole cell fraction to that needed to obtain the frequency in the pimonidazole unlabeled cell fraction. bMean ± standard error (n = 9). cMild temperature hyperthermia. All values shown here were significantly higher than 1.0 (P < 0.05). Immediately after irradiation, the value for quiescent cells was significantly higher than that for total tumor cells (P < 0.05). |
| Immediately after irradiation | 1.5 ± 0.1b | 1.8 ± 0.15 |
| 24 h after irradiation | | |
| Without drug or MTHc | 1.3 ± 0.1 | 1.4 ± 0.1 |
| With metformin | 1.4 ± 0.1 | 1.5 ± 0.1 |
| With tirapazamine | 1.2 ± 0.1 | 1.25 ± 0.1 |
| With MTH | 1.45 ± 0.1 | 1.6 ± 0.15 |
Table 3. Dose-Modifying Factors due to Delayed Assaya
| Without drug | With metformin | With tirapazamine | With MTHb |
|---|
| aThe ratio of the dose of radiation necessary to obtain each end-point with a delayed assay to that needed to obtain each end-point with an assay immediately after irradiation. bMild temperature hyperthermia. cMean ± standard error (n = 9). In both total and quiescent cells, the values with metformin were significantly smaller than those without drug in terms of surviving fraction, net micronucleus frequency and net apoptosis frequency (P < 0.05). In both total and quiescent cells, the values with tirapazamine were significantly smaller than those for any other treatment group in terms of surviving fraction, net micronucleus frequency and net apoptosis frequency (P < 0.05). |
| Surviving fraction = 0.01 | | | | |
| Total cells | 1.3 ± 0.1c | 1.15 ± 0.05 | 0.9 ± 0.05 | 1.15 ± 0.05 |
| Net micronucleus frequency = 0.25 | | | | |
| Total cells | 1.3 ± 0.1 | 1.05 ± 0.05 | 0.9 ± 0.05 | 1.15 ± 0.05 |
| Quiescent cells | 1.45 ± 0.1 | 1.1 ± 0.05 | 0.95 ± 0.05 | 1.2 ± 0.05 |
| Net apoptosis frequency = 0.05 | | | | |
| Total cells | 1.25 ± 0.1 | 1.05 ± 0.05 | 0.9 ± 0.05 | 1.15 ± 0.05 |
| Especially in pimonidazole-unlabeled cell fraction | 1.3 ± 0.1 | 1.15 ± 0.05 | 1.05 ± 0.05 | 1.2 ± 0.05 |
| Quiescent cells | 1.35 ± 0.1 | 1.1 ± 0.05 | 0.95 ± 0.05 | 1.2 ± 0.05 |
| Especially in pimonidazole-unlabeled cell fraction | 1.65 ± 0.15 | 1.2 ± 0.05 | 1.1 ± 0.05 | 1.3 ± 0.1 |
Table 4. Dose-Modifying Factors for Quiescent Cells Relative to Total Tumor Cellsa
| Immediately after irradiation | 24 h after irradiation |
|---|
| Without drug | With metformin | With tirapazamine | With MTHb |
|---|
| aThe ratio of the dose of radiation necessary to obtain each end-point in the quiescent cell population to that needed to obtain each end-point in the total tumor cell population. bMild temperature hyperthermia. cMean ± standard error (n = 9). In terms of both net micronucleus and net apoptosis frequencies, the value with tirapazamine was significantly smaller than that without drug including in pimonidazole-unlabeled cell fraction (P < 0.05). |
| Net micronucleus frequency = 0.25 | 1.7 ± 0.15c | 1.9 ± 0.15 | 1.7 ± 0.15 | 1.6 ± 0.15 | 1.8 ± 0.15 |
| Net apoptosis frequency = 0.05 | 1.45 ± 0.1 | 1.6 ± 0.15 | 1.4 ± 0.1 | 1.3 ± 0.1 | 1.5 ± 0.1 |
| Especially in pimonidazole-unlabeled cell fraction | 1.25 ± 0.1 | 1.4 ± 0.1 | 1.25 ± 0.1 | 1.2 ± 0.1 | 1.3 ± 0.1 |