Figures
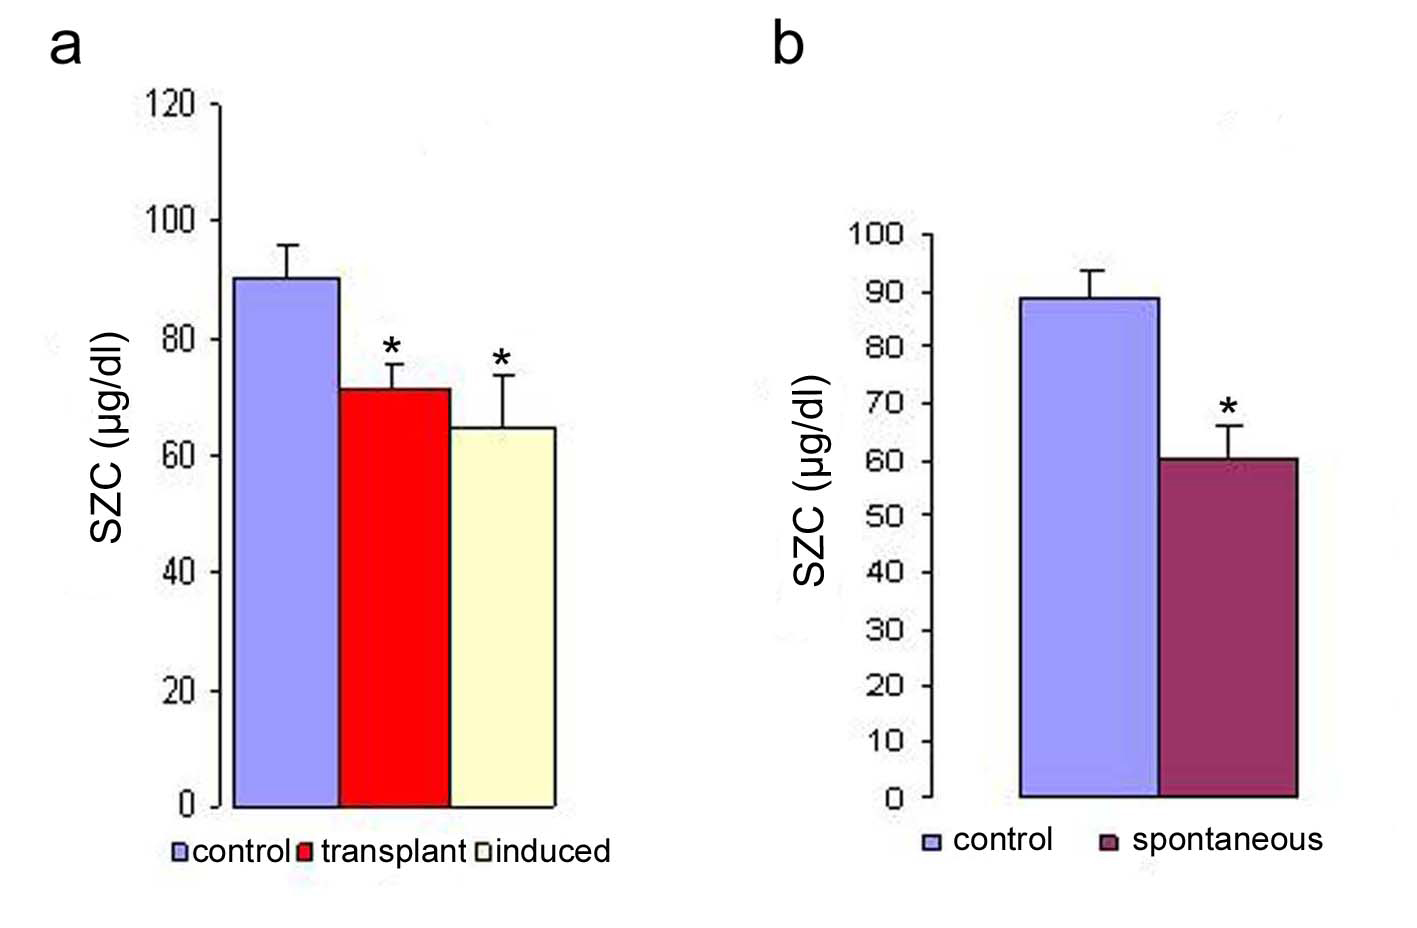
Figure 1. Serum zinc concentration in transplanted, induced (a) and spontaneous (b) tumor bearing mice. The serum zinc concentration was determined in the different types of tumor. The zinc concentration is expressed as µg/dl. Data are shown as mean ± SEM. The results were considered statistically significant when the values in the experimental group were significantly different from controls (* p < 0.05).
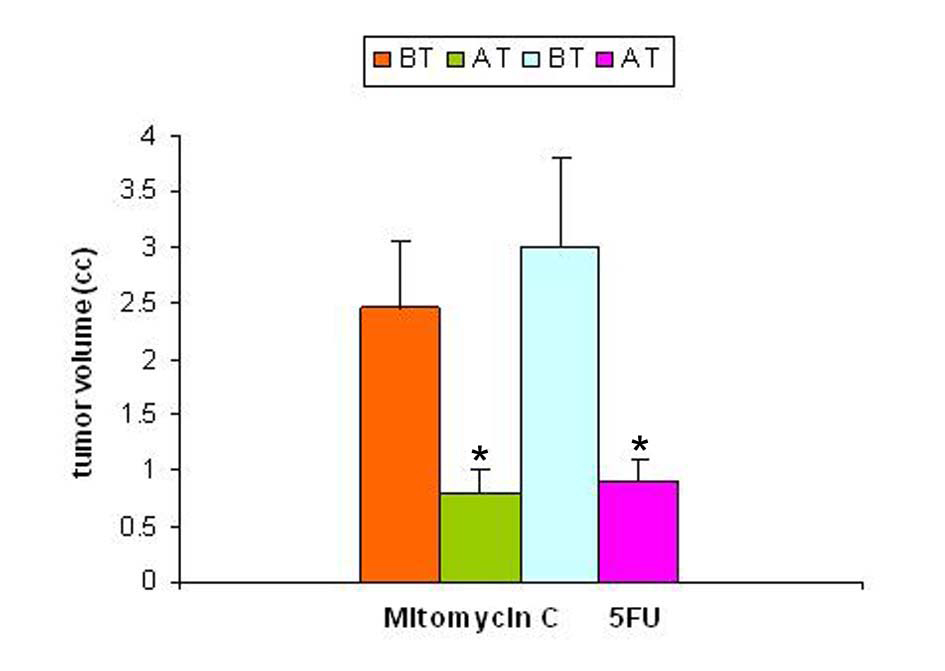
Figure 2. Tumor volume pre- and post-treatment with anti-cancer drugs. The tumor volume was determined prior to and following treatment with two anti-cancer agents 5-flurouracil and mitomycin C. In both the groups there was a significant decrease in tumor volume following treatment (p < 0.05).
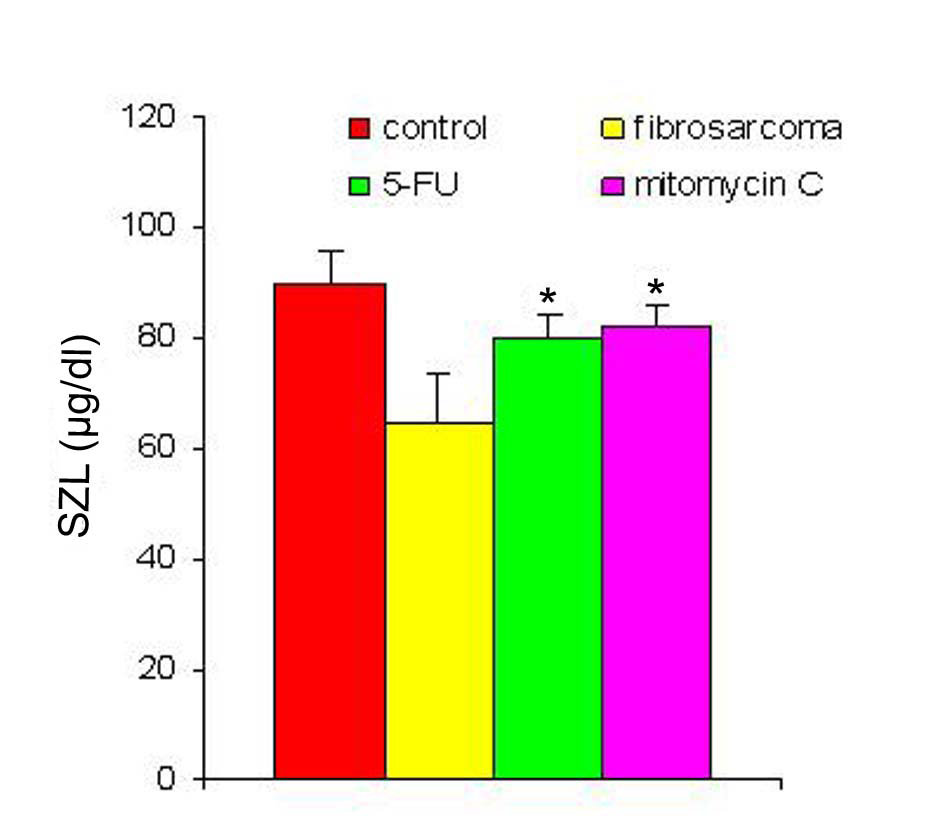
Figure 3. SZL pre- and post-treatment with anti-cancer drugs. The serum zinc concentration was determined prior to and following treatment with two anti-cancer agents. The zinc concentration is expressed as µg/dl. Data are shown as mean ± SEM. In both the groups there was significant elevation in SZL following treatment with anti-cancer agents. * Indicates level of significance p < 0.05.
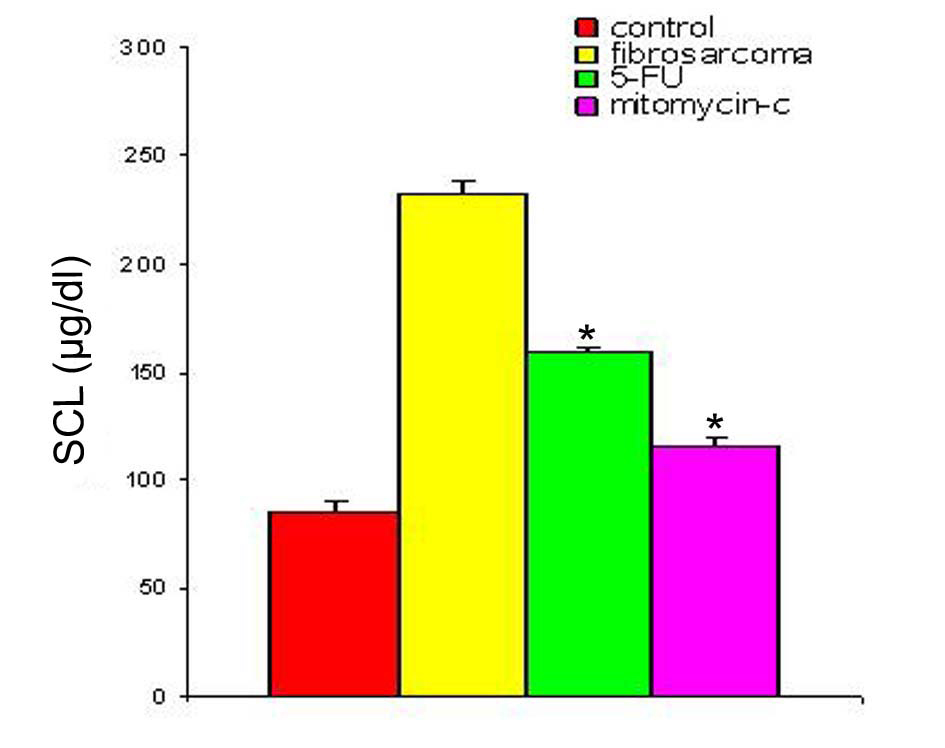
Figure 4. SCL in animals with fibro-sarcoma pre- and post-treatment with anti-cancer drugs. The serum copper concentration was determined prior to and following treatment with two anti-cancer agents. The copper concentration is expressed as µg/dl. Data are shown as mean ± SEM. In both the groups there was significant depression in SCL in the induced tumor bearing animals following treatment with anti-cancer agents. * Indicates level of significance p < 0.05.
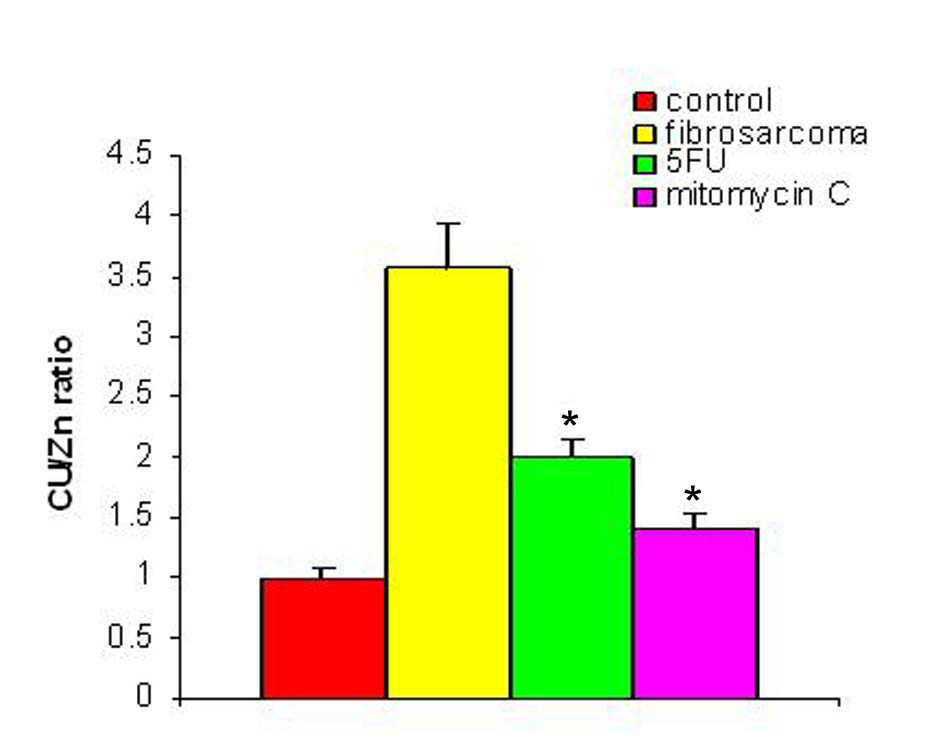
Figure 5. Cu/Zn ratio pre- and post-treatment with anti-cancer drugs. The figure shows the value of copper/zinc ratio prior to and following treatment with two anti-cancer agents in the induced tumor bearing animals. * Indicates level of significance p < 0.05.
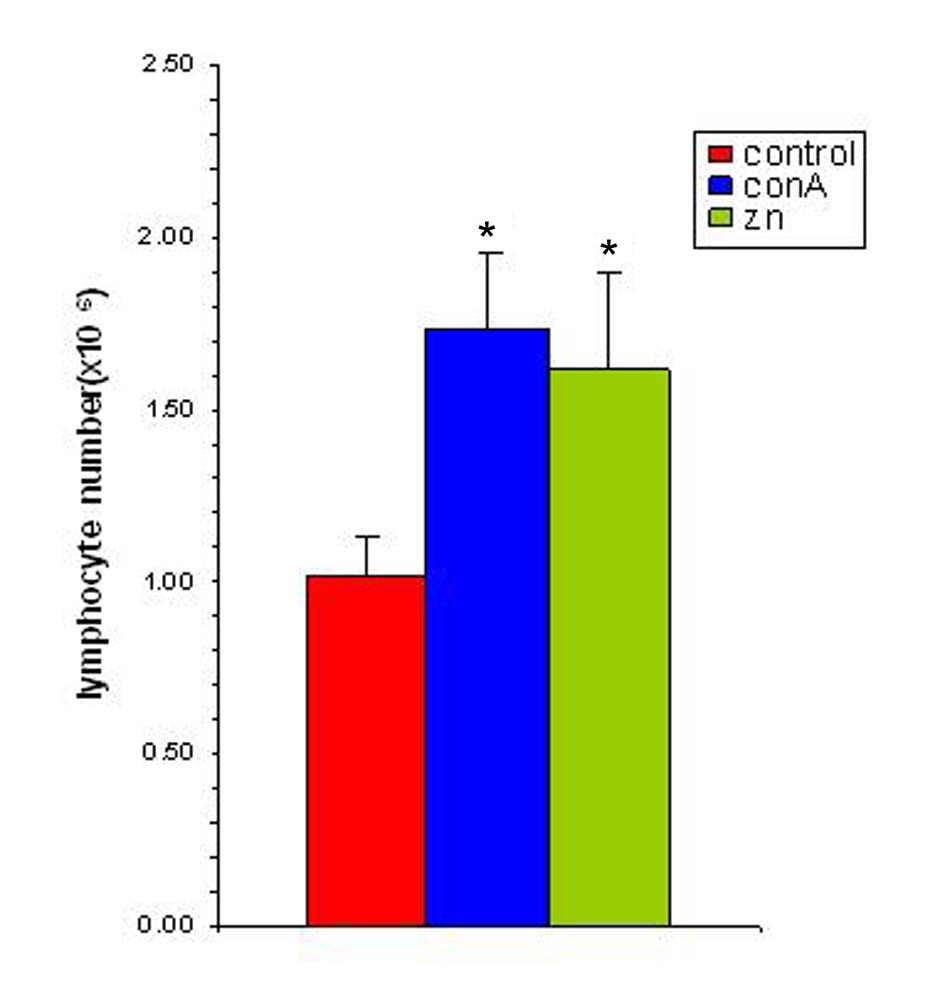
Figure 6. Zinc supplementation increases splenocyte proliferation in vitro. The splenocyte proliferation was determined following supplementation with zinc (25 µM) and in presence of ConA (1 µg/ml). The results are expressed as mean ± SEM. * Indicates level of significance p < 0.05.
Tables
Table 1. Serum Zinc Concentration in Normal Controls
| Control | Number of animals | Serum Zinc concentration (µg/dl) |
|---|
| The zinc concentration is expressed as µg/dl. The results are shown as mean ± SEM. |
| Male strain A | 30 | 90.2 ± 5.1 |
| Female C3H | 10 | 89.1 ± 5.6 |
Table 2. Serum Zinc Concentration is in Transplanted Tumor Bearing Mice at Different Time Points Post Tumor Transplantation
| Animal | Number | Day | Cell count | Serum Zn conc. (µg/dl) |
|---|
| The serum zinc concentration was determined in the different transplanted tumor bearing animals after inoculating 1 x 10⁷viable tumor cells in the peritoneal cavity. Forty-five animals were used in each class of transplanted tumors. In all the three types of tumors there was depression in SZC. The zinc concentration is expressed as µg/dl. The results are shown as mean ± SEM. The star (*) indicates statistically significant at p < 0.05. |
| Control | 15 | - | - | 90.2 ± 5.6 |
| S-180 | 45 | 7 | 30.9 ± 5.2 | 83.2 ± 5.0 |
| | 10 | 59.2 ± 7.2 | 80.1 ± 6.1 |
| | 17 | 196.2 ± 2.1 | 76.9 ± 3.3* |
| Ehrlich | 45 | 7 | 13.8 ± 3.8 | 82.1 ± 5.0 |
| | 10 | 68.0 ± 3.9 | 79.0 ± 4.1 |
| | 17 | 230 ± 15.2 | 74.2 ± 3.1* |
| Dalton | 45 | 7 | 45.3 ± 2.6 | 86.1 ± 5.1 |
| | 10 | 105.2 ± 5.2 | 84.1 ± 4.2 |
| | 17 | 290.3 ± 10.5 | 82.3 ± 4.5 |