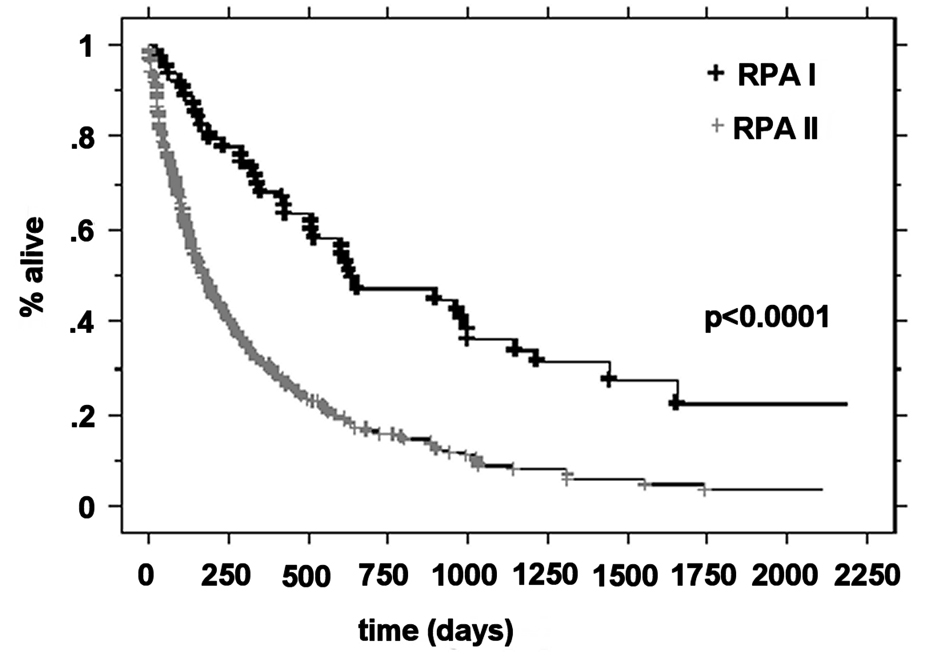
Figure 1. Kaplan-Meier curves for the overall survival time for RPA class.
| World Journal of Oncology, ISSN 1920-4531 print, 1920-454X online, Open Access |
| Article copyright, the authors; Journal compilation copyright, World J Oncol and Elmer Press Inc |
| Journal website http://www.wjon.org |
Original Article
Volume 4, Number 1, February 2013, pages 37-45
Outcome Improvement in RPA I or II Patients With 1 or 2 Brain Metastases by Combined Surgery and Radiotherapy
Figures
Tables
| Characteristic | Value | P | ||
|---|---|---|---|---|
| Entire series (n = 329) No (%) | Surgical group (n = 104) No (%) | Radiation group (n = 225) No (%) | ||
| KPS: karnofsky performance status; BM: brain metastases; ECM: extracranial metastases; RPA: recursive partitioning analysis; GI: gastrointestinal; RCC: renal cell carcinoma. | ||||
| Age (y) | 0.02 | |||
| Median | 61.4 (20.9 - 86.2) | 58.5 (38.6 - 78.3) | 63.8 (20.9 - 86.2) | |
| Gender (n) | 0.8 | |||
| Male | 223 (67.8) | 59 (56.7) | 164 (72.9) | |
| Female | 106 (32.2) | 45 (43.3) | 61 (27.1) | |
| KPS (n) | 0.61 | |||
| 70 - 80 | 203 (61.7) | 50 (48.1) | 153 (68.0) | |
| 90 - 100 | 126 (38.3) | 54 (51.9) | 72 (32.0) | |
| BM (n) | 0.9 | |||
| 1 | 227 (69.0) | 94 (90.4) | 133 (59.1) | |
| 2 | 102 (31.0) | 10 (9.6) | 92 (40.9) | |
| ECM (n) | 0.9 | |||
| Yes | 217 (66.0) | 47 (45.2) | 170 (75.6) | |
| No | 112 (34.0) | 57 (54.8) | 55 (24.4) | |
| Number of ECM (n) | 0.33 | |||
| 1 | 101 (46.5) | 33 (70.2) | 68 (40.0) | |
| ≥ 2 | 116 (53.5) | 14 (29.8) | 102 (60.0) | |
| Control of primary tumor (n) | 0.9 | |||
| Yes | 141 (42.9) | 54 (51.9) | 87 (38.7) | |
| No | 188 (57.1) | 50 (48.1) | 138 (61.3) | |
| Neurological symptoms (n) | 0.86 | |||
| Yes | 204 (62.0) | 82 (78.8) | 122 (54.2) | |
| No | 125 (38.0) | 22 (21.2) | 103 (45.8) | |
| Boost (n) | 0.28 | |||
| Yes | 242 (73.6) | 95 (91.4) | 147 (65.3) | |
| No | 87 (26.4) | 9 (8.6) | 78 (34.7) | |
| RPA (n) | 0.75 | |||
| Class I | 63 (19.1) | 46 (44.2) | 17 (7.6) | |
| Class II | 266 (80.9) | 58 (55.8) | 208 (92.4) | |
| Site of primary tumor (n) | 0.002 | |||
| Lung | 205 (62.3) | 56 (53.8) | 149 (66.2) | |
| Breast | 33 (10.0) | 13 (12.5) | 20 (8.9) | |
| Melanoma | 20 (6.1) | 9 (8.7) | 11 (4.9) | |
| GI | 27 (8.2) | 10 (9.6) | 17 (7.6) | |
| RCC | 16 (4.9) | 9 (8.7) | 7 (3.1) | |
| Other | 28 (8.5) | 7 (6.7) | 21 (9.3) | |
| At 6 months (%) | At 12 months (%) | At 18 months (%) | At 24 months (%) | At 36 months (%) | P | |
|---|---|---|---|---|---|---|
| Local control | ||||||
| Surgical group | 92.7 | 91.1 | 91.1 | 91.1 | 83.9 | 0.005 |
| Radiation group | 88.9 | 81.2 | 72.6 | 63.1 | 57.3 | |
| Brain control | ||||||
| Surgical group | 87 | 73.2 | 68.9 | 66.9 | 56 | 0.2 |
| Radiation group | 86.2 | 75.7 | 63 | 49.6 | 42.4 | |
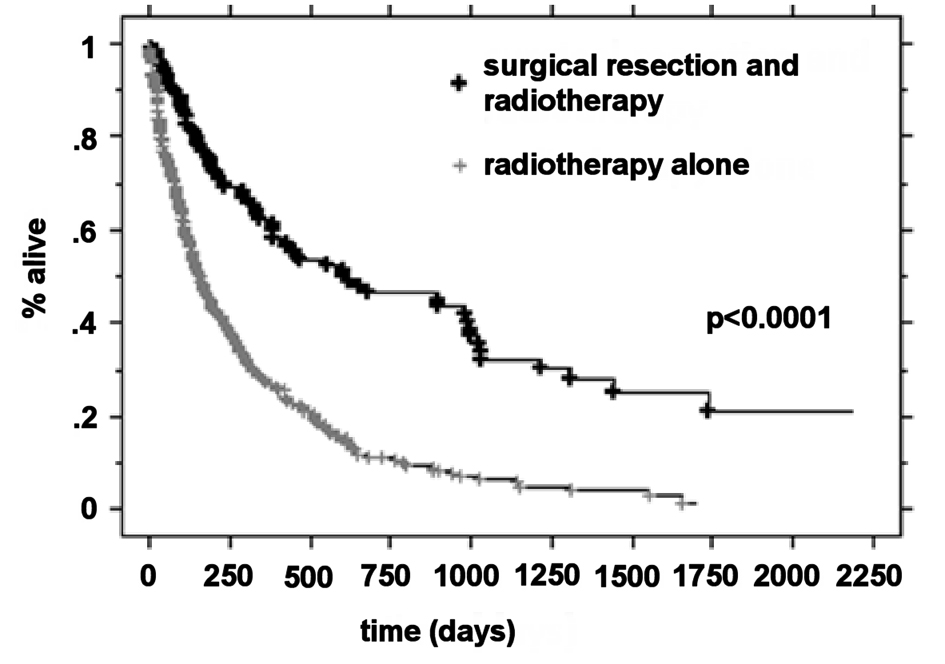
| Overall survival | ||||||
| Surgical group | 75.7 | 62.1 | 52.5 | 46.5 | 32 | < 0.0001 |
| Radiation group | 45.6 | 27.1 | 17.8 | 10.5 | 6.1 | |
| Brain recurrence n | Local recurrence n (%) | Regional recurrence n (%) | Both n (%) | Unknown n (%) | |
|---|---|---|---|---|---|
| Surgical group (n = 104) | 35 | 7 (20) | 25 (71.4) | 3 (8.6) | |
| Radiation group (n = 225) | 47 | 22 (46.8) | 15 (31.9) | 9 (19.2) | 1 (2.1) |
| Total (n = 329) | 82 | 29 (35.4) | 40 (48.8) | 12 (14.6) | 1 (1.2) |