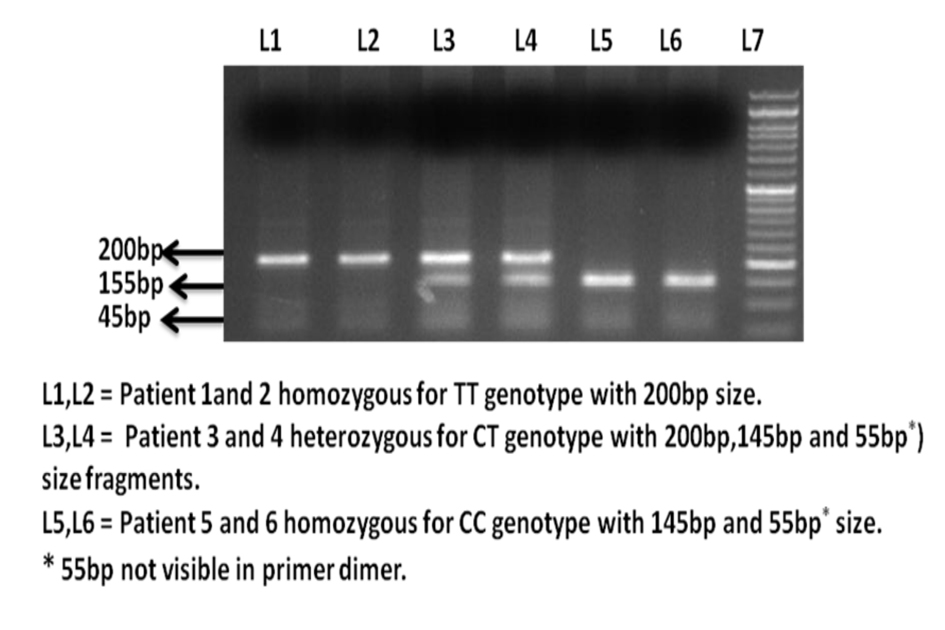
Figure 1. Ethidium bromide stained agarose gel electrophoresis image of H-RAS T81C polymorphism.
| World Journal of Oncology, ISSN 1920-4531 print, 1920-454X online, Open Access |
| Article copyright, the authors; Journal compilation copyright, World J Oncol and Elmer Press Inc |
| Journal website http://www.wjon.org |
Original Article
Volume 6, Number 2, April 2015, pages 321-328
Polymorphism T81C in H-RAS Oncogene Is Associated With Disease Progression in Imatinib (TKI) Treated Chronic Myeloid Leukemia Patients
Figures
Tables
| Complete or major hematological response | Partial or minor hematological response | Lose or minimal hematological response |
|---|---|---|
| Platelet count >150 × 109/L WBC count < 10 × 109/L Basophils: < 5% Differential without immature granulocytes Absence of blasts and promyelocytes in peripheral blood Spleen: non-palpable spleen | Platelet count < 450 × 109/L WBC count > 10 × 109/L Basophils: > 10% Presence of blasts and promyelocytes in peripheral blood Spleen: palpable spleen | Platelet count < 450 × 109/L WBC count > 20 × 109/L Basophils: 15% Presence of blasts and promyelocytes in peripheral blood Spleen: palpable spleen |
| Major molecular response | Minimal or no molecular response |
|---|---|
| *BCR-ABL to control gene ratio according to international scale (IS). | |
| It indicates non-quantifiable and non-detectable BCR-ABL gene transcript (BCR-ABL/ABL) ≤ 0.103* check every 3 months | It indicates quantifiable and detectable BCR-ABL gene transcript (BCR-ABL/ABL) ≥ 0.103* check every 3 months |
| BCR-ABL primers |
|---|
| C5e 5'-ATAGGATCCTTTGCAACCGGGTCTGAA-3' |
| B2B 5'-ACAGAATTCCGCTGACCATCAATAAG-3' |
| BCR-C 5'-ACCGCATGTTCCGGGACAAAAG-3' |
| CA3 5'-TGTTGACTGGCGTGATGTAGTTGCTTGG-3' |
| Gene | H-RAS |
|---|---|
| Forward primer | 5'-CTTGGCAGGTGGGGCAGGAGA-3' |
| Reverse primer | 5'-GGCACCTGGACGGCGGCGCTAG-3' |
| No. | % | |
|---|---|---|
| Patients | 100 | 100% |
| controls | 100 | 100% |
| Males | 65 | 65% |
| Female | 35 | 35% |
| CP-CML | 50 | 50% |
| AP-CML | 25 | 25% |
| BC-CML | 25 | 25% |
| Imatinib | 100 | 100% |
| MMR | 52 | 52% |
| No MR | 48 | 48% |
| MHR | 50 | 50% |
| Minor HR | 10 | 10% |
| Loss HR | 40 | 40% |
| Age > 45 | 36 | 36% |
| Age < 45 | 64 | 64% |
| Thrombocytopenia | 50 | 50% |
| No thrombocytopenia | 50 | 50% |
| Clinical features | No. | TT | CT | CC | P value |
|---|---|---|---|---|---|
| Patients | 100 | 38 | 61 | 1 | < 0.0001 |
| Controls | 100 | 92 | 8 | 0 | |
| Males | 65 | 25 | 39 | 1 | < 0.7 |
| Female | 35 | 13 | 22 | 0 | |
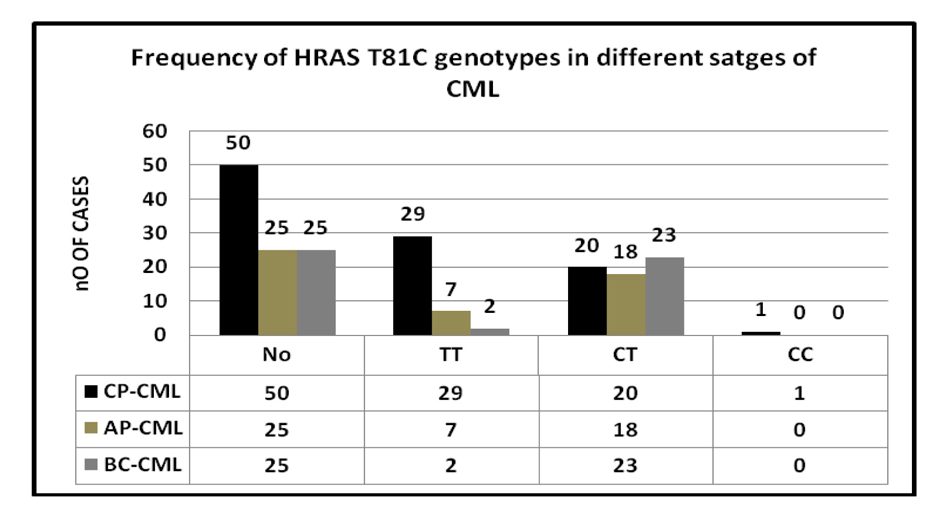
| CP-CML | 50 | 29 | 20 | 1 | < 0.0003 |
| AP-CML | 25 | 7 | 18 | 0 | |
| BC-CML | 25 | 2 | 23 | 0 | |
| A2b2 | 31 | 13 | 18 | 0 | < 0.9 |
| A2b3 | 67 | 24 | 42 | 1 | |
| A2b2/A2b3 | 2 | 1 | 1 | 0 | |
| Imatinib | 100 | 38 | 61 | 1 | |
| MMR | 52 | 31 | 21 | 0 | < 0.0001 |
| No MR | 48 | 7 | 40 | 1 | |
| MHR | 50 | 26 | 24 | 0 | < 0.04 |
| Minor HR | 10 | 3 | 7 | 0 | |
| Loss HR | 40 | 9 | 30 | 1 | |
| Age > 45 | 36 | 11 | 24 | 1 | < 0.2 |
| Age ≤ 45 | 64 | 27 | 37 | 0 | |
| Thrombocytopenia | 50 | 11 | 38 | 1 | < 0.003 |
| No thrombocytopenia | 50 | 27 | 23 | 0 |
| Genotyping | Cases (n = 100) | Control (100) | OR* (95% CI) | P value |
|---|---|---|---|---|
| OR: odds ratio. | ||||
| TT | 38 (38%) | 92(92%) | 1 | |
| TC | 61 (61%) | 8 (8%) | 18.4 (8.0-14.2) | < 0.0001 |
| CC | 1 (61%) | 0 (0%) | - | |
| Allele type | ||||
| T allele | 136(68.6%) | 184(95.8%) | 1 | |
| C allele | 62 (32.2%) | 8 (4.1%) | 10.4 (4.8-22.6) | < 0.0001 |
| Cancer type | TT genotype | CT genotype | CC genotype | References |
|---|---|---|---|---|
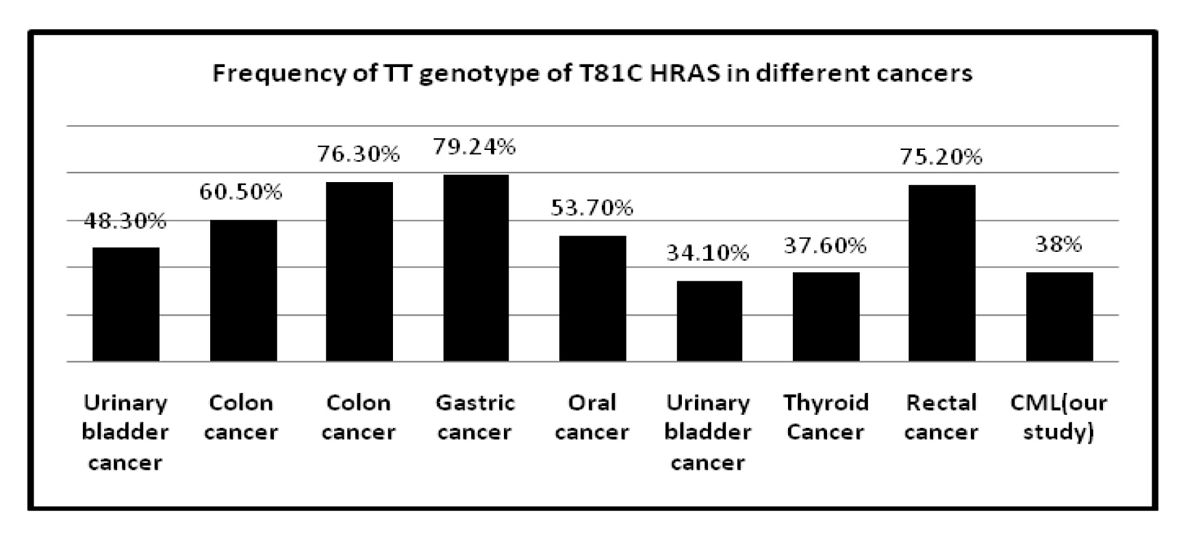
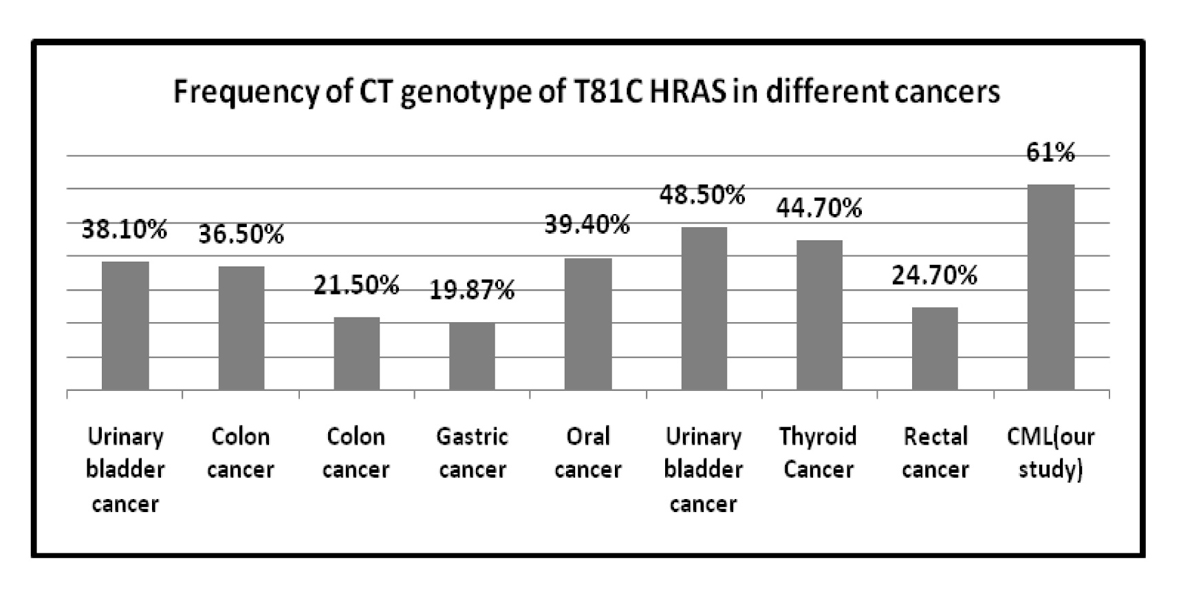
| Rectal cancer | 75.2% | 24.7% | 0% | 16 |
| Colon cancer | 76.3% | 21.5% | 2.1% | 16 |
| Gastric cancer | 79.24% | 19.87% | 0.89% | 16 |
| Thyroid cancer | 37.6% | 44.7% | 17.7% | 29 |
| Urinary bladder cancer | 48.3% | 38.1% | 13.4% | 34 |
| Colon cancer | 60.5% | 36.5% | 3% | 35 |
| Oral cancer | 53.7% | 39.4% | 6% | 36 |
| Urinary bladder cancer | 34.1% | 48.5% | 17.4% | 37 |