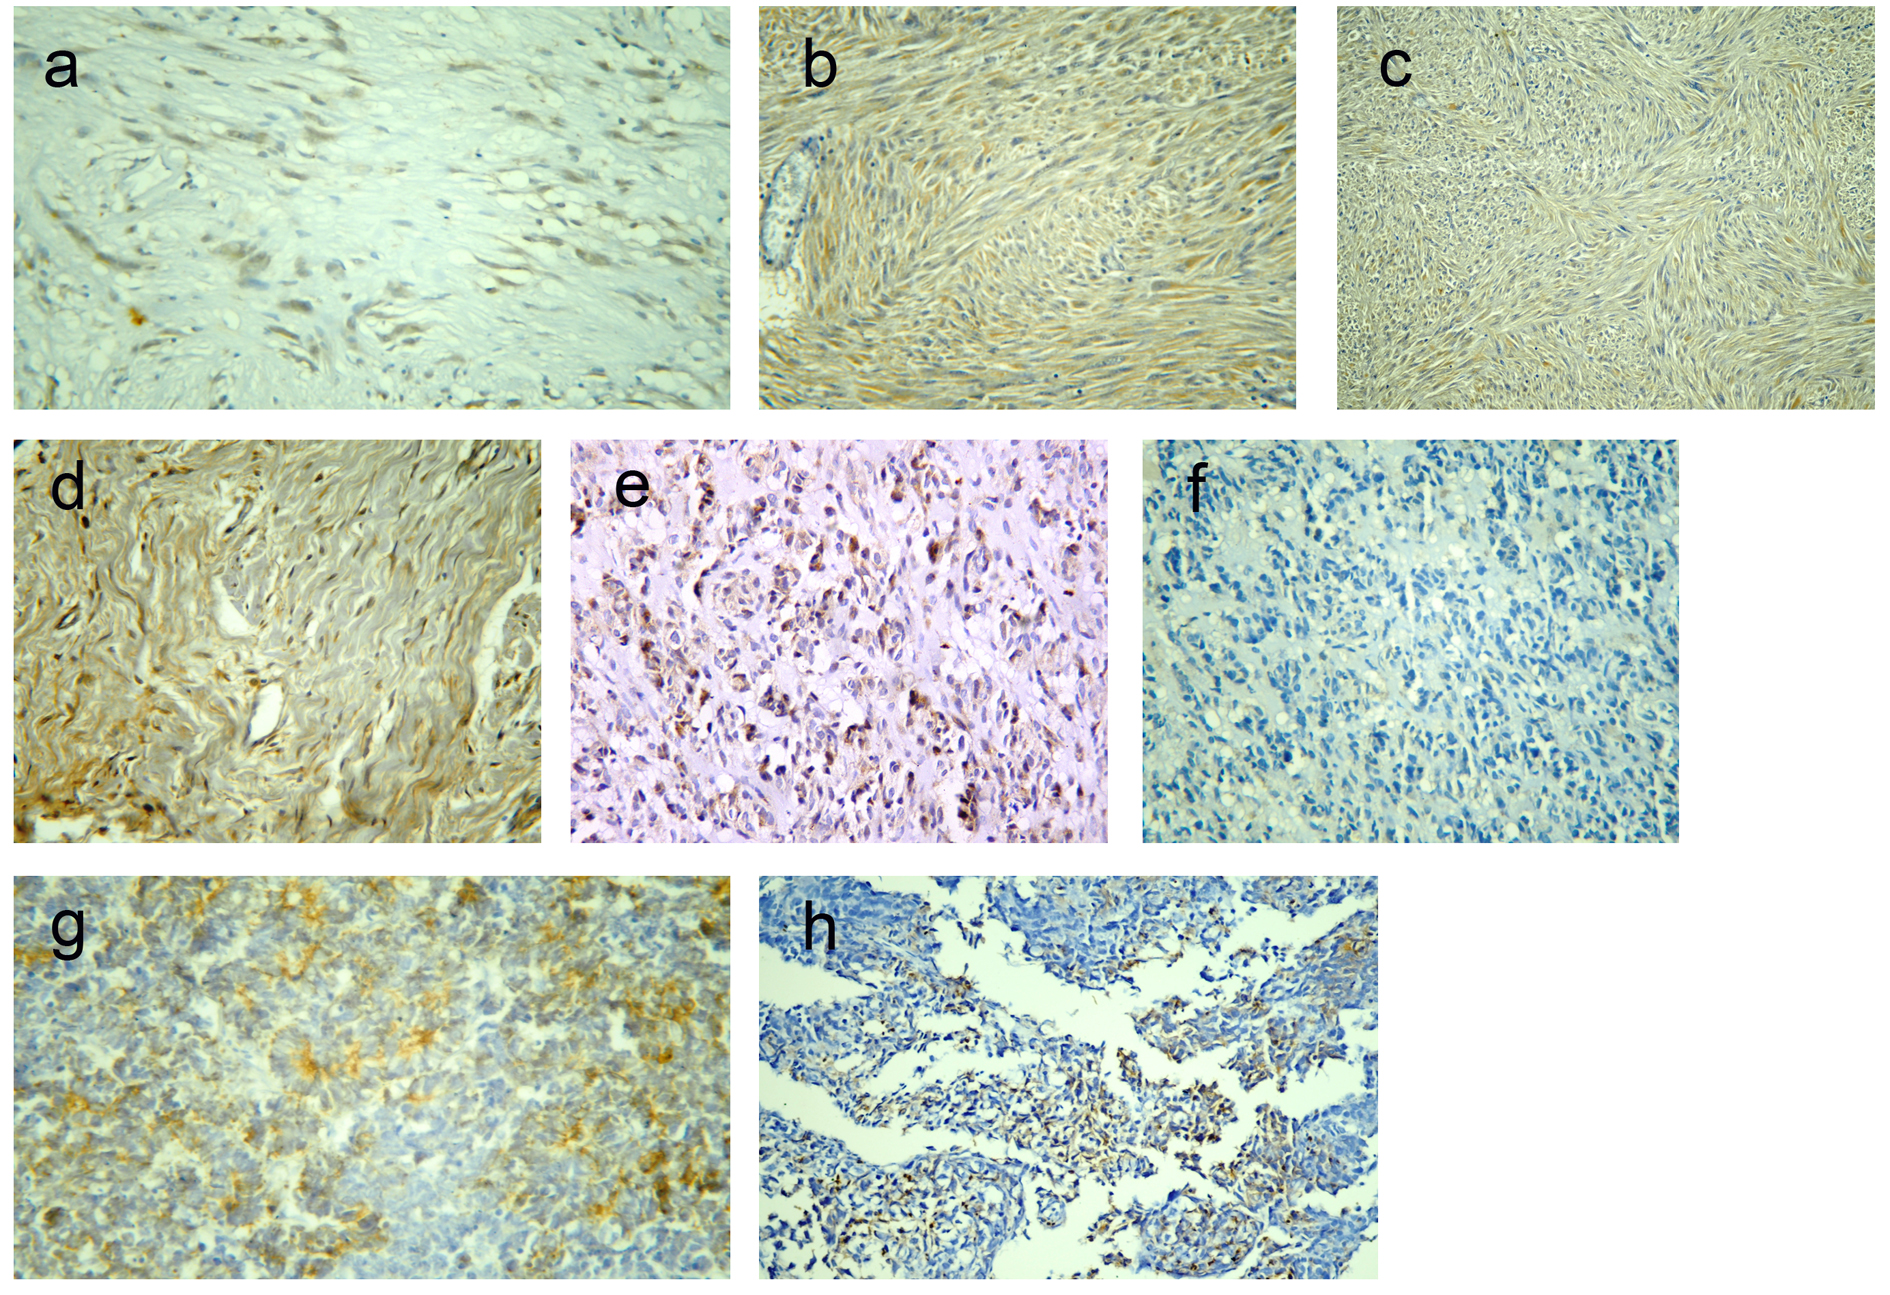
| World Journal of Oncology, ISSN 1920-4531 print, 1920-454X online, Open Access |
| Article copyright, the authors; Journal compilation copyright, World J Oncol and Elmer Press Inc |
| Journal website http://www.wjon.org |
Original Article
Volume 6, Number 3, June 2015, pages 355-363
Does Immunohistochemistry for Discovered on GIST1 and Minichromosome Maintenance Protein7 Provide Additional Clinicopathological Value in Gastrointestinal Stromal Tumors?
Figures


Tables
| Clinicopathological characteristics | n (%) |
|---|---|
| Gender | |
| Male | 24 (55.8%) |
| Female | 19 (44.2%) |
| Tumor location | |
| Gastric | 28 (65.1%) |
| Small intestine | 14 (32.6%) |
| Colon | 1 (2.3%) |
| Tumor type | |
| Spindle | 34 (79%) |
| Epithelioid | 6 (14% |
| Mixed | 3 (7%) |
| Tumor size | |
| ≤ 5 cm | 3 (7%) |
| > 5 - 10 cm | 11 (25.6%) |
| > 10 cm | 29 (67.4%) |
| Tumor mitotic rate | |
| ≤ 5/50 HPF | 24 (55.8%) |
| > 5/50 HPF | 19 (44.2%) |
| Risk | |
| Low | 9 (20.9%) |
| Intermediate | 11 (25.6%) |
| High | 23 (53.5%) |
| TP | FN | TN | FP | Sensitivity | Specificity | PPV | NPV | Accuracy | |
|---|---|---|---|---|---|---|---|---|---|
| TN: true negative; TP: true positive; FN: false negative; FP: false positive; PPV: positive predictive value; NPV: negative predictive value. | |||||||||
| DOG1 | 42 | 1 | 29 | 1 | 97.67% | 96.67% | 97.67% | 96.67% | 97.26% |
| KIT | 39 | 4 | 25 | 5 | 90.70% | 83.33% | 88.64% | 86.21% | 87.67% |
| Variables | n | DOG1 expression score | C-KIT expression score | ||||
|---|---|---|---|---|---|---|---|
| Score 0, 1, 2 | Score 3, 4 | P-value | Score 0, 1, 2 | Score 3, 4 | P-value | ||
| SI: small intestine. Tests of significance: Chi-square test and Fisher’s exact tests. P-value ≤ 0.05 is considered significant. | |||||||
| Age | 0.359 | 0.219 | |||||
| < 57 years | 20 | 7 (35.0%) | 13 (65.0%) | 11 (55.0%) | 9 (45.0%) | ||
| ≥ 57 years | 23 | 12 (52.2%) | 11 (47.8%) | 17 (73.9%) | 6 (26.1%) | ||
| Gender | 1.000 | 0.521 | |||||
| Male | 24 | 11 (45.8%) | 13 (54.2%) | 17 (70.8%) | 7 (29.2%) | ||
| Female | 19 | 8 (42.1%) | 11 (57.9%) | 11 (57.9%) | 8 (42.1%) | ||
| Tumor location | 0.453 | 0.375 | |||||
| Gastric | 28 | 14 (50%) | 14 (50%) | 19 (67.9%) | 9 (32.1%) | ||
| SI | 14 | 5 (35.7%) | 9 (64.3%) | 9 (64.3%) | 5 (35.7%) | ||
| Colon | 1 | - | 1 (100%) | - | 1 (100%) | ||
| Tumor type | 0.473 | 0.215 | |||||
| Spindle | 34 | 14 (41.2%) | 20 (58.8%) | 20 (58.8%) | 14 (41.2%) | ||
| Epithelioid | 6 | 4 (66.7%) | 2 (33.3%) | 5 (83.3%) | 1 (16.7%) | ||
| Mixed | 3 | 1 (33.3%) | 2 (66.7%) | 3 (100%) | - | ||
| Tumor size | 0.023 | 0.121 | |||||
| ≤ 5 cm | 3 | 3 (100%) | - | 3 (100%) | - | ||
| > 5 - 10 cm | 11 | 7 (63.6%) | 4 (36.4%) | 9 (81.8%) | 2 (18.2%) | ||
| > 10 cm | 29 | 9 (31.0%) | 20 (69.0%) | 16 (55.2%) | 13 (44.8%) | ||
| Tumor mitotic rate | 0.217 | 0.521 | |||||
| ≤ 5/50 HPF | 24 | 13 (54.2%) | 11 (45.8%) | 17 (70.8%) | 7 (29.2%) | ||
| > 5/50 HPF | 19 | 6 (31.6%) | 13 (68.4%) | 11 (57.9%) | 8 (42.1%) | ||
| Risk | 0.037 | 0.121 | |||||
| Low | 9 | 6 (66.7%) | 3 (33.3%) | 8 (88.9%) | 1 (11.1%) | ||
| Intermediate | 11 | 7 (63.6%) | 4 (36.4%) | 8 (72.7%) | 3 (27.3%) | ||
| High | 23 | 6 (26.1%) | 17 (73.9%) | 12 (52.2%) | 11 (47.8%) | ||
| Metastasis | 1.000 | 0.692 | |||||
| Yes | 8 | 4 (50%) | 4 (50%) | 6 (75.0%) | 2 (25.0%) | ||
| No | 35 | 15 (42.9%) | 20 (57.1%) | 22 (62.9%) | 13 (37.1%) | ||
| Variables | MCM7 LIs | Ki-67 LIs | ||||
|---|---|---|---|---|---|---|
| Mean ± SD | Median (min-max) | P-value | Mean ± SD | Median (min-max) | P-value | |
| SI: small intestine. LIs: labeling indices (%). Tests of significance: Mann-Whitney and Kruskal-Wallis tests. P-value ≤ 0.05 is considered significant. | ||||||
| Age | 0.874 | 0.825 | ||||
| < 57 years | 15.90 ± 9.68 | 12 (3 - 38) | 8.05 ± 6.90 | 6 (0 - 20) | ||
| ≥ 57 years | 15.52 ± 12.52 | 13 (0 - 60) | 7.82 ± 7.36 | 6 (0 - 33) | ||
| Gender | 0.216 | 0.101 | ||||
| Male | 17.91 ± 13.45 | 19 (0 - 60) | 9.70 ± 8.52 | 9 (0 - 33) | ||
| Female | 12.89 ± 6.67 | 12 (4 - 30) | 5.68 ± 3.78 | 5 (0 - 13) | ||
| Tumor location | 0.926 | 0.829 | ||||
| Gastric | 16.75 ± 13.08 | 14 (0 - 60) | 8.50 ± 7.66 | 7 (0 - 33) | ||
| SI | 13.85 ± 6.31 | 12 (5 - 26) | 7.00 ± 6.11 | 5 (0 - 19) | ||
| Colon | 12 | 12 | 5 | 5 | ||
| Tumor type | 0.288 | 0.099 | ||||
| Spindle | 15.08 ± 12.13 | 12 (0 - 60) | 7.08 ± 7.25 | 5 (0 - 33) | ||
| Epithelioid | 16.83 ± 7.16 | 17 (7 - 25) | 9.50 ± 5.82 | 8 (4 - 19) | ||
| Mixed | 15.69 ± 11.16 | 18(18 - 25) | 14.33 ± 4.04 | 15 (10 - 18) | ||
| Tumor size | 0.001 | 0.003 | ||||
| ≤ 5 cm | 10.66 ± 2.30 | 12 (8 - 12) | 2.66 ± 2.30 | 4 (0 - 4) | ||
| > 5 - 10 cm | 7.27 ± 6.52 | 6 (0 - 23) | 3.54 ± 4.52 | 4 (0 - 15) | ||
| >10 cm | 19.41 ± 11.24 | 18 (5 - 60) | 10.13 ± 7.19 | 10 (0 - 33) | ||
| Tumor mitotic rate | < 0.001 | < 0.001 | ||||
| ≤ 5/50 HPF | 9.66 ± 5.56 | 10 (0 - 20) | 3.62 ± 3.29 | 4 (0 - 10) | ||
| > 5/50 HPF | 23.31 ± 11.88 | 23 (9 - 60) | 13.36 ± 6.84 | 13 (4 - 33) | ||
| Risk | < 0.001 | < 0.001 | ||||
| Low | 5.00 ± 3.84 | 5 (0 - 12) | 2.00 ± 2.44 | 0 (0 - 6) | ||
| Intermediate | 12.63 ± 4.41 | 12 (5 - 20) | 4.36 ± 3.32 | 5 (0 - 10) | ||
| High | 21.34 ± 11.78 | 20 (5 - 60) | 11.95 ± 7.11 | 12 (0 - 33) | ||
| Metastasis | 0.132 | 0.381 | ||||
| Yes | 18.75 ± 8.37 | 19 (5 - 30) | 9.12 ± 5.71 | 10 (0 - 19) | ||
| No | 15.00 ± 11.69 | 12 (0 - 60) | 7.65 ± 7.39 | 5 (0 - 33) | ||
| DOG1 score | 0.339 | 0.123 | ||||
| Score 0, 1, 2 | 15.36 ± 13.56 | 12 (0 - 60) | 6.89 ± 8.40 | 4 (0 - 33) | ||
| Score 3, 4 | 15.95 ± 9.12 | 13 (0 - 38) | 8.75 ± 5.86 | 7 (0 - 20) | ||
| C-KIT score | 0.548 | 0.572 | ||||
| Score 0, 1, 2 | 15.60 ± 12.60 | 12 (0 - 60) | 7.75 ± 7.78 | 5 (0 - 33) | ||
| Score 3, 4 | 15.86 ± 8.19 | 13 (5 - 33) | 8.26 ± 5.75 | 6 (0 - 20) | ||