World Journal of Oncology, ISSN 1920-4531 print, 1920-454X online, Open Access
Article copyright, the authors; Journal compilation copyright, World J Oncol and Elmer Press Inc
Journal website http://www.wjon.org

Original Article

Volume 6, Number 3, June 2015, pages 364-374


Correlation of NQO1 and Nrf2 in Female Genital Tract Cancer and Their Precancerous Lesions (Cervix, Endometrium and Ovary)

Figures

Figure 1.
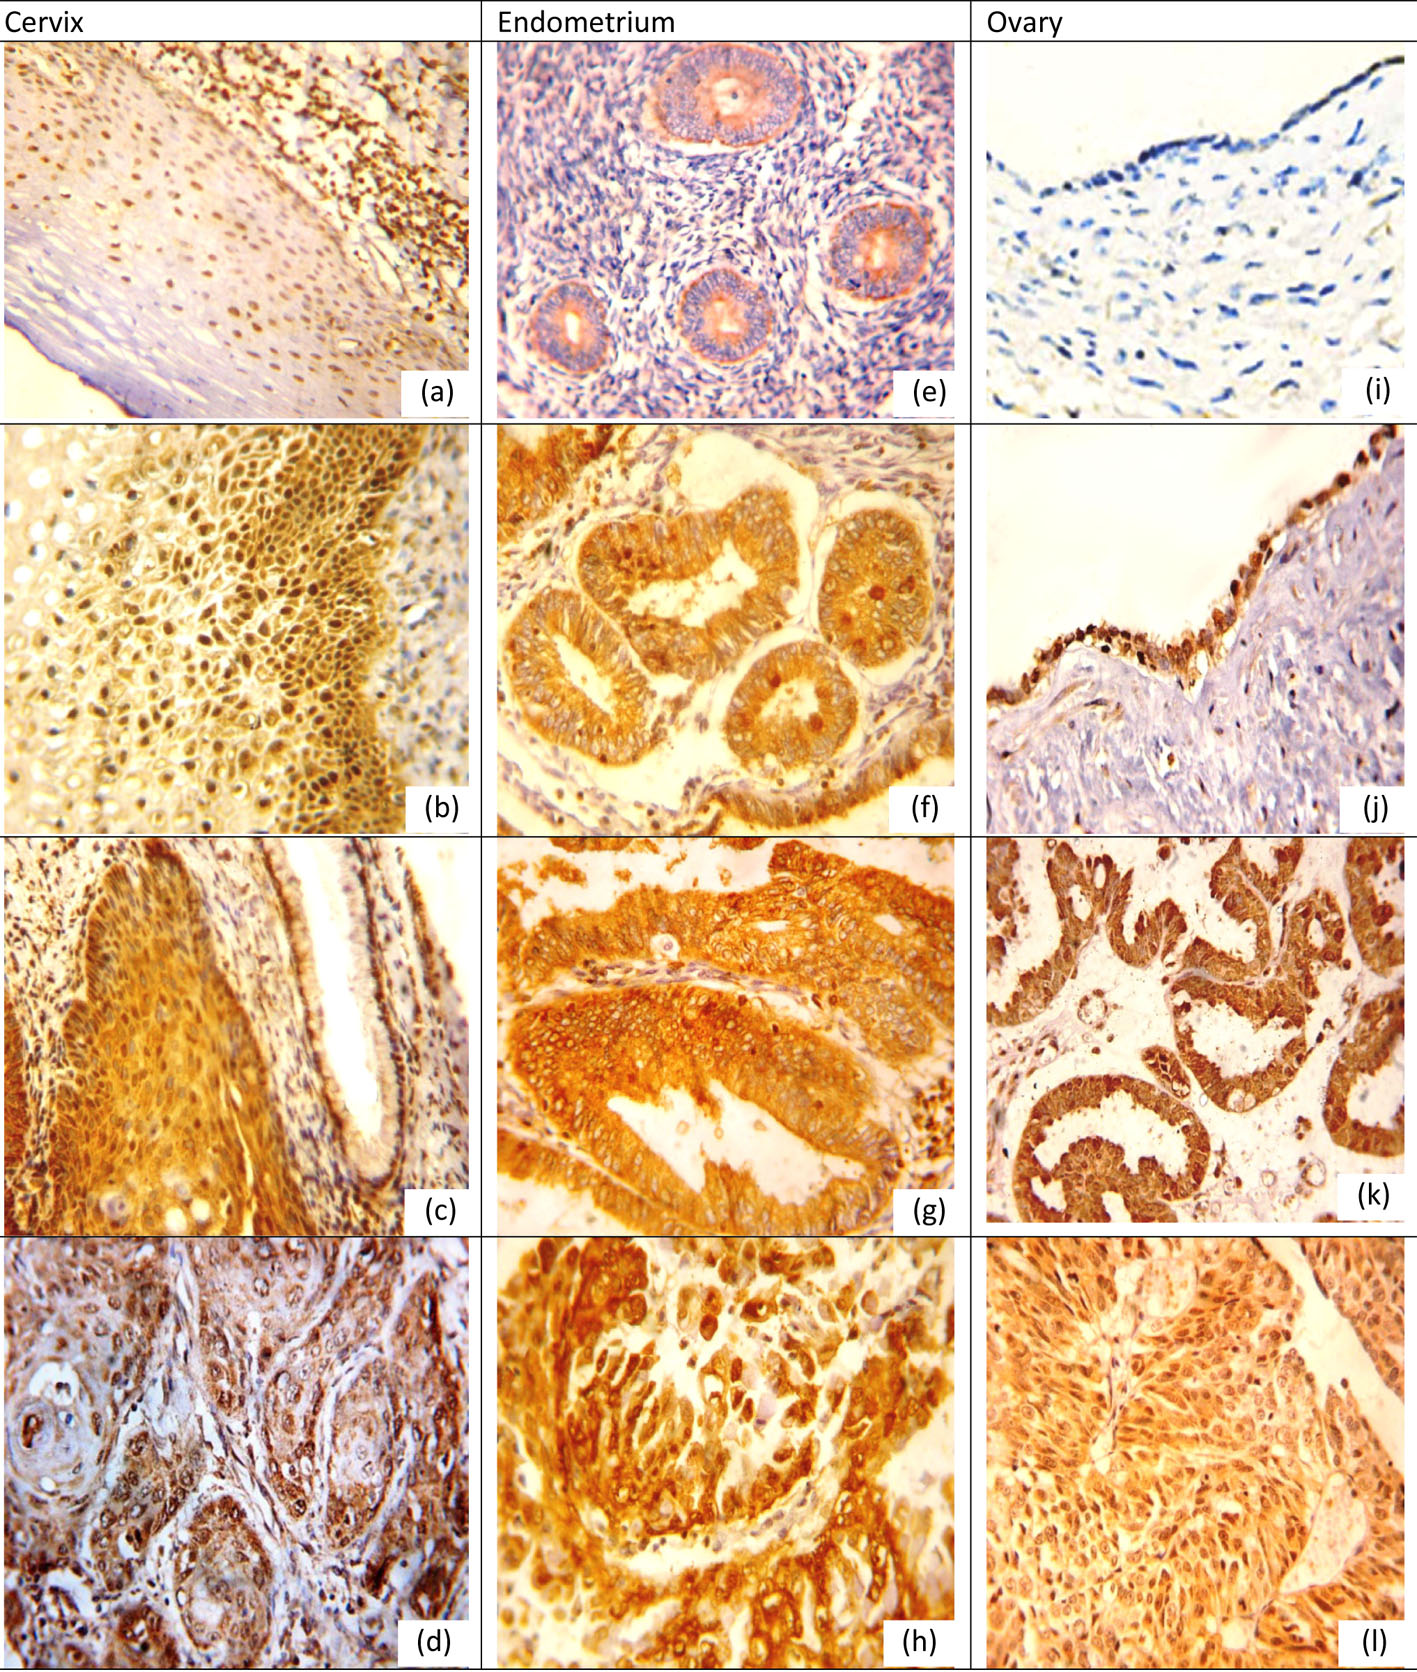
Figure 1. NQO1 protein expression in different lesions using IHC (× 400, DAB was used as the chromogen and hematoxylin as counterstain). (a) NQO1 protein was weak in normal cervical epithelium. (b) NQO1 protein staining was moderate positive in LSIL. (c) NQO1 protein showed diffuse and strong cytoplasmic-positive staining in HSIL. (d) NQO1 was strong positive in grade I cervical SCC. (e) NQO1 protein was weak in proliferative endometrium. (f) NQO1 was moderate positive in simple EH. (g) NQO1 was strong positive in atypical EH. (h) NQO1 was strong positive in EC. (i) NQO1 was negative in normal ovarian epithelium. (j) NQO1 was positive mucinous cystadenoma. (k) NQO1 was moderate positive in borderline serous tumor. (l) NQO1 was strong positive in ovarian carcinoma.
Figure 2.
Figure 2. Nrf2 protein expression in different lesions using IHC (× 400, DAB was used as the chromogen and hematoxylin as counterstain). (a) Nrf2 protein was weak in normal cervical epithelium. (b) Nrf2 protein staining was moderate positive in LSIL. (c) Nrf2 protein showed moderate nuclear-positive staining in HSIL, but weak positive in adjacent normal cervical glands. (d) Nrf2 was strong positive in grade II cervical SCC. (e) Nrf2 protein was positive in proliferative endometrium. (f) Nrf2 was moderate positive in simple EH. (g) Nrf2 was moderate positive in atypical EH. (h) Nrf2 was strong positive in EC. (i) Nrf2 was negative in normal ovarian epithelium. (j) Nrf2 was positive serous cystadenoma. (k) Nrf2 was moderate positive in borderline serous tumor. (l) Nrf2 was strong positive in ovarian carcinoma.
Figure 3.
Figure 3. NQO1 expression box plots (a) in different cervical lesions; (b) in different endometrial lesions; (c) in different ovarian lesions. Horizontal lines in the boxes represent the median value of each group. The top and bottom edges of the boxes indicate the score values from 75th percentile and the 25th percentile respectively. Whiskers represent the highest and lowest values. The range is shown as a vertical line.
Figure 4.
Figure 4. NrF2 expression box plots (a) in different cervical lesions; (b) in different endometrial lesions; (c) in different ovarian lesions. Horizontal lines in the boxes represent the median value of each group. The top and bottom edges of the boxes indicate the score values from 75th percentile and the 25th percentile respectively. Whiskers represent the highest and lowest values. The range is shown as a vertical line.

Tables

Table 1. Positive Expression Rates, Mean Values and SDs for NQO1 in Different Lesions With Examined Sites
 
SiteLesionNo.% +veMean ± SDMinMaxP-value among groups
Test of significance: Kruskal-Wallis, Mann-Whitney test. *Normal vs. SIL, P = 0.091; normal vs. carcinoma, P < 0.001; SIL vs. carcinoma, P = 0.004. **Cyclic endometrium vs. hyperplasia, P = 0.402; cyclic endometrium vs. carcinoma, P = 0.007; hyperplasia vs. carcinoma, P = 0.003. ***Normal vs. benign, P = 0.005; normal vs. borderline, P = 0.003; normal vs. carcinoma, P < 0.001; benign vs. borderline, P = 0.554; benign vs. carcinoma, P = 0.006; borderline vs. carcinoma, P = 0.076.
Cervix*Normal10203.70 ± 5.01015< 0.001
SIL204518.35 ± 24.94080
Carcinoma507644.34 ± 29.52090
Endometrium**Cyclic endometrium10102.40 ± 3.300100.001
Hyperplasia203010.15 ± 15.61050
Carcinoma506036.92 ± 31.94085
Ovary***Normal100000< 0.001
Benign20206.30 ± 9.88030
Borderline202512.40 ± 21.08060
Carcinoma505628.30 ± 27.29080


Table 2. Positive Expression Rates, Mean Values and SDs for Nrf2 in Different Lesions With Examined Organs
 
OrganLesionNo.% +veMean ± SDMinMaxP-value among groups
Test of significance: Kruskal-Wallis, Mann-Whitney test. *Normal vs. SIL, P = 0.155; normal vs. carcinoma, P = 0.002; SIL vs. carcinoma, P = 0.005. **Cyclic endometrium vs. hyperplasia, P = 0.350; cyclic endometrium vs. carcinoma, P = 0.009; hyperplasia vs. carcinoma, P < 0.005. ***Normal vs. benign, P = 0.015; normal vs. borderline, P = 0.003; normal vs. carcinoma, P < 0.001; benign vs. borderline, P = 0.529; benign vs. carcinoma, P = 0.005; borderline vs. carcinoma, P = 0.029.
Cervix*Normal10104.60 ± 5.420150.001
SIL203014.50 ± 18.20060
Carcinoma506239.24 ± 29.25085
Endometrium**Cyclic endometrium10104.30 ± 6.010200.001
Hyperplasia203512.20 ± 16.91060
Carcinoma506439.82 ± 32.65085
Ovary***Normal100000< 0.001
Benign202510.30 ± 14.50050
Borderline202014.60 ± 19.33060
Carcinoma507232.70 ± 29.44085


Table 3. Associations Between NQO1 and Nrf2 Expression Scores and Clinicopathological Data in Carcinoma Cases
 
OrganClinicopathological parameterNo. of casesNQO1Nrf2
Mean ± SDP-valueMean ± SDP-value
Test of significance: Kruskal-Wallis, ANOVA tests. P-value < 0.05 is considered significant.
CervixAge
 Mean55.20 ± 6.5444.34 ± 29.520.44539.24 ± 29.250.526
Grade
 I1425.14 ± 33.260.04525.14 ± 33.030.016
 II2026.80 ± 29.6528.00 ± 29.11
 III1633.50 ± 32.6123.00 ± 23.59
Stage
 I840.62 ± 37.740.46136.88 ± 32.280.594
 II2848.32 ± 29.8035.11 ± 29.01
 III1042.40 ± 25.5748.50 ± 28.67
 IV428.75 ± 20.1549.75 ± 29.89
EndometriumAge
 Mean51.90 ± 5.7736.92 ± 31.940.80239.82 ± 55.000.923
Grade
 I1617.25 ± 27.140.01118.44 ± 28.610.002
 II2145.38 ± 31.3948.48 ± 31.35
 III2347.46 ± 28.9952.15 ± 28.06
Stage
 I1012.60 ± 23.980.08213.40 ± 24.730.025
 II1340.69 ± 32.6141.54 ± 31.31
 III1942.00 ± 31.2849.11 ± 33.18
 IV849.13 ± 30.8248.00 ± 29.21
OvaryAge
 Mean55.74 ± 9.9228.30 ± 27.290.73432.70 ± 29.440.395
Grade
 I1022.70 ± 30.310.71230.80 ± 37.000.576
 II2326.87 ± 26.7229.26 ± 30.14
 III1733.53 ± 27.0218.47 ± 24.10
Stage
 I812.50 ± 21.660.16716.88 ± 28.770.020
 II1522.53 ± 30.0719.80 ± 31.06
 III1533.47 ± 25.1445.27 ± 25.06
 IV1239.58 ± 25.7143.67 ± 23.50