World Journal of Oncology, ISSN 1920-4531 print, 1920-454X online, Open Access
Article copyright, the authors; Journal compilation copyright, World J Oncol and Elmer Press Inc
Journal website http://www.wjon.org

Original Article

Volume 6, Number 4, August 2015, pages 398-409


The Effect of p53 Status of Tumor Cells on Radiosensitivity of Irradiated Tumors With Carbon-Ion Beams Compared With γ-Rays or Reactor Neutron Beams

Figures

Figure 1.
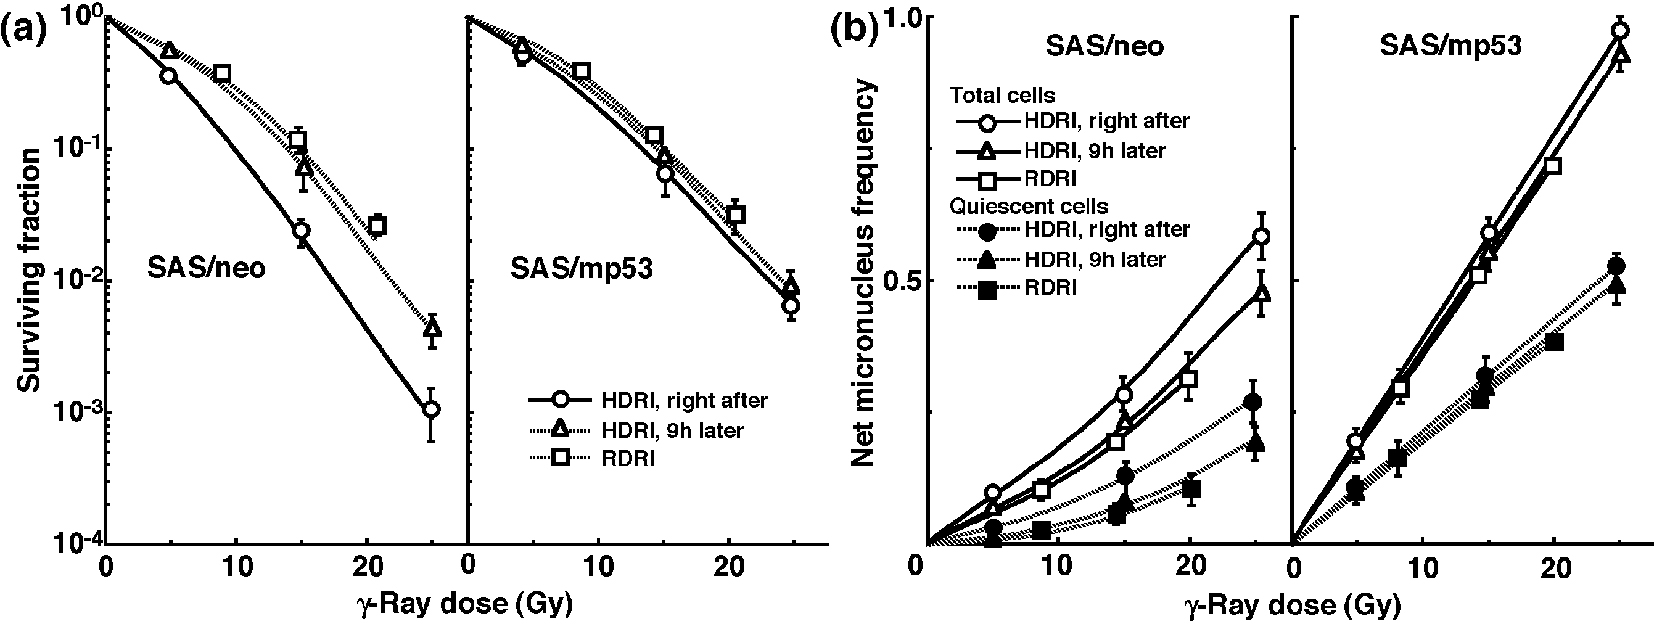
Figure 1. Surviving fractions and net micronucleus frequencies following γ-ray irradiation. The clonogenic cell survival curves for total tumor cell populations and the net micronucleus frequencies for total and quiescent cell populations immediately and 9 h after γ-ray irradiation with high dose-rate irradiation (HDRI) and immediately after γ-ray irradiation with reduced dose-rate irradiation (RDRI) are shown in (a) and (b), respectively. The left and right panels show SAS/neo and SAS/mp53 tumor cells, respectively. Bars represent standard errors (n = 6).
Figure 2.
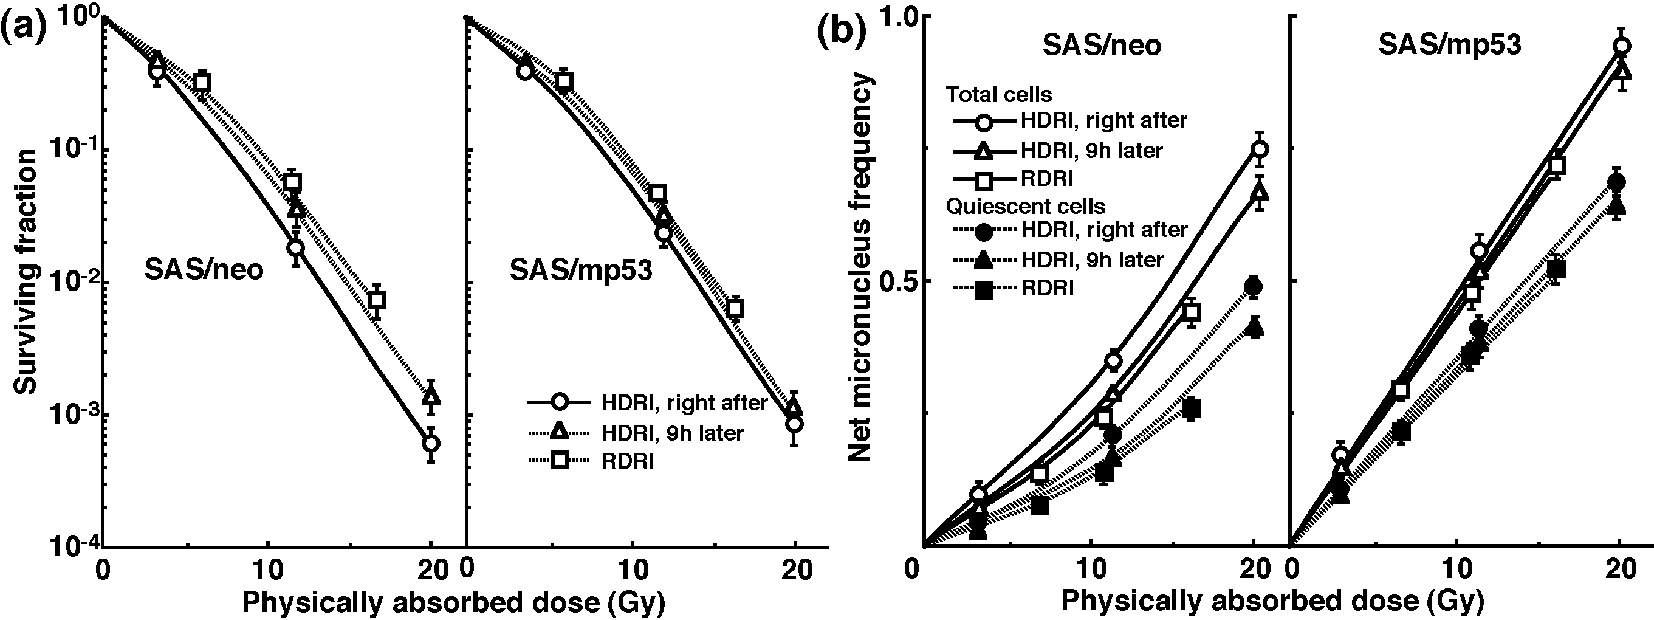
Figure 2. Surviving fractions and net micronucleus frequencies following accelerated carbon-ion beam (18 MeV/μm) irradiation. The clonogenic cell survival curves for total tumor cell populations and the net micronucleus frequencies for total and quiescent cell populations immediately and 9 h after irradiation using accelerated carbon-ion beams with a linear energy transfer of 18 MeV/μm with high dose-rate irradiation (HDRI) and immediately after irradiation with reduced dose-rate irradiation (RDRI) are shown in (a) and (b), respectively. The left and right panels show SAS/neo and SAS/mp53 tumor cells, respectively. Bars represent standard errors (n = 6).
Figure 3.
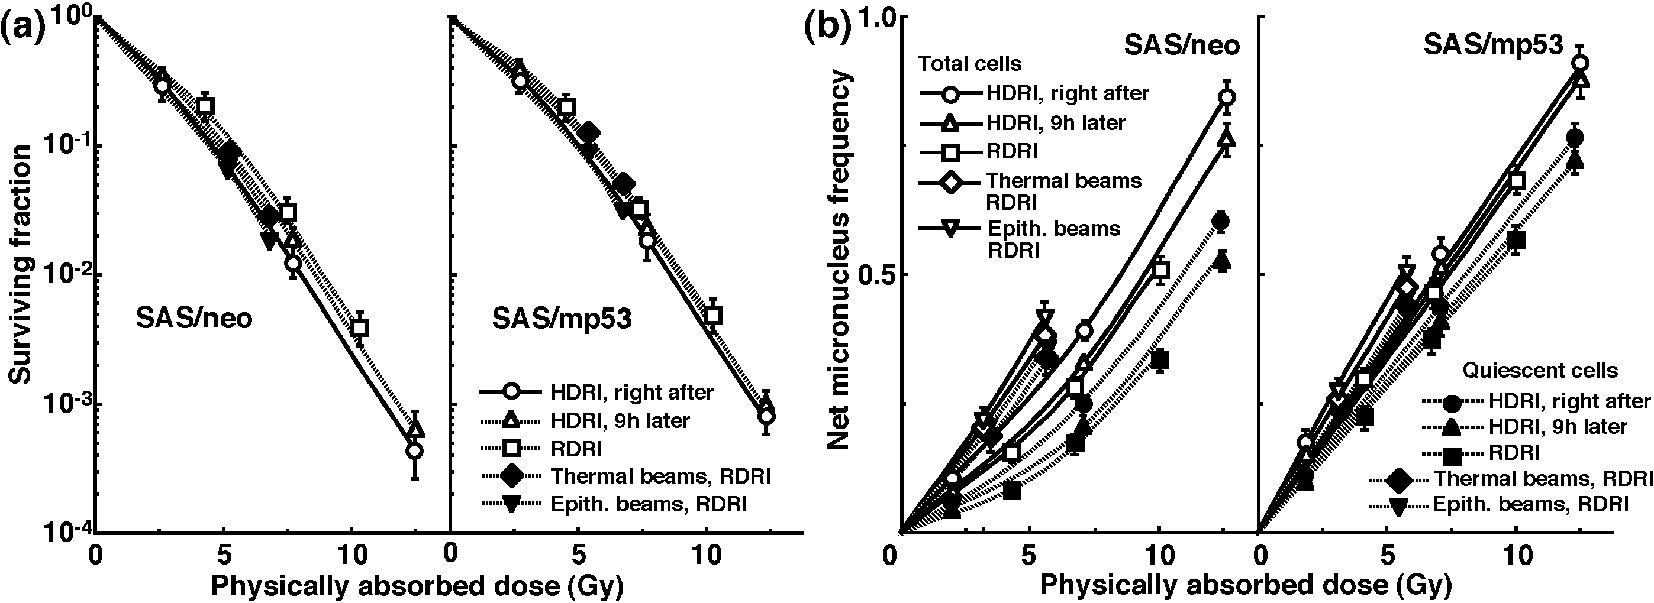
Figure 3. Surviving fractions and net micronucleus frequencies following accelerated carbon-ion beam (50 MeV/μm) irradiation. The clonogenic cell survival curves for total tumor cell populations and the net micronucleus frequencies for total and quiescent cell populations immediately and 9 h after irradiation using accelerated carbon-ion beams with a linear energy transfer of 50 MeV/μm with high dose-rate irradiation (HDRI) and immediately after irradiation with reduced dose-rate irradiation (RDRI) are shown in (a) and (b), respectively. In addition, the cell survival curves for total cells and the net micronucleus frequencies for total and quiescent cells immediately after irradiation using reactor thermal and epithermal neutron beams are also shown in (a) and (b), respectively. The left and right panels show SAS/neo and SAS/mp53 tumor cells, respectively. Bars represent standard errors (n = 6).

Tables

Table 1. Plating Efficiency and Micronucleus Frequency at 0 Gy
 
Total tumor cellsQuiescent cells
aMean ± standard error (n = 6).
SAS/neo
  Plating efficiency (%)45.5 ± 8.9a
  Micronucleus frequency0.038 ± 0.0060.056 ± 0.007
SAS/mp53
  Plating efficiency (%)23.5 ± 4.1
  Micronucleus frequency0.072 ± 0.0080.111 ± 0.010


Table 2. Dose-Modifying Factors Due to a Delayed Assay or Reduced Irradiation Dose-Ratea
 
Employed Radiation beamsHigh dose-rate 9 h afterReduced dose-rate
aThe ratio of the dose of radiation necessary to obtain each endpoint with a delayed assay or reduced dose-rate irradiation to that needed to obtain each endpoint with an assay immediately after high dose-rate irradiation. bMean ± standard error (n = 6).
SAS/neo
  Surviving fraction = 0.03
    Total cells
      γ-rays1.3 ± 0.1b1.4 ± 0.1
      Carbon beams (18 keV/μm)1.2 ± 0.11.15 ± 0.1
      Carbon beams (50 keV/μm)1.15 ± 0.11.1 ± 0.1
  Net micronucleus frequency = 0.1
    Total cells
      γ-rays1.35 ± 0.11.45 ± 0.1
      Carbon beams (18 keV/μm)1.15 ± 0.11.2 ± 0.1
      Carbon beams (50 keV/μm)1.15 ± 0.11.15 ± 0.1
    Quiescent cells
      γ-rays1.45 ± 0.151.55 ± 0.15
      Carbon beams (18 keV/μm)1.3 ± 0.11.35 ± 0.1
      Carbon beams (50 keV/μm)1.25 ± 0.151.3 ± 0.1
SAS/mp53
  Surviving fraction = 0.03
    Total cells
      γ-rays1.05 ± 0.1b1.1 ± 0.1
      Carbon beams (18 keV/μm)1.05 ± 0.11.05 ± 0.1
      Carbon beams (50 keV/μm)1.05 ± 0.11.05 ± 0.1
  Net micronucleus frequency = 0.1
    Total cells
      γ-rays1.05 ± 0.11.1 ± 0.1
      Carbon beams (18 keV/μm)1.05 ± 0.11.1 ± 0.1
      Carbon beams (50 keV/μm)1.05 ± 0.11.05 ± 0.1
    Quiescent cells
      γ-rays1.05 ± 0.11.1 ± 0.1
      Carbon beams (18 keV/μm)1.05 ± 0.11.1 ± 0.1
      Carbon beams (50 keV/μm)1.05 ± 0.11.1 ± 0.1


Table 3. Dose-Modifying Factors for SAS/mp53 Relative to SAS/neo Tumor Cellsa
 
High dose-rate immediately afterHigh dose-rate 9 h afterReduced dose-rate
aThe ratio of the physical radiation dose of external beams necessary to obtain each endpoint in SAS/mp53 tumor cells to that needed to obtain each endpoint in SAS/neo tumor cells. bMean ± standard error (n = 6).
Surviving fraction = 0.03
  Total cells
    γ-rays (1.35 ± 0.1b)1.15± 0.11.1 ± 0.1
    Carbon beams (18 keV/μm) (1.35 ± 0.1b)1.1 ± 0.11.05 ± 0.1
    Carbon beams (50 keV/μm) (1.1 ± 0.1)1.05 ± 0.11.0 ± 0.1
    Thermal beams1.1 ± 0.1
    Epithermal beams1.05 ± 0.1


Table 4. Relative Biological Effectiveness for Carbon Beams Compared With γ-Raysa in Total and Quiescent Tumor Cells
 
LET values of carbon beamsHigh dose-rate immediately afterHigh dose-rate 9 h afterReduced dose-rate
aRatio of radiation dose necessary to obtain each endpoint with γ-rays and radiation dose necessary to obtain each endpoint with carbon-ion beams. bMean ± standard error (n = 6).
SAS/neo
  Surviving fraction = 0.03
    Total cells
      18 keV/μm1.35 ± 0.1b1.5 ± 0.151.5 ± 0.15
      50 keV/μm2.2 ± 0.22.6 ± 0.252.6 ± 0.25
      Thermal3.2 ± 0.3
      Epithermal3.7 ± 0.35
  Net micronucleus frequency = 0.1
    Total cells
      18 keV/μm1.6 ± 0.151.7 ± 0.151.7 ± 0.15
      50 keV/μm1.85 ± 0.22.45 ± 0.252.6 ± 0.25
      Thermal4.2 ± 0.4
      Epithermal4.7 ± 0.45
    Quiescent cells
      18 keV/μm1.9 ± 0.22.4 ± 0.252.4 ± 0.25
      50 keV/μm3.45 ± 0.354.2 ± 0.45.0 ± 0.5
      Thermal6.4 ± 0.65
      Epithermal7.3 ± 0.75
SAS/mp53
  Surviving fraction = 0.03
    Total cells
      18 keV/μm1.6 ± 0.15b1.6 ± 0.151.65 ± 0.15
      50 keV/μm2.65 ± 0.252.65 ± 0.252.7 ± 0.25
      Thermal3.1 ± 0.3
      Epithermal3.3 ± 0.35
  Net micronucleus frequency = 0.1
    Total cells
      18 keV/μm1.25 ± 0.11.2 ± 0.11.2 ± 0.1
      50 keV/μm1.3 ± 0.151.35 ± 0.151.4 ± 0.15
      Thermal2.3 ± 0.25
      Epithermal2.45 ± 0.25
    Quiescent cells
      18 keV/μm2.05 ± 0.22.4 ± 0.252.4 ± 0.25
      50 keV/μm1.6 ± 0.151.75 ± 0.151.85 ± 0.2
      Thermal3.8 ± 0.4
      Epithermal4.2 ± 0.4


Table 5. Dose-Modifying Factors for Quiescent Relative to Total Tumor Cellsa at Net Micronucleus Frequency of 0.1
 
High dose-rate immediately afterHigh dose-rate 9 h afterReduced dose-rate
aThe ratio of the dose of radiation necessary to obtain each endpoint in the quiescent cell population to that needed to obtain each endpoint in the total tumor cell population. bMean ± standard error (n = 6).
SAS/neo
  γ-rays (2.3 ± 0.25b)2.35 ± 0.252.4 ± 0.25
  Carbon beams (18 keV/μm) (2.0 ± 0.2)1.7 ± 0.151.65 ± 0.15
  Carbon beams (50 keV/μm) (1.9 ± 0.1)1.75 ± 0.151.9 ± 0.2
  Thermal beams1.2 ± 0.1
  Epithermal beams1.1 ± 0.1
SAS/mp53
  γ-rays (2.0 ± 0.2b)2.0 ± 0.22.0 ± 0.2
  Carbon beams (18 keV/μm) (1.25 ± 0.15)1.3 ± 0.11.3 ± 0.15
  Carbon beams (50 keV/μm) (1.0 ± 0.1)1.0 ± 0.11.0 ± 0.1
  Thermal beams1.2 ± 0.1
  Epithermal beam1.15 ± 0.1