World Journal of Oncology, ISSN 1920-4531 print, 1920-454X online, Open Access
Article copyright, the authors; Journal compilation copyright, World J Oncol and Elmer Press Inc
Journal website http://www.wjon.org

Original Article

Volume 6, Number 5, October 2015, pages 446-455


Utility of SOX2 and Livin Co-Expression in the Prognosis of Bladder Cancer With Bilharzial and Non-Bilharzial Bladder Status

Figures

Figure 1.
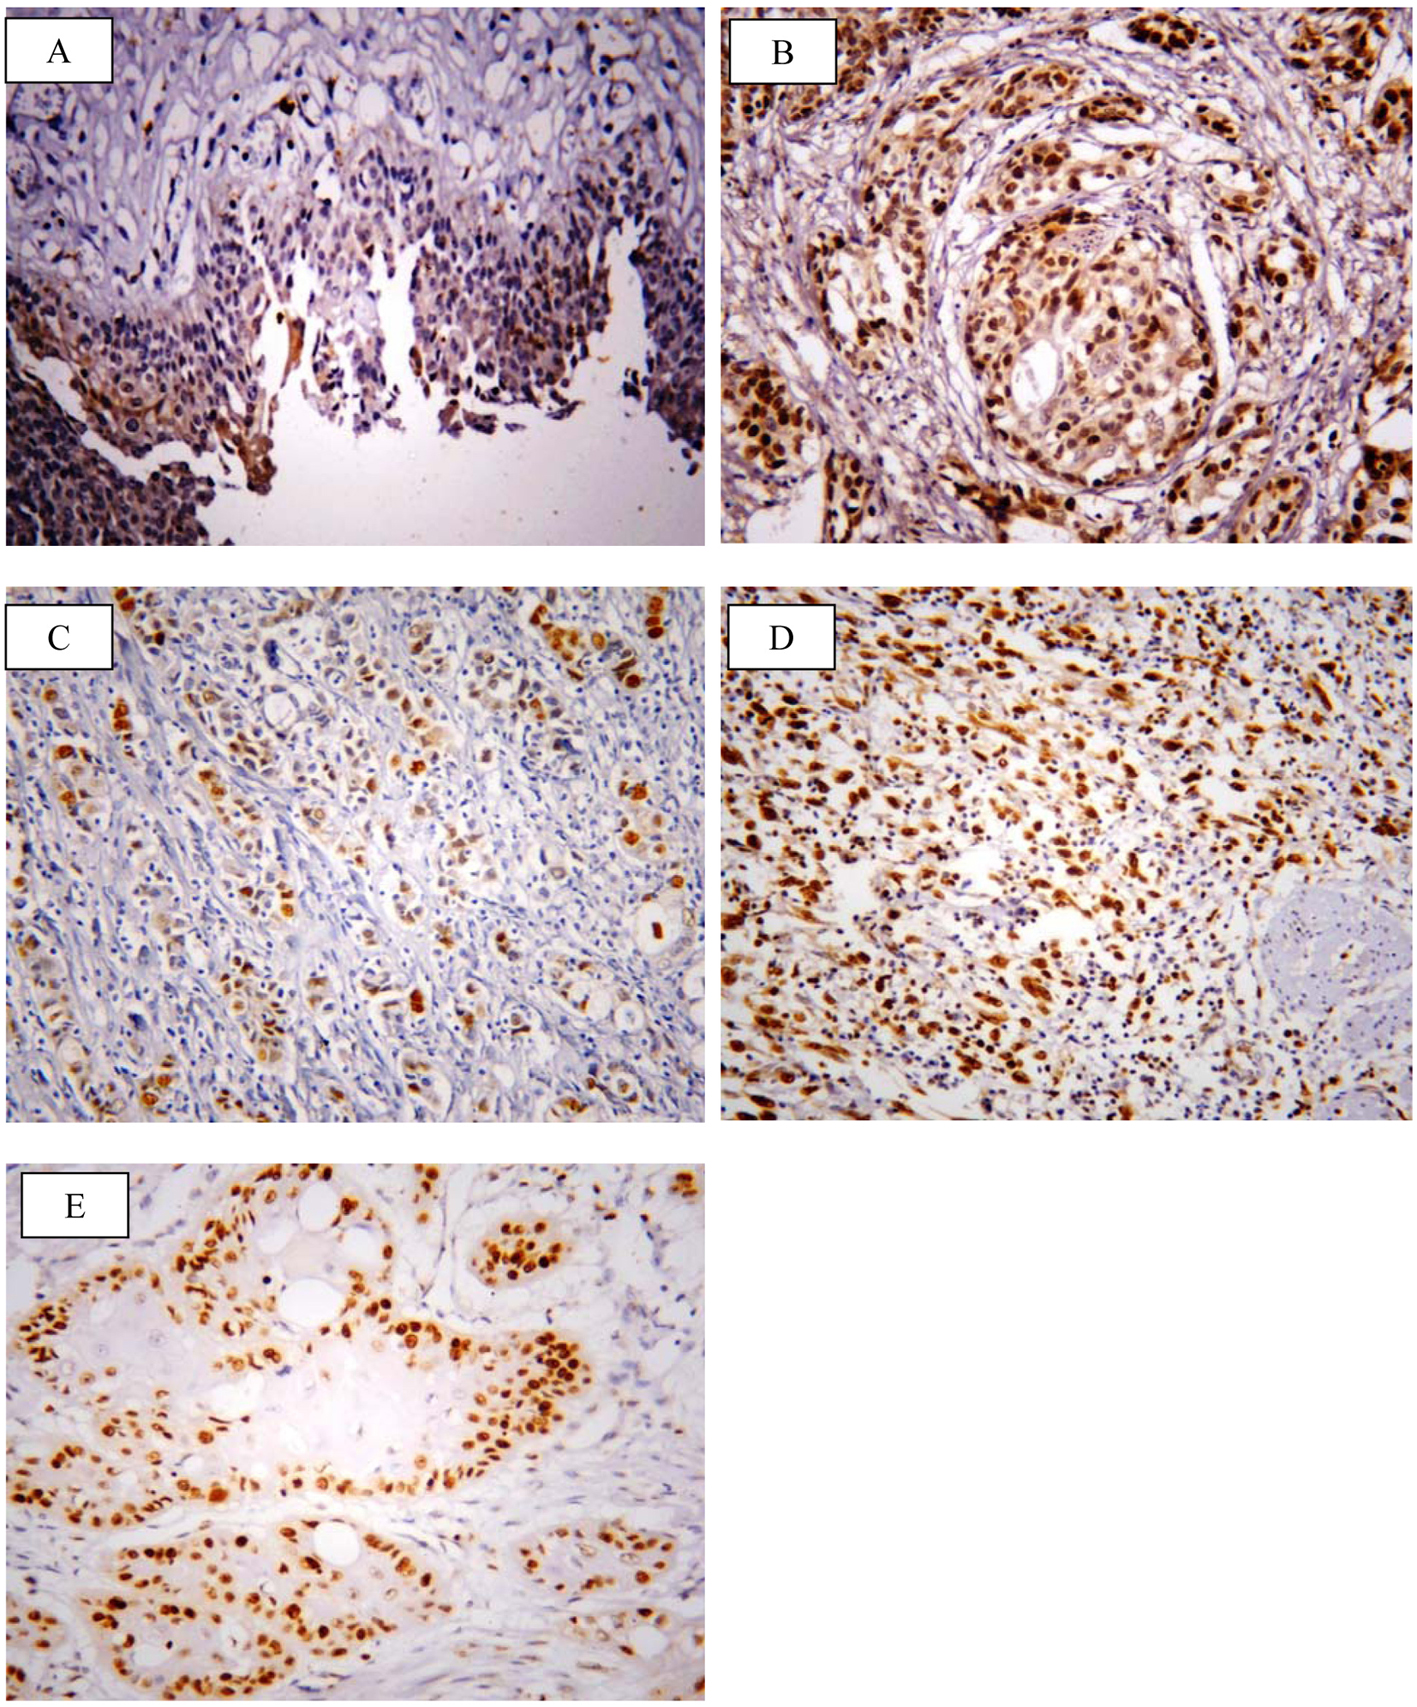
Figure 1. Representative immunohistochemical staining of SOX2 in human bladder cancer. (A) SOX2 showed negative/low expression in non-neoplastic bladder tissue. (B) High expression in high grade TCC. (C) Low expression in non-muscle invasive TCC. (D) High expression in muscle invasive TCC. (E) High expression in SCC (× 400; counterstained with hematoxylin).
Figure 2.
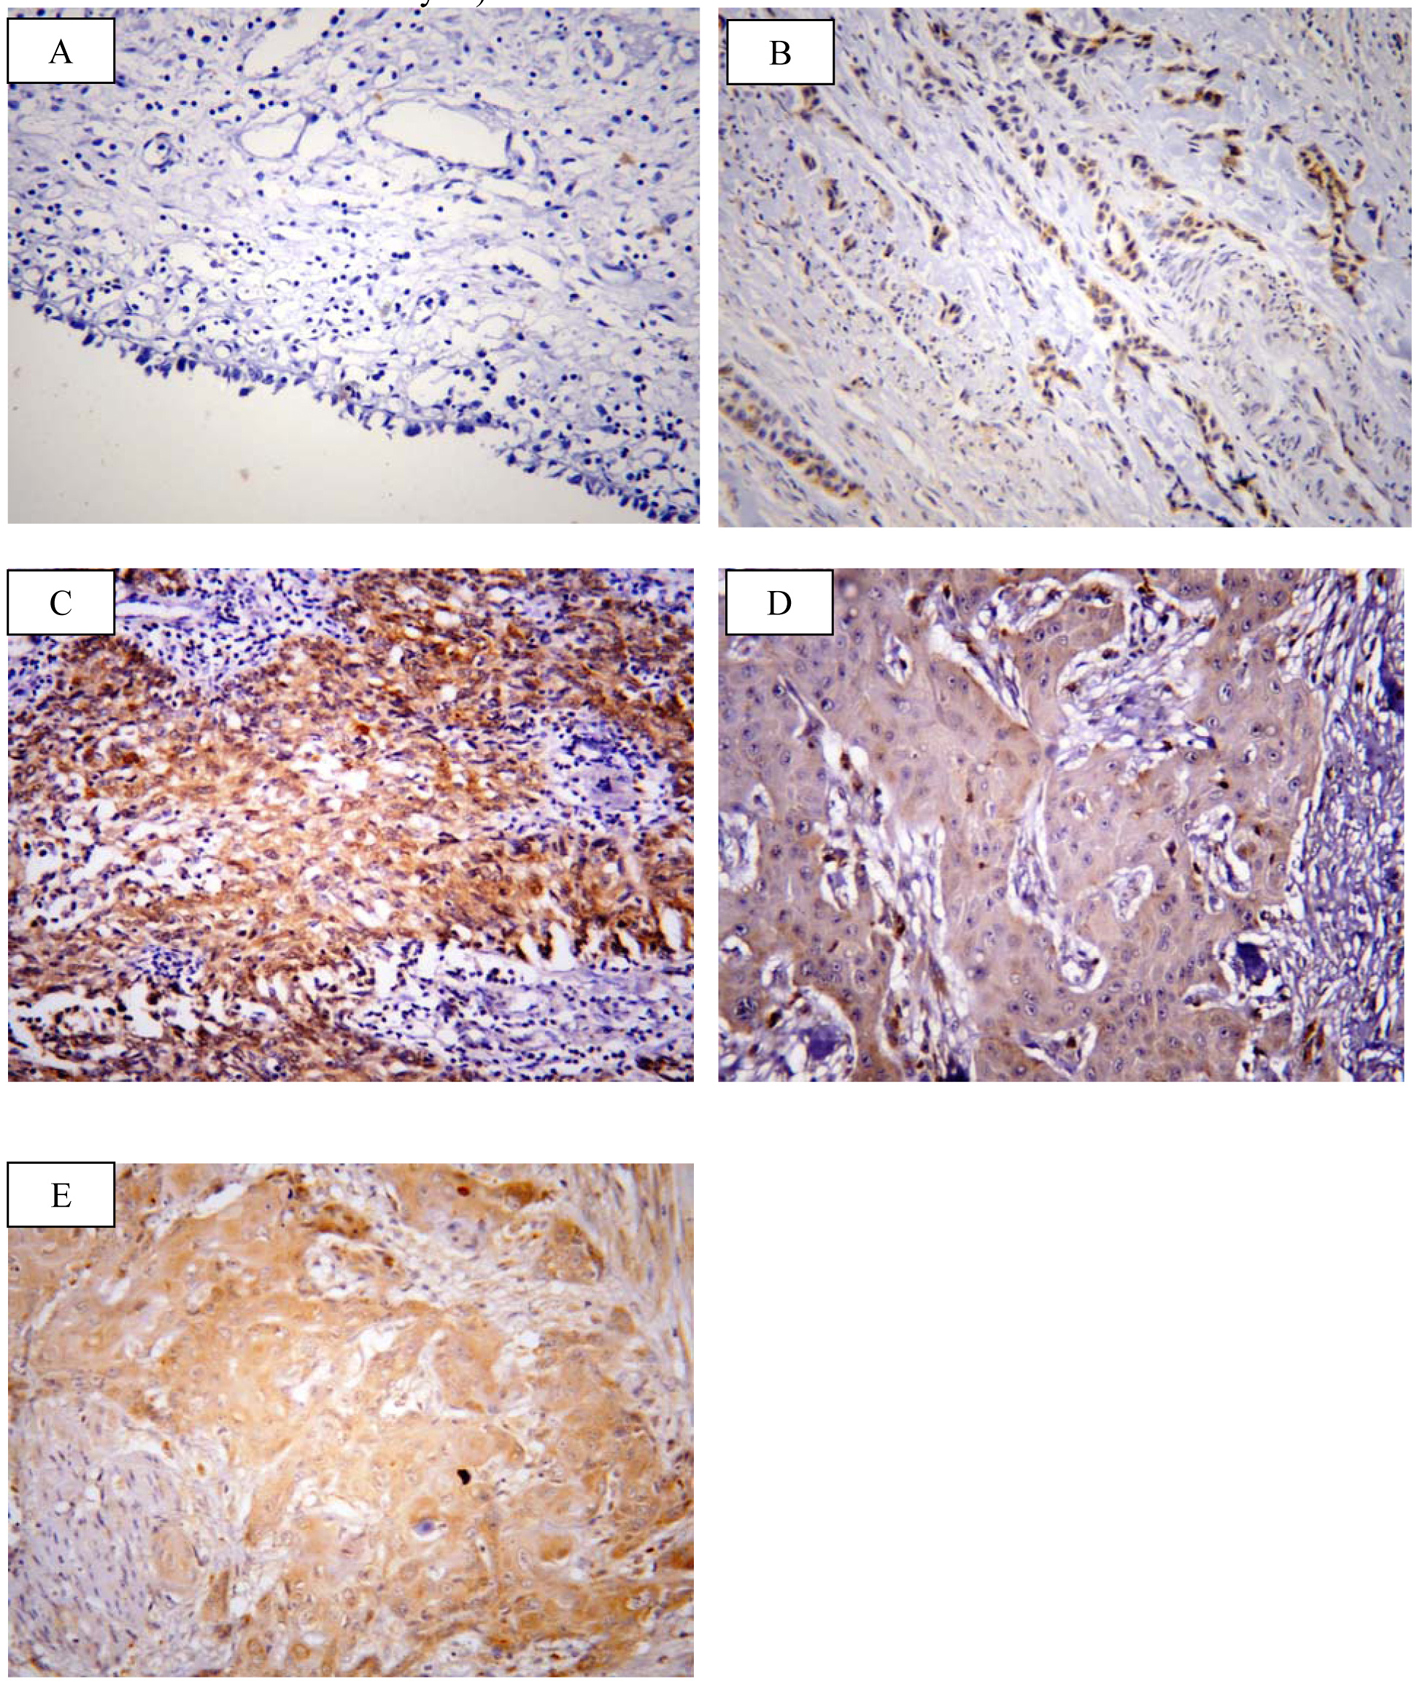
Figure 2. Representative immunohistochemical staining of livin in human bladder cancer. (A) Livin showed negative expression in non neoplastic bladder tissue. (B) Low expression in low grade TCC. (C) High expression in high grade TCC. (D) Low expression in SCC grade I. (E) High expression in SCC grade II (× 400; counterstained with hematoxylin).
Figure 3.
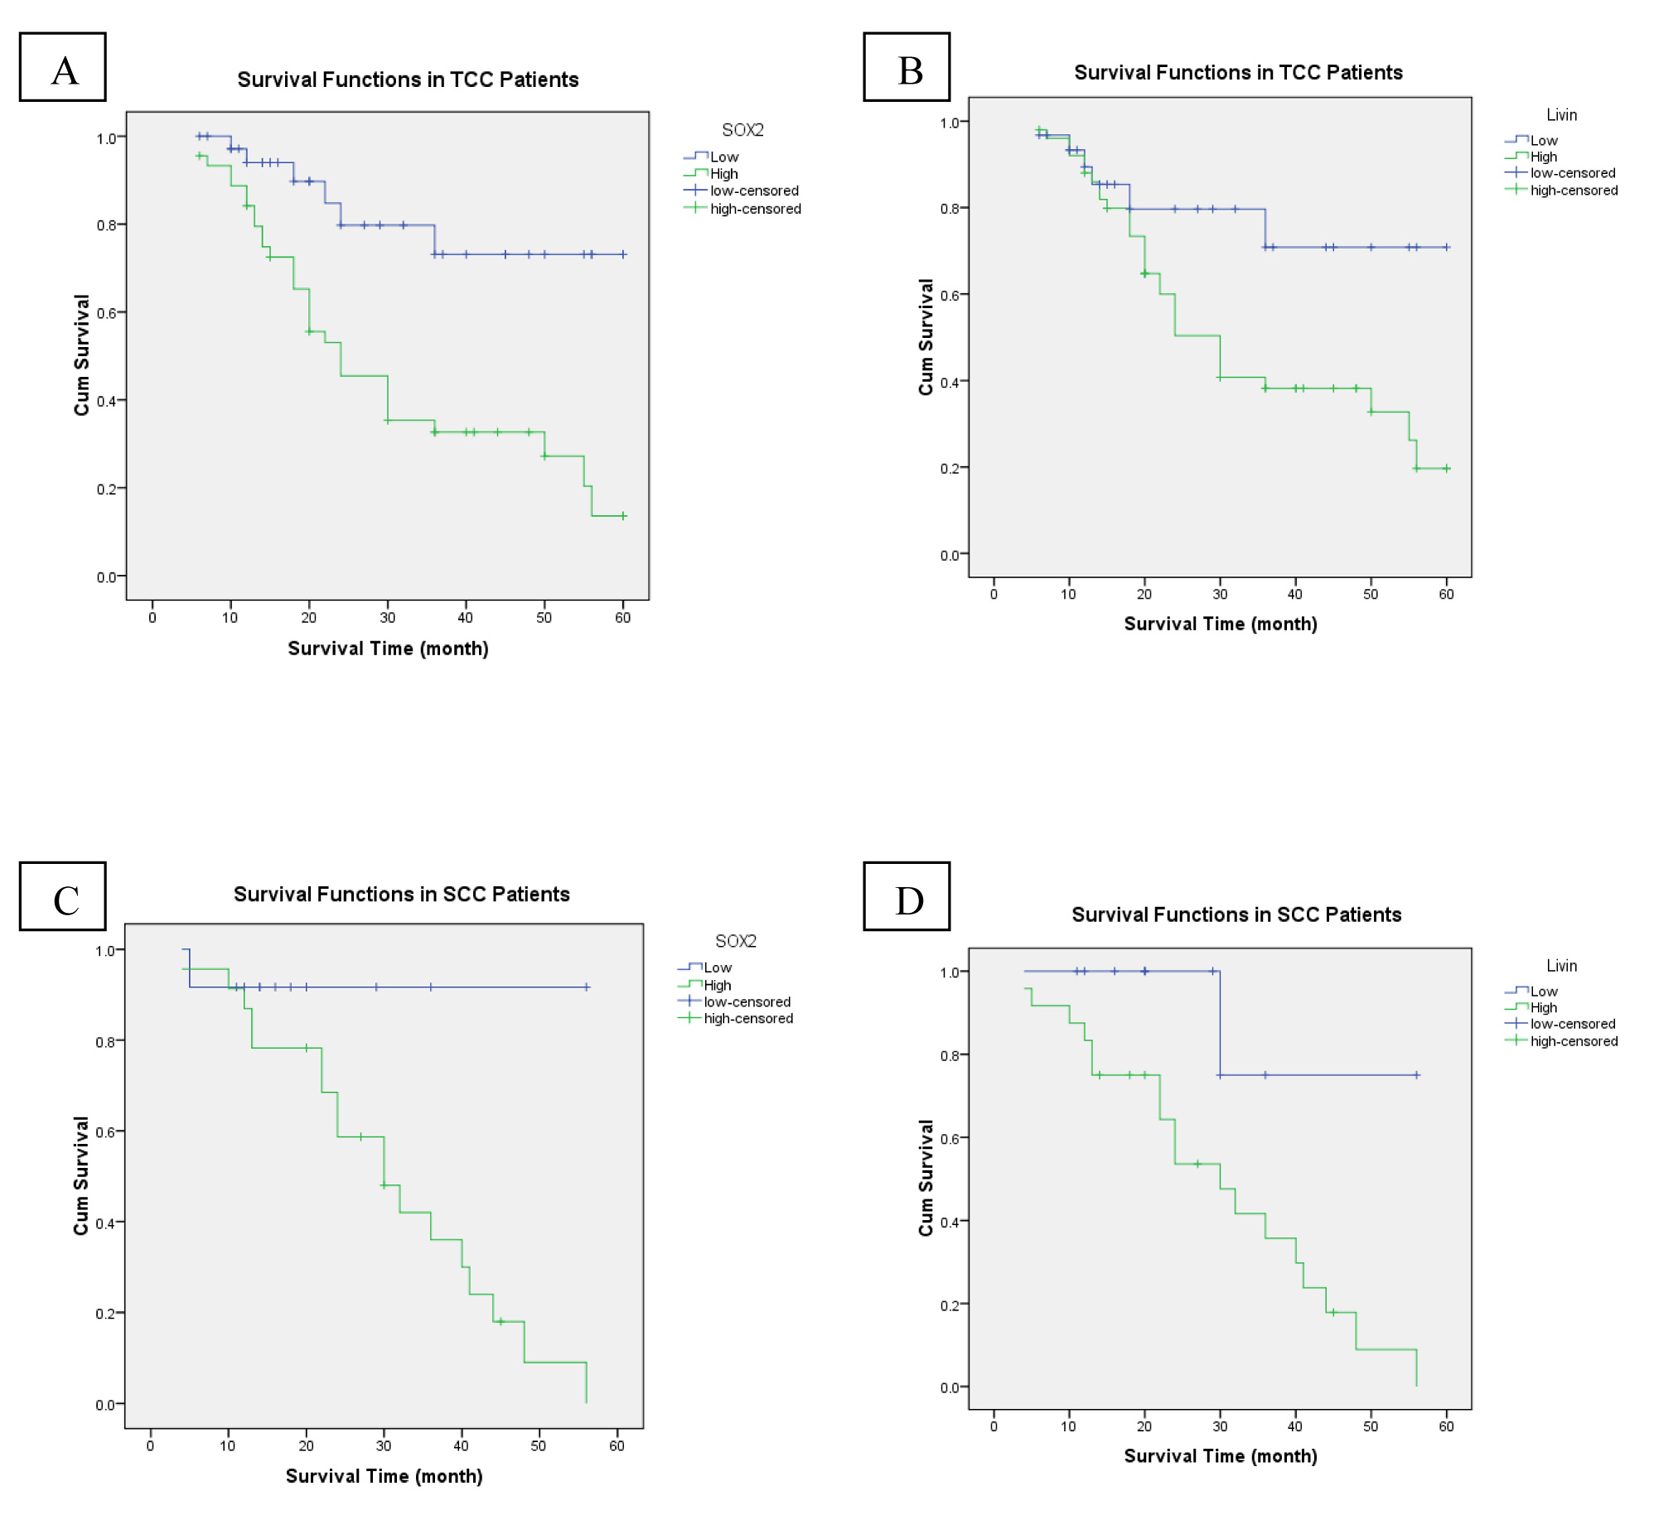
Figure 3. An analysis of overall-free survival in patients with bladder cancer by the Kaplan-Meier method. (A) According to SOX2 low/high expression in TCC patients (P < 0.001). (B) Low/high livin expression in TCC patients (P = 0.025). (C) SOX2 low/high expression in SCC patients (P = 0.041). (D) Low/high livin expression in SCC patients (P = 0.021).

Tables

Table 1. Patients’ Clinicopathological Features
 
Clinicopathological featuresTCC (n = 82/117) (70.1%)SCC (n = 35/117) (29.9%)P-value
P-value < 0.05 is considered significant. TCC: transitional cell carcinoma; SCC: squamous cell carcinoma.
Age
  ≤ 50 years12 (14.6)14 (40)0.003
  > 50 years70 (85.4)21 (60)
Gender
  Male71 (86.6)30 (85.7)0.604
  Female11(13.4)5 (14.3)
Schistosomal status
  Negative43 (52.4)11 (31.4)0.029
  Positive39 (47.6)24 (68.6)
Grade
Low49 (59.8)GI12 (34.3)< 0.001
High33 (40.2)GII16 (25.7)
GIII7 (20)
T stage
  Ta11 (13.4)0 (0)0.001
  T119 (23.2)7 (20)
  T229 (35.4)19 (54.7)
  T323 (28)9 (25.7)


Table 2. Relation of SOX2 and Livin Expressions With Clinicopathological Features of Bladder TCC (82 Cases)
 
Clinicopathological featuresSOX2Livin
Low (%)High (%)P-valueLow (%)High (%)P-value
Test of significance: Chi-square test. P-value < 0.05 is considered significant. TCC: transitional cell carcinoma.
Age
  ≤ 50 years6 (50)6 (50)0.4767 (58.3)5 (41.7)0.104
  > 50 years31 (44.3)39 (55.7)14 (34.3)46 (65.7)
Gender
  Male34 (47.9)37 (52.1)0.17126 (37.1)44 (62.9)0.502
  Female3 (27.3)8 (72.7)5 (41.7)7 (58.3)
Bilharzial status
  Negative18 (41.9)25 (58.1)0.34415 (34.9)28 (65.1)0.365
  Positive19 (48.7)20 (51.3)16 (41)23 (59)
Grade
  Low28 (57.1)21 (42.9)0.00723 (46.9)26 (53.1)0.031
  High9 (27.3)24 (72.7)8 (24.2)25 (75.8)
Pathological stage
  Ta9 (81.8)2 (18.2)0.0379 (81.8)2 (18.2)0.133
  T113 (68.4)6 (31.6)11 (57.9)8 (42.1)
  T214 (48.3)15 (51.7)11 (37.9)18 (62.1)
  T38 (34.8)15 (65.2)7 (30.4)16 (69.6)


Table 3. Relation of SOX2 and Livin Expressions With Clinicopathological Features of Bladder SCC (35 Cases)
 
Clinicopathological featuresSOX2Livin
Low (%)High (%)P-valueLow (%)High (%)P-value
Test of significance: Chi-square test. P-value < 0.05 is considered significant. SCC: squamous cell carcinoma.
Age
  ≤ 50 years5 (35.7)9 (64.3)0.5836 (42.9)8 (57.1)0.206
  > 50 years7 (33.3)14 (66.7)5 (23.8)16 (76.2)
Gender
  Male11 (36.7)19 (63.7)0.4318 (26.7)22 (73.3)0.166
  Female1 (20)4 (80)3 (60)2 (20)
Bilharzial status
  Negative3 (27.3)8 (72.7)0.4241 (9.1)10 (90.9)0.058
  Positive9 (37.5)15 (62.5)10 (41.7)14 (58.3)
Grade
  GI8 (66.7)4 (33.3)0.0148 (66.7)4 (33.3)0.005
  GII3 (18.8)13 (81.2)2 (12.5)14 (87.5)
  GIII1 (14.3)6 (85.7)1 (14.3)6 (85.7)
Pathological stage
  Ta0 (0)0 (0)0.5550 (0)0 (0)0.144
  T13 (42.9)4 (57.1)4 (47.1)3 (42.9)
  T25 (26.3)14 (73.7)6 (31.6)13 (68.4)
  T34 (44.4)5 (55.6)1 (11.1)8 (88.9)