World Journal of Oncology, ISSN 1920-4531 print, 1920-454X online, Open Access
Article copyright, the authors; Journal compilation copyright, World J Oncol and Elmer Press Inc
Journal website http://www.wjon.org

Original Article

Volume 6, Number 6, December 2015, pages 473-484


GOLPH3 and YB-1 Are Novel Markers Correlating With Poor Prognosis in Prostate Cancer

Figures

Figure 1.
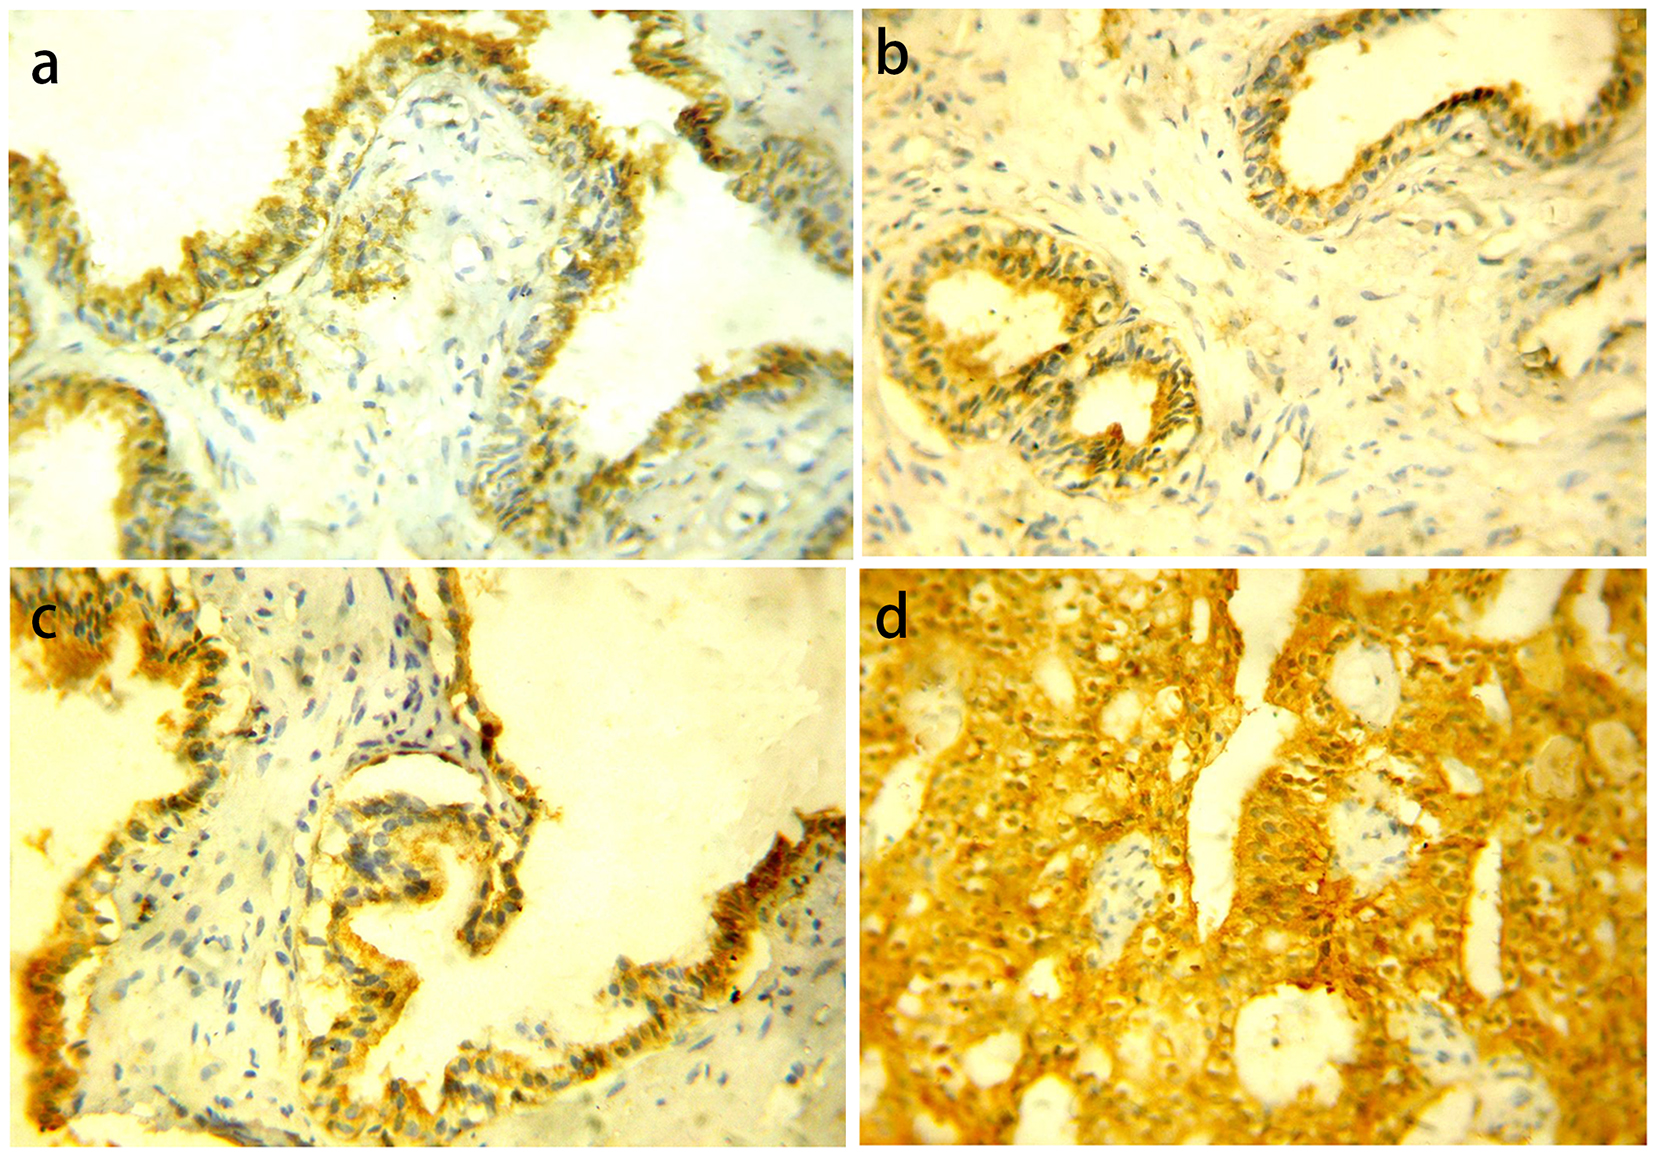
Figure 1. GOLPH3 protein cytoplasmic expression in different prostatic lesions using IHC. (a) GOLPH3 protein showed positive expression in BPH. (b) Positive GOLPH3 expression in LGPIN. (c) Positive GOLPH3 expression in HGPIN. (d) Positive GOLPH3 expression in PC. Original magnification, × 400 (DAB was used as the chromogen and hematoxylin as counterstain).
Figure 2.
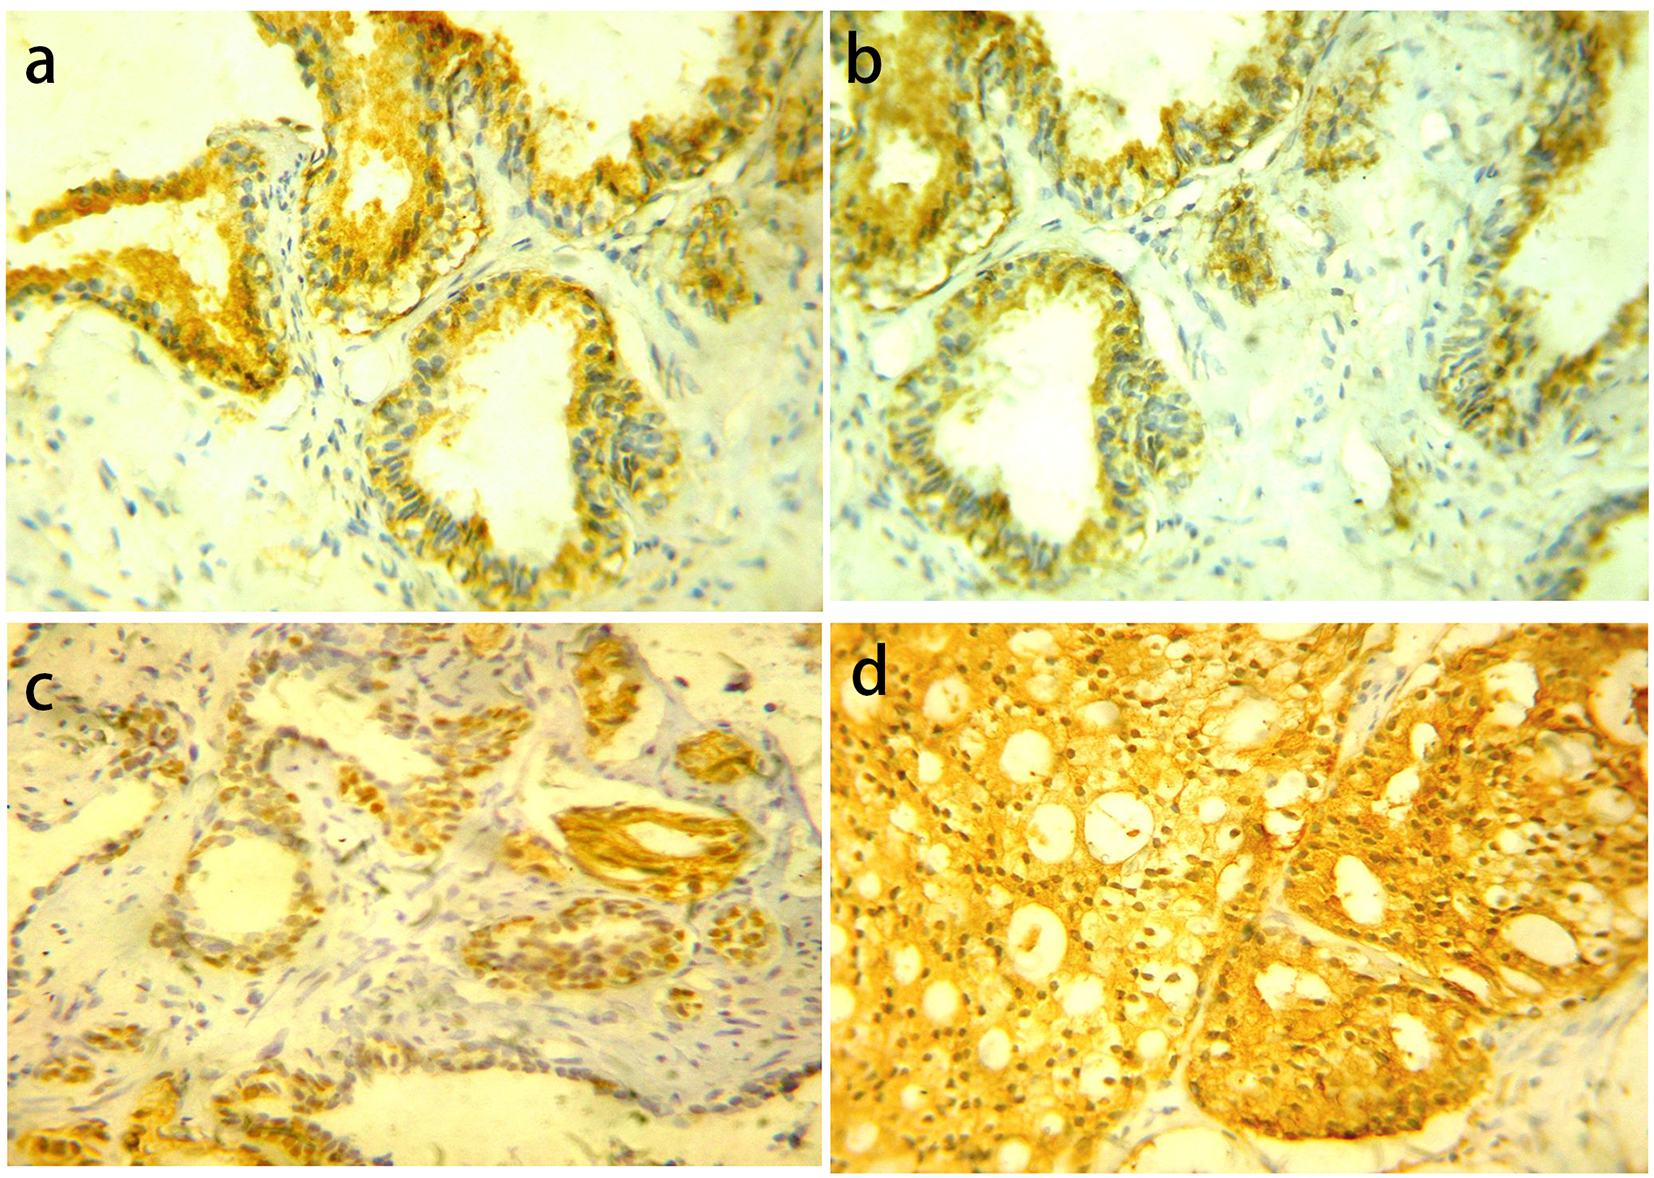
Figure 2. YB-1 protein expression in different prostatic lesions using IHC. (a) YB-1 protein showed cytoplasmic expression in BPH. (b) Positive cytoplasmic YB-1 expression in LGPIN. (c) Positive nuclear and cytoplasmic YB-1 expression in HGPIN. (d) Positive cytoplasmic and nuclear YB-1 expression in PC. Original magnification, × 400 (DAB was used as the chromogen and hematoxylin as counterstain).
Figure 3.
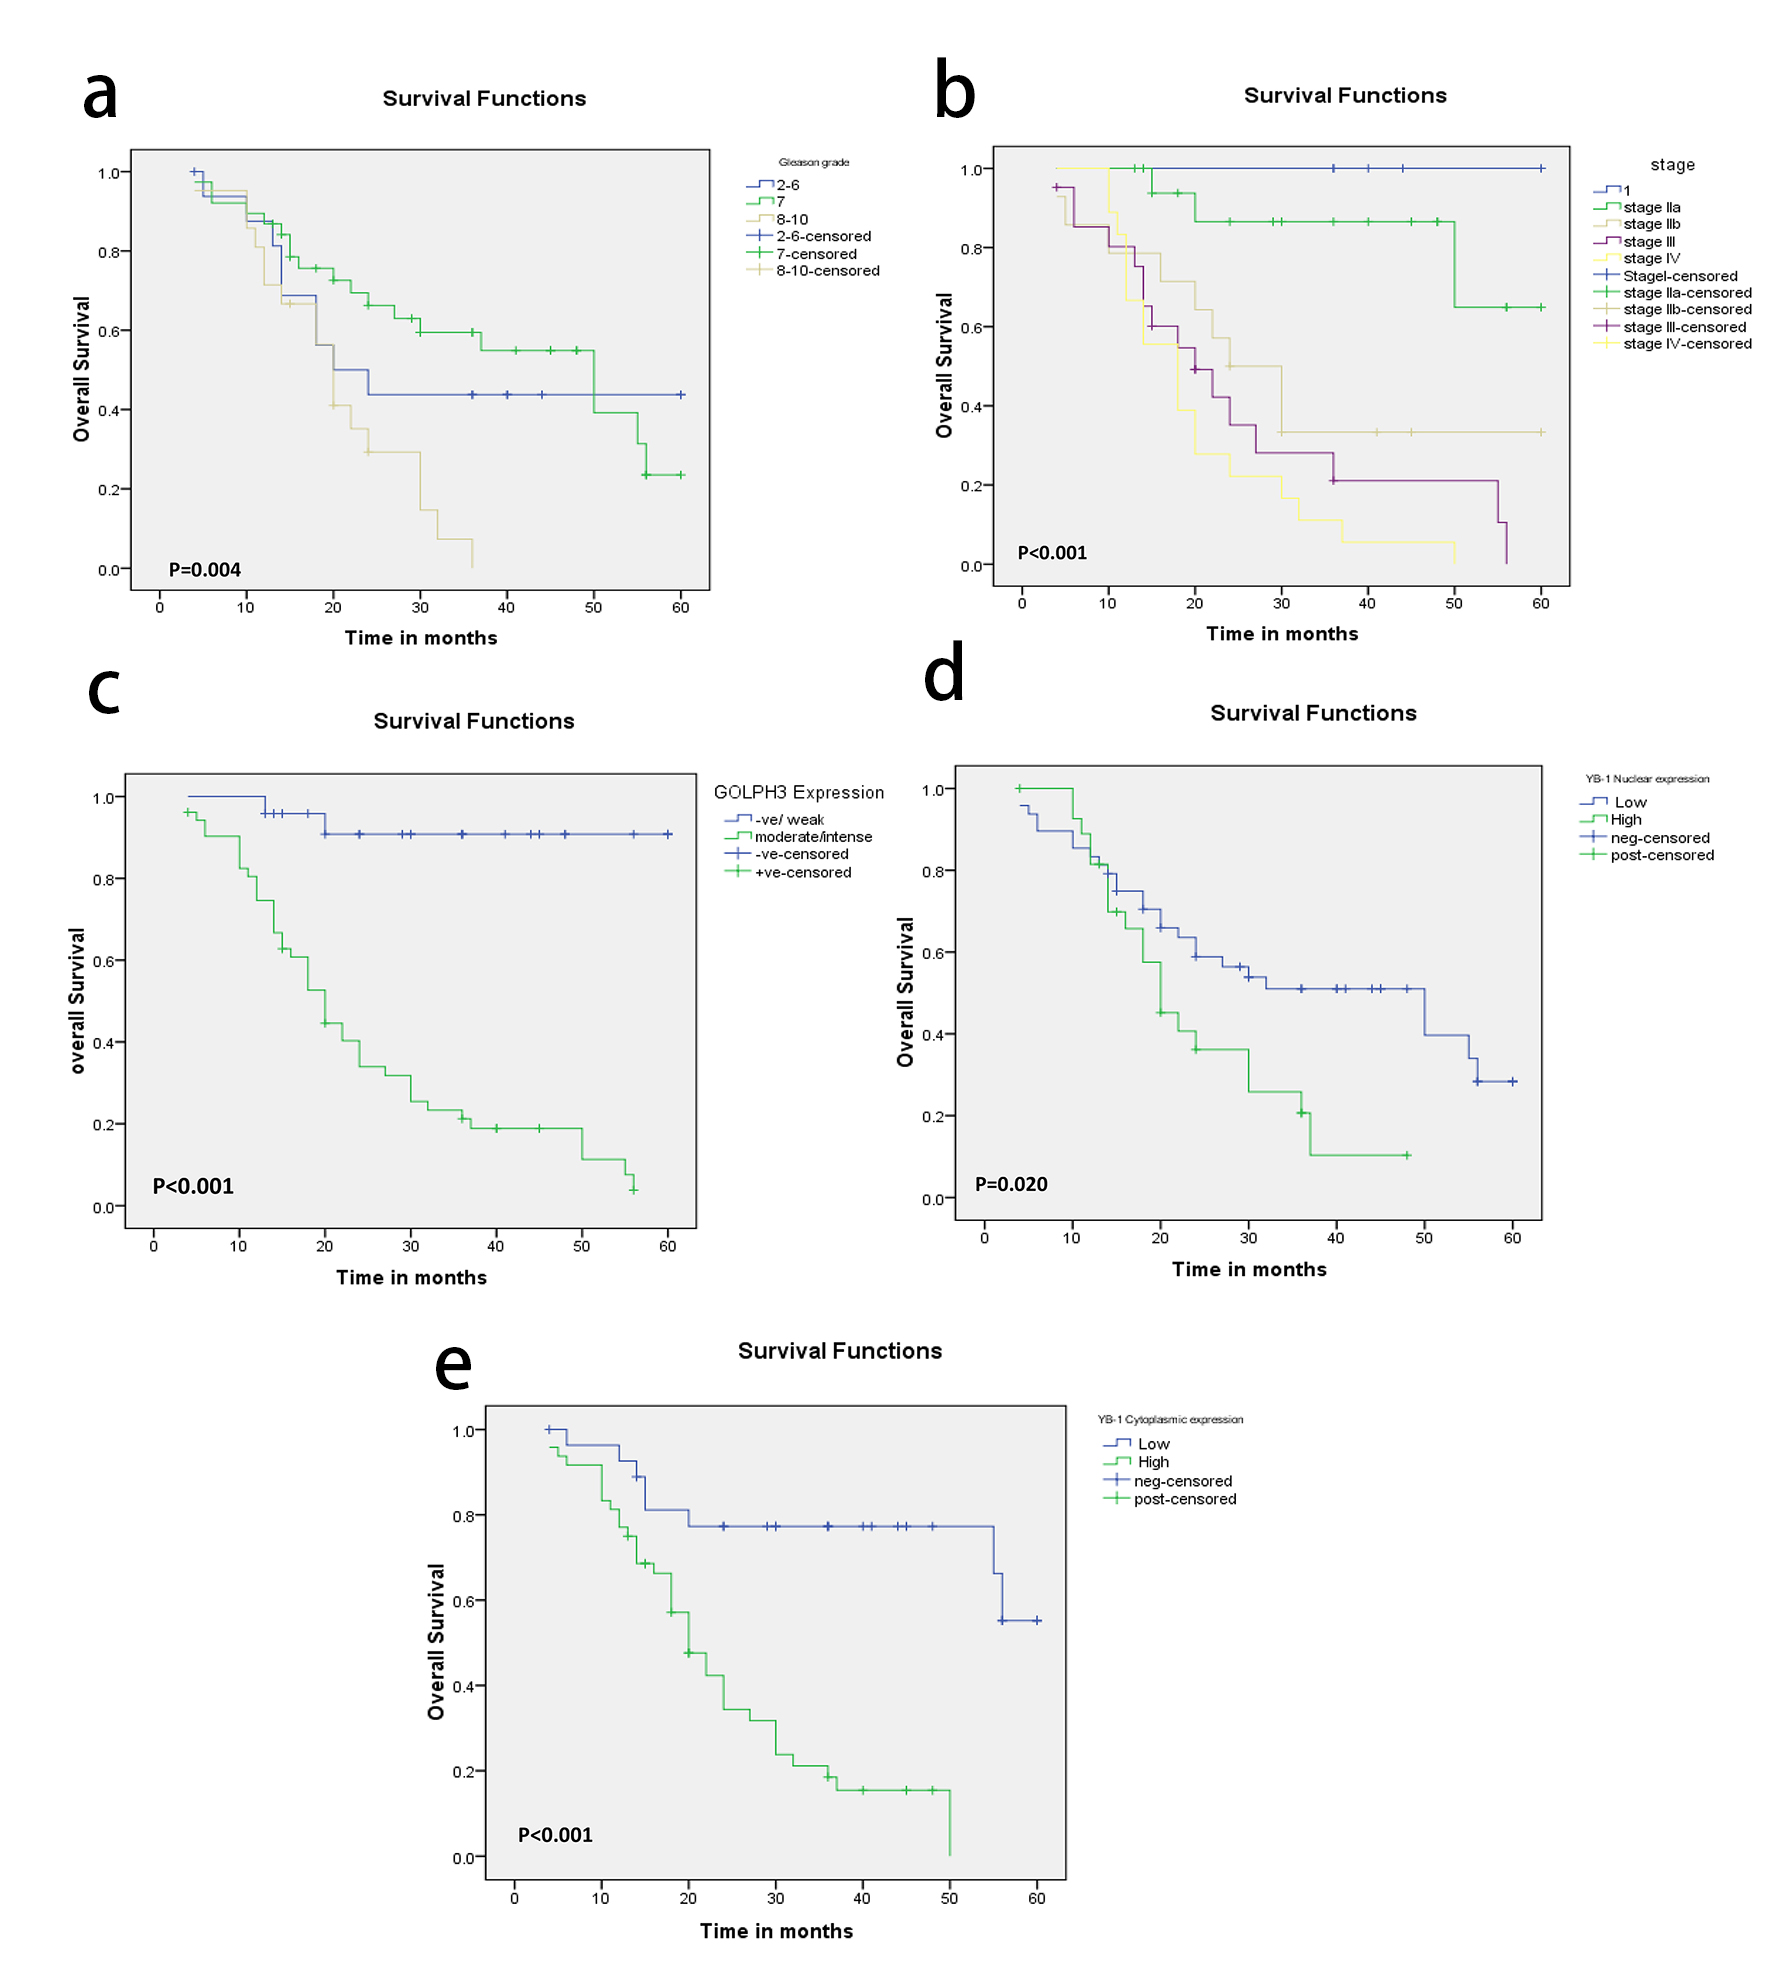
Figure 3. (a-e) Kaplan-Meier plots for overall survival in PC patients according to Gleason grade (a) and tumor stage (b), GOLPH3 expression (c), nuclear YB-1 (d) and cytoplasmic YB-1 expression (e) with significant P values using log-rank test.

Tables

Table 1. Patients’ Clinicopathological Parameters in Patients With PC (N = 76)
 
Clinicopathological parametersN%
pT status: pathological tumor stage; pN: lymph node status.
Age (years)
  ≤ 60810.5
  > 606889.5
Baseline PSA (ng/mL)
  < 101317.1
  10 - 203951.3
  > 202431.6
Gleason score
  Gleason 2 - 61722.4
  Gleason 73850
  Gleason 8 - 102127.8
pT status
  T24052.6
  T32735.5
  T4911.8
Perineural invasion
  Absent3444.7
  Present4255.3
pN status
  No6180.3
  N11519.7
Stage
  I56.6
  IIA1823.7
  IIB1418.4
  III2127.6
  IV1823.7
Mortality
  Alive3039.5
  Dead4660.5


Table 2. Association of GOLPH3 Immunohistochemical Expression With Clinicopathological Parameters in Prostatic Carcinoma (N = 76)
 
Clinicopathological parametersIntensity of GOLPH3 expressionP value
Negative/low (%)Moderate/intense (%)
Test of significance: Chi-squared and Fischer’s exact tests; P < 0.05 is considered significant. pT status: pathological tumor stage; pN: lymph node status; AR: androgen receptor.
Age (years)0.508
  ≤ 602 (25)6 (75)
  > 6022 (32.4)46 (67.6)
PSA (ng/mL)0.160
  < 107 (53.8)6 (46.2)
  10 - 2011 (28.2)28 (71.8)
  > 206 (25)18 (75)
Gleason score0.034
  Gleason 2 - 66 (35.3)11 (64.7)
  Gleason 716 (42.1)22 (57.9)
  Gleason 8 - 102 (9.5)19 (90.5)
pT status0.001
  T220 (50)20 (50)
  T33 (11.1)24 (88.9)
  T41 (11.1)8 (88.9)
Perineural invasion0.085
  Absent14 (41.2)20 (58.8)
  Present10 (23.8)32 (76.2)
pN status0.017
  No23 (37.7)38 (62.3)
  N11 (6.7)14 (93.3)
Stage< 0.001
  I4 (80)1 (20)
  IIA12 (66.7)6 (33.3)
  IIB5 (35.7)9 (64.3)
  III2 (9.5)19 (90.5)
  IV1 (5.6)17 (94.4)
AR0.008
  Low expression17 (45.9)20 (54.1)
  High expression7 (17.5)32 (82.1)
Mortality< 0.001
  Alive22 (73.3)8 (26.7)
  Dead2 (8.3)44 (84.6)


Table 3. Association of YB-1 Immunohistochemical Expression With Clinicopathological Parameters in Prostatic Carcinoma (N = 76)
 
Clinicopathological parametersNuclear YB-1 expressionCytoplasmic YB-1 expression
Low (%)High (%)P valueLow (%)High (%)P value
Test of significance: Chi-squared and Fischer’s exact tests. P < 0.05 is considered significant. pT status: pathological tumor stage; pN: lymph node status; AR: androgen receptor.
Age (years)0.01290.327
  ≤ 607 (87.7)1 (12.5)4 (50)4 (50)
  > 6041 (60.3)17 (39.7)24 (35.3)44 (64.7)
PSA (ng/mL)0.7310.237
  < 109 (69.2)4 (30.8)7 (53.8)8 (46.2)
  10 - 2023 (59)16 (41)14 (35.9)25 (64.1)
  > 2016 (66.7)8 (33.3)7 (29.2)17 (70.8)
Gleason score0.0180.008
  Gleason 2 - 613 (76.5)4 (23.5)7 (41.2)10 (58.8)
  Gleason 727 (71.1)11 (28.9)19 (50)19 (50)
  Gleason 8 - 108 (38.1)13 (61.9)2 (9.5)19 (90.5)
pT status0.4280.146
  T228 (70)12 (30)18 (45)22 (55)
  T315 (55.6)12 (44.4)9 (33.3)18 (66.7)
  T45 (55.6)4 (44.4)1 (11.1)8 (88.9)
Perineural invasion0.0730.173
  Absent25 (73.5)9 (26.5)15 (44.1)19 (55.9)
  Present23 (54.8)19 (45.2)13 (31)25 (69)
pN status0.2770.031
  No40 (65.6)21 (34.4)26 (42.6)35 (57.4)
  N18 (53.3)7 (46.7)2 (13.3)13 (86.7)
Stage0.1360.027
  I5 (100)0 (0)3 (60)2 (40)
  IIA13 (72.2)5 (27.8)11 (61.1)7 (38.9)
  IIB10 (71.4)4 (28.6)5 (35.7)9 (64.3)
  III12 (57.1)9 (42.9)7 (33.3)14 (66.7)
  IV8 (44.4)10 (55.6)2 (11.1)16 (88.9)
AR0.002< 0.001
  Low expression30 (81.1)7 (18.9)22 (59.5)15 (40.5)
  High expression18 (46.2)21 (53.8)6 (15.4)33 (84.6)
Mortality0.107< 0.001
  Alive22 (73.3)8 (26.7)20 (66.7)10 (33.3)
  Dead20 (56.5)20 (43.5)8 (17.4)38 (82.6)


Table 4. Correlations Between Immunohistochemical Markers in Different Lesions
 
LesionMarker expressionGOLPH3Nuclear YB-1Cytoplasmic YB-1
Test of significance: Pearson correlation. **Correlation is significant at the 0.01 level (two-tailed). *Correlation is significant at the 0.05 level (two-tailed).
BPHGOLPH3Pearson correlation-0.1030.649*
Sig. (two-tailed)-0.6650.002
Nuclear YB-1Pearson correlation0.103-0.116
Sig. (two-tailed)0.665-0.627
Cytoplasmic YB-1Pearson correlation0.649*0.116-
Sig. (two-tailed)0.0020.627-
PINGOLPH3Pearson correlation-0.922**0.399
Sig. (two-tailed)-< 0.0010.101
Nuclear YB-1Pearson correlation0.922**-0.559*
Sig. (two-tailed)< 0.001-0.016
Cytoplasmic YB-1Pearson correlation0.3990.559*-
Sig. (two-tailed)0.1010.016-
CarcinomaGOLPH3Pearson correlation-0.777**0.438**
Sig. (two-tailed)-< 0.001< 0.001
Nuclear YB-1Pearson correlation0.777**-0.611**
Sig. (two-tailed)< 0.001-< 0.001
Cytoplasmic YB-1Pearson correlation0.438**0.611**-
Sig. (two-tailed)< 0.001< 0.001-


Table 5. Multivariate Analyses of Overall Survival in Prostate Carcinoma Patients
 
VariablesHR95% CIP value
Test of significance: Cox regression analysis. P < 0.05 is considered significant. HR: hazard ratio; CI: confidence interval.
Grade0.8400.518 - 1.3610.478
pT status0.9230.507 - 1.6790.792
pN status0.9970.359 - 2.5150.994
Stage1.5740.939 - 2.6370.085
AR1.0860.603 - 2.4510.585
GOLPH35.9701.252 - 28.4590.025
Nuclear YB-11.2160.603 - 2.4510.585
Cytoplasmic YB-12.1000.731 - 6.0360.168