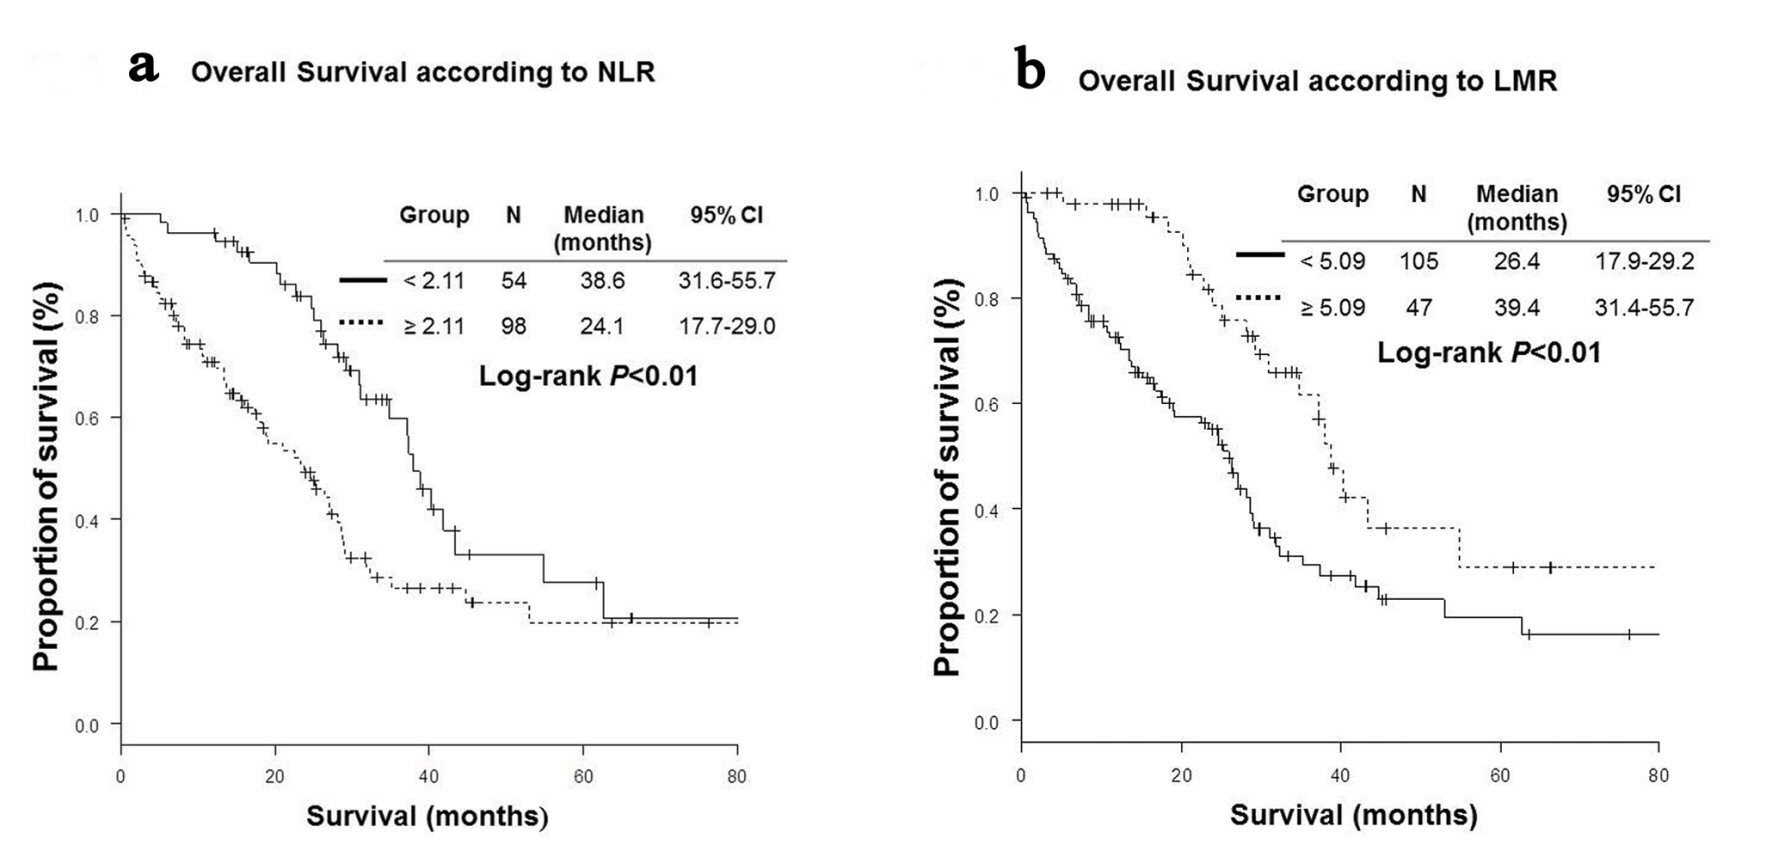
Figure 1. Kaplan-Meier curves of overall survival. (a) Neutrophil-to-lymphocyte ratio (NLR). (b) Lymphocyte-to-monocyte ratio (LMR).
| World Journal of Oncology, ISSN 1920-4531 print, 1920-454X online, Open Access |
| Article copyright, the authors; Journal compilation copyright, World J Oncol and Elmer Press Inc |
| Journal website http://www.wjon.org |
Original Article
Volume 8, Number 6, December 2017, pages 180-187
Neutrophil-to-Lymphocyte Ratio Predicts Overall Survival of Advanced Non-Small Cell Lung Cancer Harboring Mutant Epidermal Growth Factor Receptor
Figures
Tables
| Groups | ALL | NLR | LMR | ||||
|---|---|---|---|---|---|---|---|
| < 2.11 | ≥ 2.11 | P | < 5.09 | ≥ 5.09 | P | ||
| aMann-Whitney test. bFisher’s extract test. cDouble mutations. Exon 19del + Exon 21 L858R and Exon 21 L858R + Exon 18 G719S in each one case. Ad: adenocarcinoma; BMI: body mass index; del: deletion; CI: confidence interval; ECOG PS: Eastern Cooperative Oncology Group performance status; LMR: lymphocyte-to-monocyte ratio; Lymph: lymphocyte; met: metastasis; Mono: monocyte; mt: mutation; Neut: neutrophil; NLR: neutrophil-to-lymphocyte ratio; Rec: post-surgical recurrence; SD: standard deviation. | |||||||
| N | 152 | 54 | 98 | 105 | 47 | ||
| Backgrounds | |||||||
| Age (years, mean ± SD) | 70.3 ± 10.3 | 70.5 ± 8.6 | 70.2 ± 11.1 | 0.66a | 70.4 ± 10.7 | 70.1 ± 9.4 | 0.69a |
| Sex (N, male/female) | 57/95 | 15/39 | 42/56 | 0.08b | 45/60 | 12/35 | 0.047b |
| Histology (N, Ad/others) | 148/4 | 54/0 | 94/4 | 0.30b | 101/4 | 47/0 | 0.31b |
| Stage (N, IIIA/IIIB/IV/Rec) | 10/3/102/37 | 4/2/30/18 | 6/1/72/19 | 0.10b | 6/1/74/24 | 4/2/28/13 | 0.32b |
| Distant met (N) | 132 | 46 | 86 | 0.44b | 95 | 39 | 0.28b |
| Brain met (N) | 32 | 13 | 19 | 0.54b | 21 | 11 | 0.67b |
| Liver met (N) | 14 | 3 | 11 | 0.38b | 10 | 4 | 1.00b |
| Bone met (N) | 55 | 11 | 44 | < 0.01b | 45 | 10 | 0.01b |
| ECOG PS (N, 0 - 1/2/3/4) | 111/32/7/2 | 49/5/0/0 | 62/27/7/2 | < 0.01b | 68/28/7/2 | 43/4/0/0 | < 0.01b |
| BMI (mean ± SD) | 21.8 ± 4.1 | 22.0 ± 3.3 | 21.6 ± 4.5 | 0.13a | 21.7 ± 4.4 | 22.0 ± 3.4 | 0.30a |
| EGFR mt (N)c | |||||||
| Ex 19del | 74 | 27 | 47 | 50 | 24 | ||
| Ex 21 point mt | 74 | 25 | 49 | 53 | 21 | ||
| Minor mt | 6 | 3 | 3 | 3 | 3 | ||
| Ex19 del vs. other | 74/78 | 27/27 | 47/51 | 0.87b | 50/55 | 24/23 | 0.73b |
| Laboratory data | |||||||
| Neut (cells/µL) | 4,183 ± 1,956 | 3,075 ± 1,095 | 4,793 ± 2,060 | < 0.01a | 4,606 ± 2,093 | 3,237 ± 1,155 | < 0.01a |
| Lymph (cells/µL) | 1,496 ± 605 | 1,962 ± 554 | 1,239 ± 463 | < 0.01a | 1,338 ± 507 | 1,850 ± 659 | < 0.01a |
| Mono (cells/µL) | 411 ± 177 | 349 ± 123 | 446 ± 193 | < 0.01a | 468 ± 175 | 286 ± 101 | < 0.01a |
| Group | All | NLR | LMR | ||||
|---|---|---|---|---|---|---|---|
| < 2.11 | ≥ 2.11 | Pa | < 5.09 | ≥ 5.09 | Pa | ||
| aFisher’s extract test. Afa: afatinib; CI: confidence interval; DCR: disease control rate; Erl: erlotinib; Gef: gefitinib; LMR: lymphocyte-to-monocyte ratio; NLR: neutrophil-to-lymphocyte ratio; RR: response rate; TKI: tyrosine kinase inhibitor; TRT: thoracic radiotherapy. | |||||||
| N | 152 | 54 | 98 | 105 | 47 | ||
| TKI choice (N, Gef/Erl/Afa) | 107/36/9 | 43/10/1 | 64/26/8 | 0.12 | 72/27/6 | 35/9/3 | 0.68 |
| TKI line (N, first/second/≥ third) | 104/38/11 | 37/14/4 | 67/24/7 | 1.00 | 71/27/7 | 33/11/3 | 0.96 |
| Pre TKI treatment (N) | 49 | 18 | 31 | 0.86 | 34 | 10 | 0.18 |
| Platinum-based | 39 | 14 | 25 | 1.00 | 30 | 7 | 0.10 |
| Curative-intent TRT | 8 | 3 | 5 | 1.00 | 6 | 2 | 1.00 |
| Post TKI treatment (N) | 98 | 41 | 57 | 0.03 | 64 | 34 | 0.20 |
| Cytotoxic drugs | 62 | 26 | 36 | 0.23 | 40 | 22 | 0.37 |
| Platinum-based | 27 | 10 | 17 | 1.00 | 18 | 13 | 0.19 |
| Osimertinib | 14 | 5 | 9 | 1.00 | 9 | 5 | 0.76 |
| Re-challenge of TKI | 62 | 27 | 35 | 0.12 | 42 | 22 | 0.48 |
| Palliative radiotherapy (N) | 57 | 18 | 39 | 0.49 | 38 | 19 | 0.72 |
| TKI Response (N) | |||||||
| Complete response | 5 | 3 | 2 | 2 | 3 | ||
| Partial response | 88 | 36 | 52 | 55 | 33 | ||
| Stable disease | 29 | 11 | 18 | 21 | 8 | ||
| Progressive disease | 19 | 2 | 17 | 18 | 1 | ||
| Not evaluated | 11 | 2 | 9 | 9 | 2 | ||
| RR (%) (95% CI) | 61.2 (53.0 - 69.0) | 72.2 (58.4 - 83.5) | 55.1 (44.7 - 65.2) | 0.055 | 54.3 (44.3 - 64.0) | 76.6 (62.0 - 87.7) | 0.01 |
| DCR (%) (95% CI) | 80.3 (73.0 - 86.3) | 92.6 (82.1- 97.9) | 73.5 (63.6 - 81.9) | < 0.01 | 74.3 (64.8 - 82.3) | 93.6 (82.5 - 98.7) | < 0.01 |
| OS | PFS | |||||
|---|---|---|---|---|---|---|
| HR | 95% CI | P | HR | 95% CI | P | |
| Afa: afatinib; BMI: body mass index; Ccr: creatinine clearance; CI: confidence interval; CRP: C-reactive protein; del: deletion; ECOG PS: Eastern Cooperative Oncology Group performance status; EGFR-TKI: epidermal growth factor receptor- tyrosine kinase inhibitor; Erl: erlotinib; Gef: gefinitib; HR: hazard ratio; LDH: lactate dehydrogenase; LMR: lymphocyte-to-monocyte ratio; NLR: neutrophil-to-lymphocyte ratio; OS: overall survival; PFS: progression-free survival. | ||||||
| Age (years < 75 vs. ≥ 75) | 1.18 | 0.75 - 1.85 | 0.48 | 0.97 | 0.67 - 1.41 | 0.88 |
| Sex (female vs. male) | 1.33 | 0.86 - 2.07 | 0.19 | 1.17 | 0.81 - 1.68 | 0.41 |
| Distant metastasis (no vs. yes) | 2.08 | 0.99 - 4.38 | 0.054 | 2.10 | 1.12 - 3.93 | 0.02 |
| ECOG PS (0 - 1 vs. 2 - 4) | 4.08 | 2.56 - 6.50 | < 0.01 | 1.98 | 1.33 - 2.93 | < 0.01 |
| BMI (≥ 18.5 vs. < 18.5) | 1.58 | 0.95 - 2.64 | 0.08 | 1.60 | 1.04 - 2.47 | 0.03 |
| EGFR mutation (exon 19 del vs. others) | 1.27 | 0.82 - 1.95 | 0.29 | 1.14 | 0.79 - 1.63 | 0.49 |
| EGFR-TKI line (first vs. second or later) | 1.46 | 0.94 - 2.26 | 0.09 | 1.47 | 1.01 - 2.15 | 0.04 |
| EGFR-TKI (Gef vs. Erl or Afa) | 0.84 | 0.50 - 1.41 | 0.51 | 0.61 | 0.40 - 0.92 | 0.02 |
| Hemoglobin (g/dL) | 0.89 | 0.77 - 1.02 | 0.09 | 0.94 | 0.85 - 1.05 | 0.29 |
| Ccr (mL/min) (/10) | 0.86 | 0.74 - 0.998 | 0.047 | 0.88 | 0.78 - 0.99 | 0.04 |
| Sodium (mEq/L) (/10) | 0.19 | 0.10 - 0.39 | < 0.01 | 0.34 | 0.19 - 0.62 | < 0.01 |
| LDH (IU/L) (/100) | 1.36 | 1.19 - 1.54 | < 0.01 | 1.24 | 1.11 - 1.39 | < 0.01 |
| CRP (mg/dL) | 1.17 | 1.08 - 1.27 | < 0.01 | 1.19 | 1.10 - 1.29 | < 0.01 |
| NLR | 1.12 | 1.07 - 1.18 | < 0.01 | 1.08 | 1.03 - 1.13 | < 0.01 |
| LMR | 0.78 | 0.69 - 0.89 | < 0.01 | 0.89 | 0.81 - 0.98 | 0.02 |
| NLR | LMR | |||||
|---|---|---|---|---|---|---|
| HR | 95% CI | P | HR | 95% CI | P | |
| BMI: body mass index; Ccr: creatinine clearance: CI: confidence interval; CRP: C-reactive protein; ECOG PS: Eastern Cooperative Oncology Group performance status; EGFR-TKI: epidermal growth factor receptor-tyrosine kinase inhibitors; HR: hazard ratio; LDH: lactate dehydrogenase; LMR: lymphocyte-to-monocyte ratio; NLR: neutrophil-to-lymphocyte ratio. | ||||||
| Distant metastasis (no vs. yes) | 1.59 | 0.73 - 3.50 | 0.25 | 1.44 | 0.64 - 3.24 | 0.38 |
| ECOG PS (0 - 1 vs. 2 - 4) | 3.46 | 2.03 - 5.89 | < 0.01 | 3.41 | 1.99 - 5.82 | < 0.01 |
| BMI (≥ 18.5 vs. < 18.5) | 1.62 | 0.89 - 2.93 | 0.12 | 1.58 | 0.87 - 2.87 | 0.14 |
| EGFR-TKI line (first vs. second or later) | 1.71. | 1.07 - 2.73 | 0.02 | 1.72 | 1.08 - 2.74 | 0.02 |
| Hemoglobin (g/dL) | 1.14 | 0.97 - 1.34 | 0.11 | 1.15 | 0.98 - 1.36 | 0.08 |
| Ccr (mL/min) (/10) | 0.86 | 0.73 - 1.02 | 0.08 | 0.86 | 0.73 - 1.01 | 0.07 |
| Sodium (mEq/L) (/10) | 0.30 | 0.13 - 0.71 | < 0.01 | 0.27 | 0.11 - 0.64 | < 0.01 |
| LDH (IU/L) (/100) | 1.24 | 1.05 - 1.48 | 0.01 | 1.27 | 1.07 - 1.50 | < 0.01 |
| CRP (mg/dL) | 1.01 | 0.90 - 1.14 | 0.82 | 0.98 | 0.86 - 1.11 | 0.74 |
| NLR | 1.07 | 1.01 - 1.14 | 0.03 | - | - | - |
| LMR | - | - | - | 0.88 | 0.76 - 1.01 | 0.07 |
| NLR | LMR | |||||
|---|---|---|---|---|---|---|
| HR | 95% CI | P | HR | 95% CI | P | |
| Afa: afatinib; ALP: alkaline phosphatase; BMI: body mass index; Ccr: creatinine clearance; CI: confidence interval; CRP: C-reactive protein; ECOG PS: Eastern Cooperative Oncology Group performance status; EGFR-TKI: epidermal growth factor receptor-tyrosine kinase inhibitors; Erl: erlotinib; Gef: gefitinib; HR: hazard ratio; LDH: lactate dehydrogenase; LMR: lymphocyte-to-monocyte ratio; NLR: neutrophil-to-lymphocyte ratio. | ||||||
| Distant metastasis (no vs. yes) | 1.69 | 0.87 - 3.27 | 0.12 | 1.77 | 0.92 - 3.42 | 0.09 |
| ECOG PS (0 - 1 vs. 2 - 4) | 1.55 | 0.97 - 2.47 | 0.07 | 1.63 | 1.01 - 2.61 | 0.04 |
| BMI (≥ 18.5 vs. < 18.5) | 1.53 | 0.94 - 2.47 | 0.09 | 1.57 | 0.96 - 2.55 | 0.07 |
| EGFR-TKI line (first vs. second or later) | 1.47 | 0.99 - 2.19 | 0.058 | 1.49 | 1.00 - 2.23 | 0.049 |
| EGFR-TKI (Gef vs. Erl or Afa) | 0.63 | 0.40 - 0.99 | 0.046 | 0.64 | 0.41 - 1.01 | 0.06 |
| Ccr (mL/min) (/10) | 0.94 | 0.82 - 1.08 | 0.37 | 0.94 | 0.82 - 1.07 | 0.36 |
| Sodium (mEq/L) (/10) | 0.60 | 0.30 - 1.20 | 0.15 | 0.60 | 0.30 - 1.21 | 0.16 |
| LDH (IU/L) (/100) | 1.11 | 0.97 - 1.27 | 0.15 | 1.12 | 0.98 - 1.29 | 0.10 |
| CRP (mg/dL) | 1.10 | 0.99 - 1.22 | 0.08 | 1.10 | 0.99 - 1.23 | 0.07 |
| NLR | 1.03 | 0.97 - 1.10 | 0.29 | - | - | - |
| LMR | - | - | - | 1.00 | 0.90 - 1.12 | 0.99 |
| Author (year) | Country | N | Treatment | Variable | Multivariate analyses | ||||
|---|---|---|---|---|---|---|---|---|---|
| Cut-off | OS | PFS | |||||||
| HR (95% CI) | P | HR (95% CI) | P | ||||||
| CI: confidence interval; Erl: erlotinib; Gef: gefitinib; HR: hazard ratio; NA: not assessed; LMR: lymphocyte-to-monocyte ratio; NLR: neutrophil-to-lymphocyte ratio; OS: overall survival; PFS: progression free survival. | |||||||||
| Lin et al [27] (2014) | China | 81 | Gef (30%) Erl (70%) All first-line | NLR | 3.5 | 3.29 (1.62 - 6.71) | < 0.001 | 3.89 (1.98 - 7.68) | < 0.001 |
| Chen et al [30] (2015) | Taiwan | 253 | All first-line | LMR | 3.29 | 2.36 (1.66 - 3.35) | < 0.001 | 1.71 (1.14 - 2.56) | 0.009 |
| Sim et al [29] (2016) | Korea | 85 | All first-line | NLR | 3 | NA | NA | 1.239 (0.693 - 2.215) | 0.469 |
| Meriggi et al [28] (2017) | Italy | 63 | Gef (71%) Erl (29%) | NLR | 3.5 | 2.699 (1.187 - 6.137) | 0.018 | 2.275 (1.257 - 4.116) | 0.007 |
| Ding et al [26] (2017) | Australia | 85 | First-line (85%) | NLR | 5 | 0.43 (0.19 - 0.94) | 0.04 | 0.40 (0.18 - 0.87) | 0.02 |
| Ours | Japan | 152 | Gef (70%) Erl (24%) First-line (68%) | NLR | - | 1.07 (1.01 - 1.14) | 0.03 | 1.03 (0.97 - 1.10) | 0.29 |
| LMR | - | 0.88 (0.76 - 1.01) | 0.07 | 1.00 (0.90 - 1.12) | 0.99 | ||||