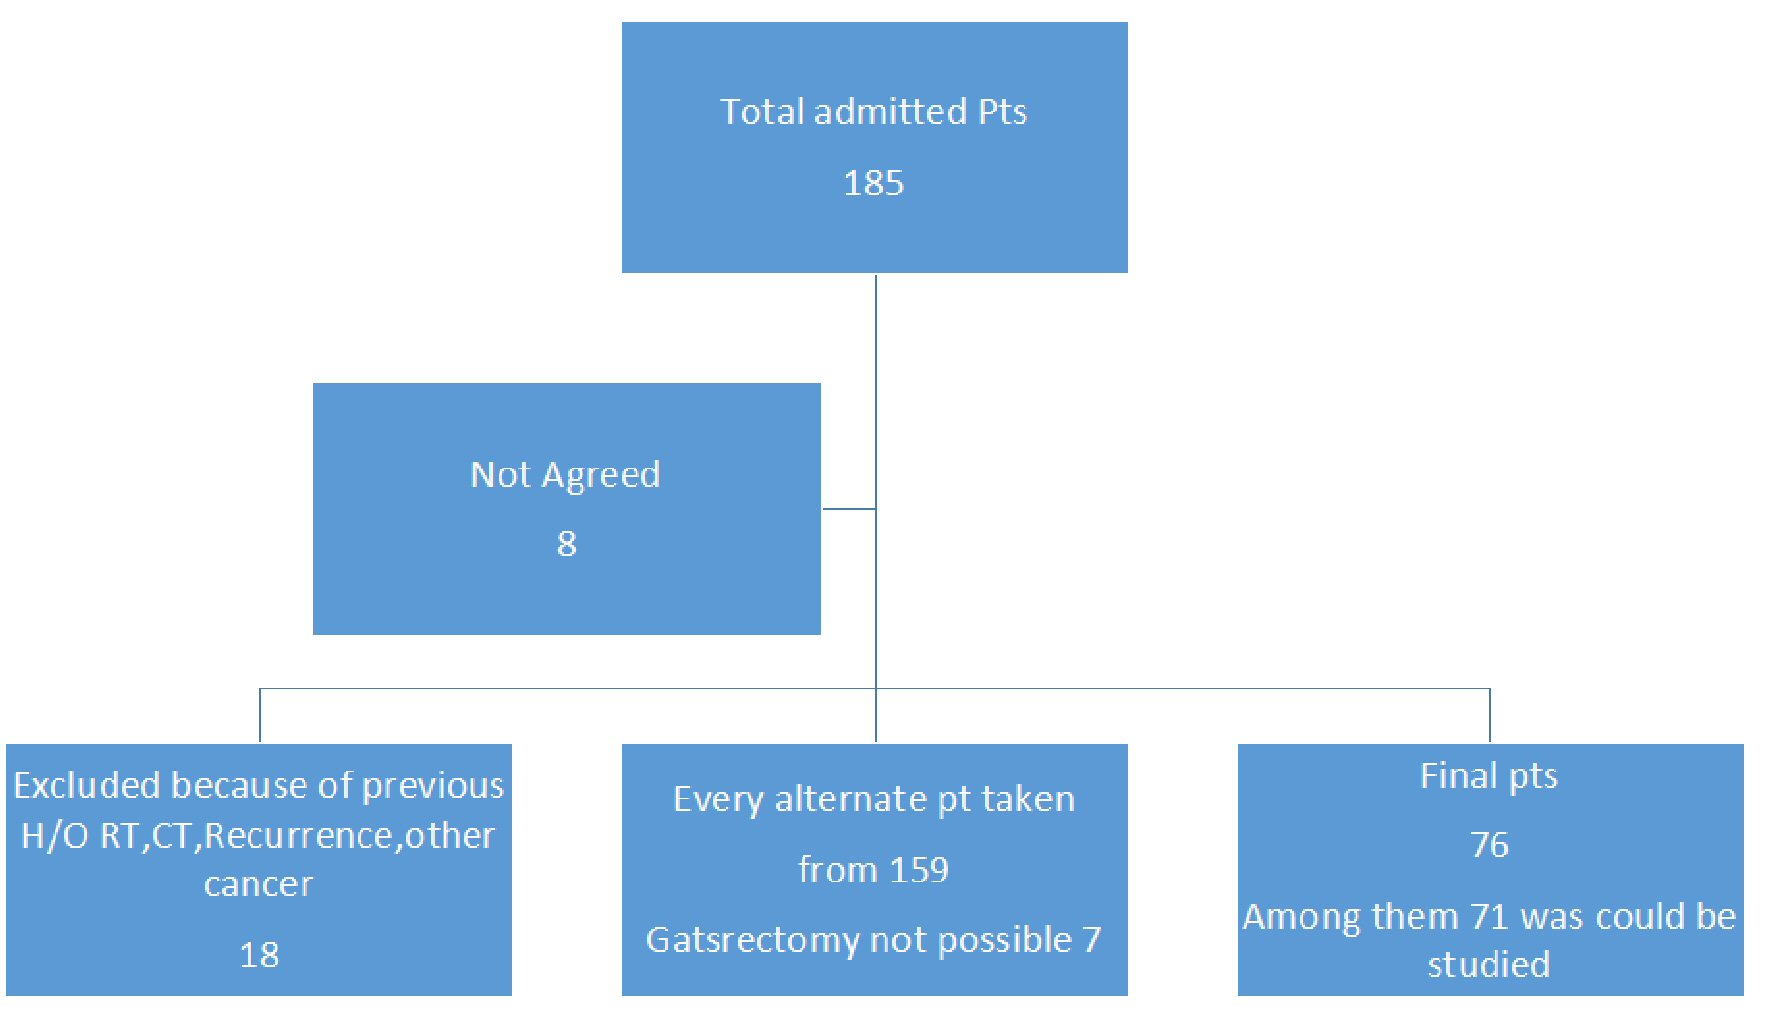
Figure 1. Showing the layout of patients.
| World Journal of Oncology, ISSN 1920-4531 print, 1920-454X online, Open Access |
| Article copyright, the authors; Journal compilation copyright, World J Oncol and Elmer Press Inc |
| Journal website http://www.wjon.org |
Original Article
Volume 10, Number 1, February 2019, pages 46-54
Association of p53 Gene Mutation With Helicobacter pylori Infection in Gastric Cancer Patients and Its Correlation With Clinicopathological and Environmental Factors
Figure
Tables
| Factors | Positive | Percentage | Negative | Percentage | Total | P value |
|---|---|---|---|---|---|---|
| Smoking | ||||||
| Smoker | 33 | 75.0% | 11 | 25% | 44 | 0.436 |
| Non smoker | 19 | 70.4% | 8 | 29.6% | 27 | |
| Age group | ||||||
| ≤ 40 yrs | 17 | 94.4% | 1 | 5.6% | 18 | 0.015 |
| ≥ 41 yrs | 35 | 66% | 18 | 34% | 43 | |
| Location of the tumor | ||||||
| Fundus | 7 | 77.8% | 2 | 22.2% | 9 | 0.790 |
| Body | 20 | 69% | 9 | 31% | 29 | |
| Antrum | 25 | 75.8% | 8 | 24.2% | 33 | |
| Extra salt intake | ||||||
| Yes | 41 | 80.39 | 10 | 19.60 | 51 | 0.033 |
| No | 11 | 55 | 9 | 45 | 20 | |
| Morphology of the tumor | ||||||
| Ulcerative | 7 | 77.8 | 2 | 22.2% | 9 | 0.939 |
| Proliferative | 23 | 71.9% | 9 | 28.1% | 32 | |
| Ulceroproliferative | 22 | 73.3% | 8 | 26.7% | 30 | |
| Tumor (T) | ||||||
| T1 - T3 | 42 | 79.2% | 11 | 20.8% | 53 | 0.05 |
| T4 | 10 | 55.6% | 8 | 44.4% | 18 | |
| Lymph node status (N) | ||||||
| N0 | 26 | 83.9% | 5 | 16.1% | 31 | 0.05 |
| N1 - N3 | 26 | 65.0% | 14 | 35.0% | 40 | |
| Metastasis (M) | ||||||
| M0 | 47 | 73.4% | 17 | 26.6% | 64 | .218 |
| M1 | 5 | 83.3% | 1 | 16.7% | 6 | |
| Gender | ||||||
| Male | 37 | 77.1% | 11 | 22.9% | 48 | 0.219 |
| Female | 15 | 65.2% | 8 | 34.8% | 23 | |
| H. pylori | ||||||
| Positive | 41 | 78.8 % | 10 | 19.2% | 51 | 0.043 |
| Negative | 11 | 21.15 | 9 | 17.3% | 20 | |
| Grading | ||||||
| Well differentiated | 3 | 5.76 | 0 | 3 | 0.247 | |
| Moderately differentiated | 20 | 38.46 | 11 | 21.15 | 31 | |
| Poorly differentiated | 29 | 55.76 | 8 | 15.38 | 37 |
| Model summary | |||
|---|---|---|---|
| Step | -2 Log likelihood | Cox & Snell R Square | Nagelkerke R Square |
| aEstimation terminated at iteration number 6 because parameter estimates changed by less than 0.001. | |||
| 1 | 55.798a | 0.313 | 0.456 |
| Coefficient | SE | Wald | DF | Sig | Exp(B) | |
|---|---|---|---|---|---|---|
| SE: standard error; DF: degree of freedom; Sig: significance level; Exp (B): exponentiation of the B coefficient, which is an odds ratio. | ||||||
| Smoking | -0.235 | 0.883 | 0.071 | 1 | 0.790 | 0.790 |
| Location | -0.210 | 0.508 | 0.171 | 1 | 0.679 | 0.810 |
| Extra salt | 1.149 | 0.845 | 1.848 | 1 | 0.174 | 3.155 |
| Morphology | -0.257 | 0.526 | 0.238 | 1 | 0.625 | 0.773 |
| Stage T | 1.822 | 0.863 | 4.454 | 1 | 0.035 | 6.184 |
| Stage N | 1.150 | 0.872 | 1.738 | 1 | 0.187 | 3.159 |
| Stage M | -0.610 | 1.663 | 0.135 | 1 | 0.714 | 0.543 |
| Sex | 0.616 | 0.807 | 0.583 | 1 | 0.445 | 1.851 |
| H. pylori | 2.060 | 0.775 | 7.062 | 1 | 0.008 | 7.848 |
| Grading | -0.837 | 0.609 | 1.890 | 1 | 0.169 | 0.433 |
| Age group | 2.693 | 1.330 | 4.103 | 1 | 0.043 | 14.780 |
| Constant | -11.258 | 4.223 | 7.107 | 1 | 0.008 | 0.000 |
| B | SE | Wald | DF | Sig | Exp (B) | 95% CI for Exp (B) | ||
|---|---|---|---|---|---|---|---|---|
| Lower | Upper | |||||||
| aVariable (s) entered on step 1: smoking, location, extra salt, morphology, stage T, stage N, stage M, sex, H. pylori, grading, and age. SE: standard error; DF: degree of freedom; Sig: significance level; Exp (B): exponentiation of the B coefficient, which is an odds ratio. | ||||||||
| Step 1a | ||||||||
| Smoking (1) | 0.331 | 1.066 | 0.096 | 1 | 0.756 | 1.392 | 0.172 | 11.248 |
| Location | 3.610 | 2 | 0.164 | |||||
| Location (1) | -0.185 | 2.100 | 0.008 | 1 | 0.930 | 0.831 | 0.014 | 50.999 |
| Location (2) | 2.196 | 1.191 | 3.397 | 1 | 0.05 | 8.985 | 0.870 | 92.801 |
| Extra salt (1) | -1.596 | 1.077 | 2.198 | 1 | 0.138 | 0.203 | 0.025 | 1.672 |
| Morphology | 4.340 | 2 | 0.114 | |||||
| Morphology (1) | 1.464 | 1.443 | 1.029 | 1 | 0.310 | 4.324 | 0.256 | 73.155 |
| Morphology (2) | 2.358 | 1.132 | 4.340 | 1 | 0.037 | 10.573 | 1.150 | 97.220 |
| Stage T (1) | -4.326 | 1.501 | 8.307 | 1 | 0.004 | 0.013 | 0.001 | 0.250 |
| Stage N (1) | -1.590 | 1.108 | 2.058 | 1 | 0.151 | 0.204 | 0.023 | 1.790 |
| Stage M | 0.000 | 2 | 1.000 | |||||
| Stage M (1) | 18.106 | 40192.971 | 0.000 | 1 | 1.000 | 73013299.578 | 0.000 | |
| Stage M (2) | -0.001 | 1.730 | 0.000 | 1 | 1.000 | 0.999 | 0.034 | 29.659 |
| Sex (1) | -0.529 | 0.999 | 0.280 | 1 | 0.597 | 0.589 | 0.083 | 4.177 |
| H. pylori (1) | -2.678 | 1.062 | 6.359 | 1 | 0.012 | 0.069 | 0.009 | 0.551 |
| Grading | 6.980 | 2 | 0.031 | |||||
| Grading (1) | -19.315 | 21121.983 | 0.000 | 1 | 0.999 | 0.000 | 0.000 | |
| Grading (2) | 3.850 | 1.457 | 6.980 | 1 | 0.008 | 46.973 | 2.701 | 816.839 |
| Age group | -5.221 | 1.907 | 7.496 | 1 | 0.006 | 0.005 | 0.000 | 0.227 |
| Constant | 2.308 | 1.974 | 1.367 | 1 | 0.242 | 10.053 | ||
| H. pylori | Odd ratio | Interpretation | ||
|---|---|---|---|---|
| Positive | Negative | |||
| p53 positive | 41 | 11 | 3.35 | People having positive H. pylori have 3.35 times the chance of p53 mutation compared to people having negative H. pylori. |