Figures
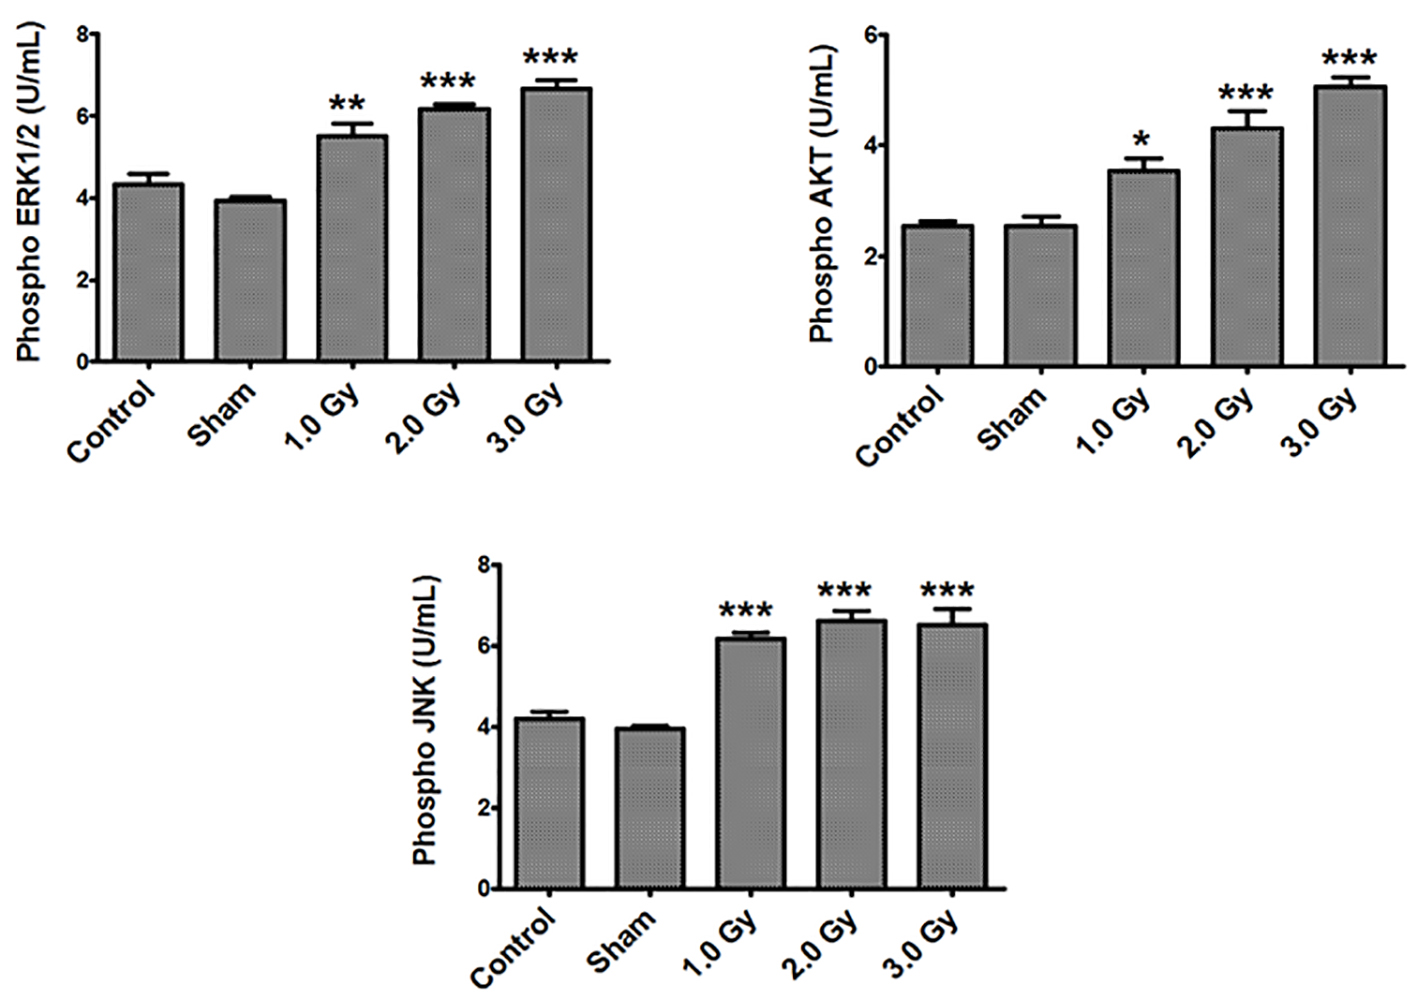
Figure 1. Exposure of B16F10 cells to radiation increased phosphorylated ERK1/2, AKT and JNK levels. There were no significant differences in any of the measured phosphorylated proteins between control and sham-treated groups. Phosphorylated ERK1/2 levels - control or sham versus 1.0 (P < 0.001); control or sham versus 2.0 and 3.0 Gy (P < 0.0001). Phosphorylated AKT levels - control versus 1.0 Gy (P < 0.01); sham versus 1.0 Gy (P < 0.001); control or sham versus 2.0 and 3.0 Gy (P < 0.0001). Phosphorylated JNK levels - control or sham versus 1.0, 2.0 and 3.0 Gy (P < 0.0001).
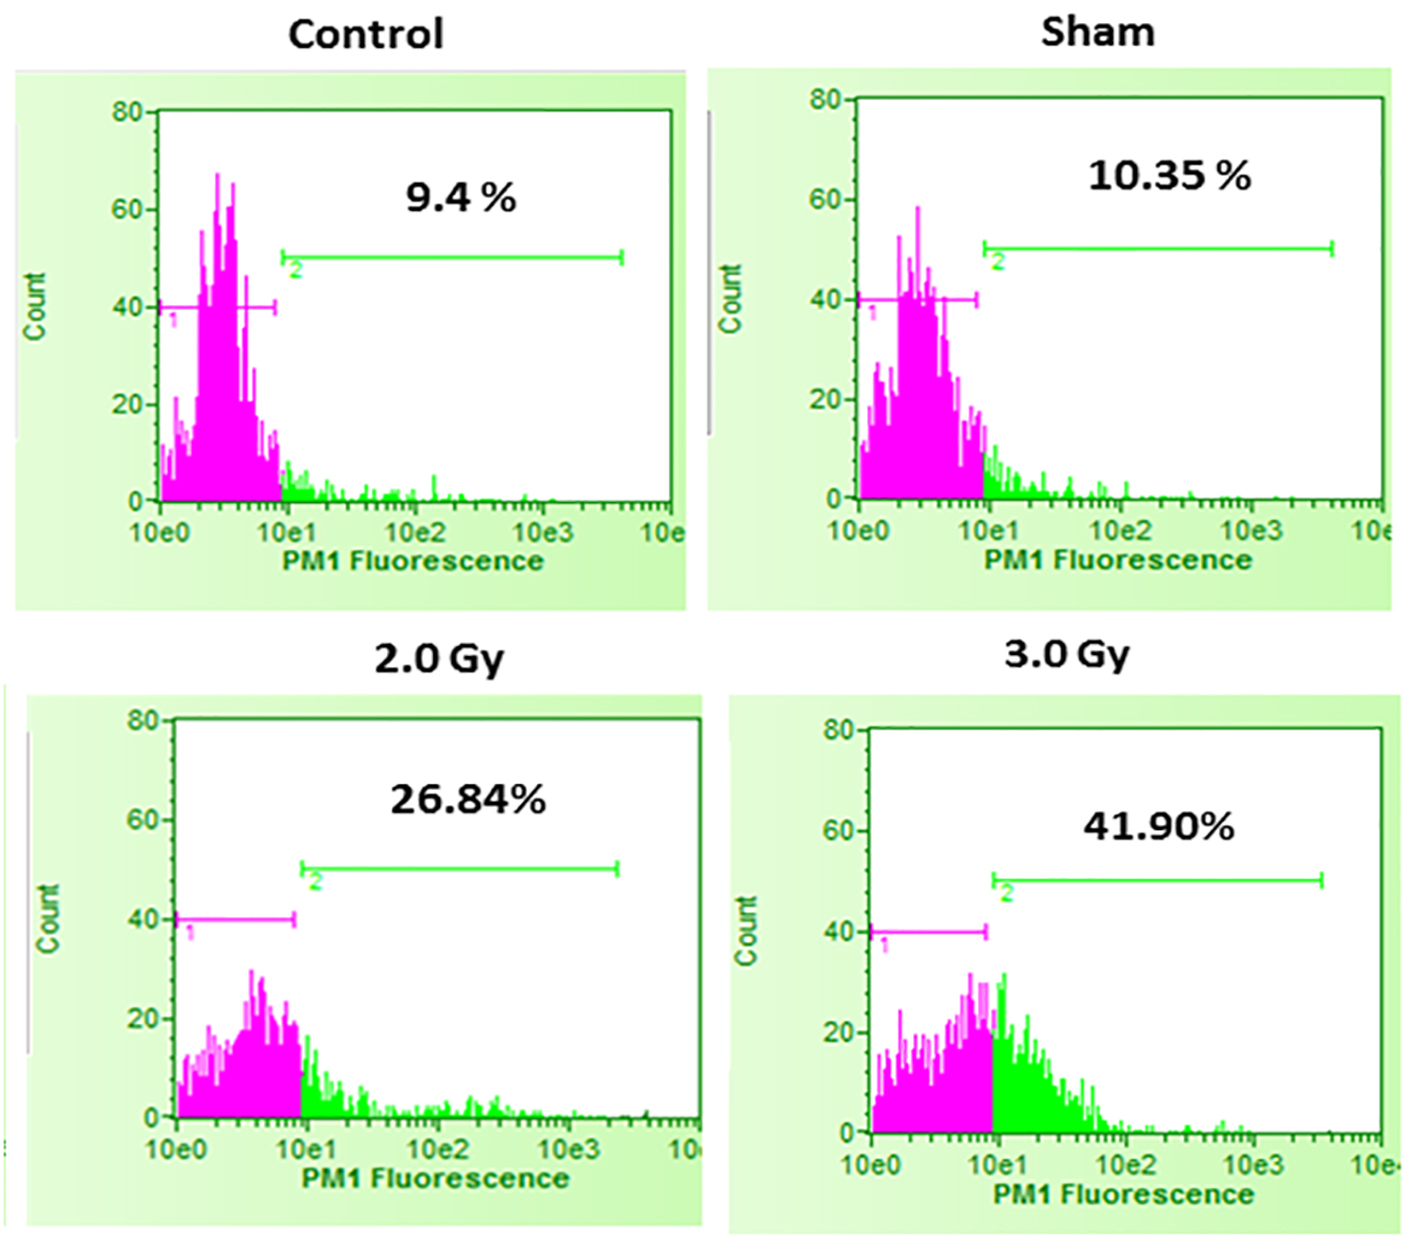
Figure 2. Cell death in control B16F10 cells, sham-irradiated cells, 2.0 Gy irradiated cells and 3.0 Gy irradiated cells. Compared to control and sham-irradiated cells, 2.0 Gy and 3.0 Gy of irradiation significantly increased cell death (P < 0.0001). Further, compared to 2.0 Gy irradiation, irradiation with 3.0 Gy significantly increased cell death (P < 0.001). Pink color indicates viable cell fraction and green color indicates dead cell fraction.
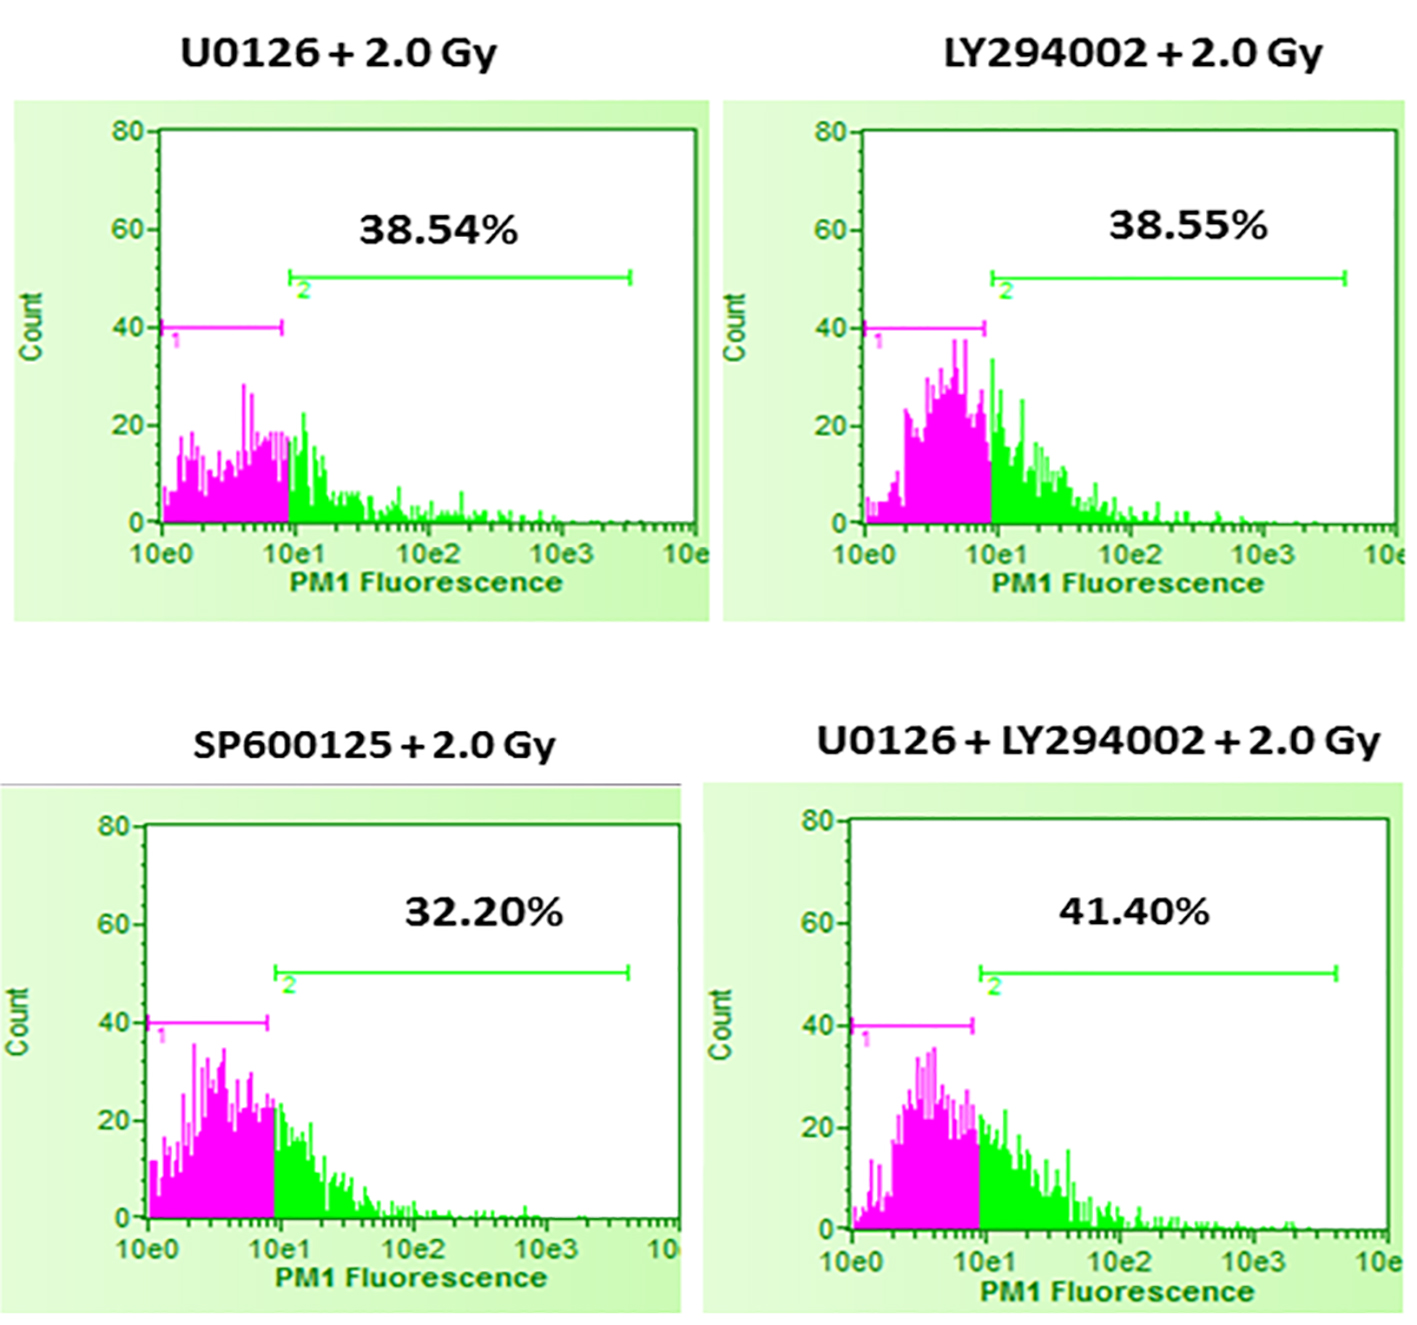
Figure 3. Effect of inhibition of ERK1/2, AKT and JNK pathways prior to 2.0 Gy radiation exposures of B16F10 cells. B16F10 cells were treated with 20 µM concentrations of U0126, LY294002 and SP600125, 24 h before exposing cells to 2.0 Gy of radiation. Pink color indicates viable cell fraction and green color indicates dead cell fraction. Cell death in U0126 + 2.0 Gy group versus 2.0 Gy alone: P < 0.0001; cell death in LY294002 + 2.0 Gy group versus 2.0 Gy alone: P < 0.0001; cell death in SP600125 + 2.0 Gy group versus 2.0 Gy alone: P < 0.01; cell death in U0126 + LY29400 + 2.0 Gy versus 2.0 Gy alone: P < 0.001.
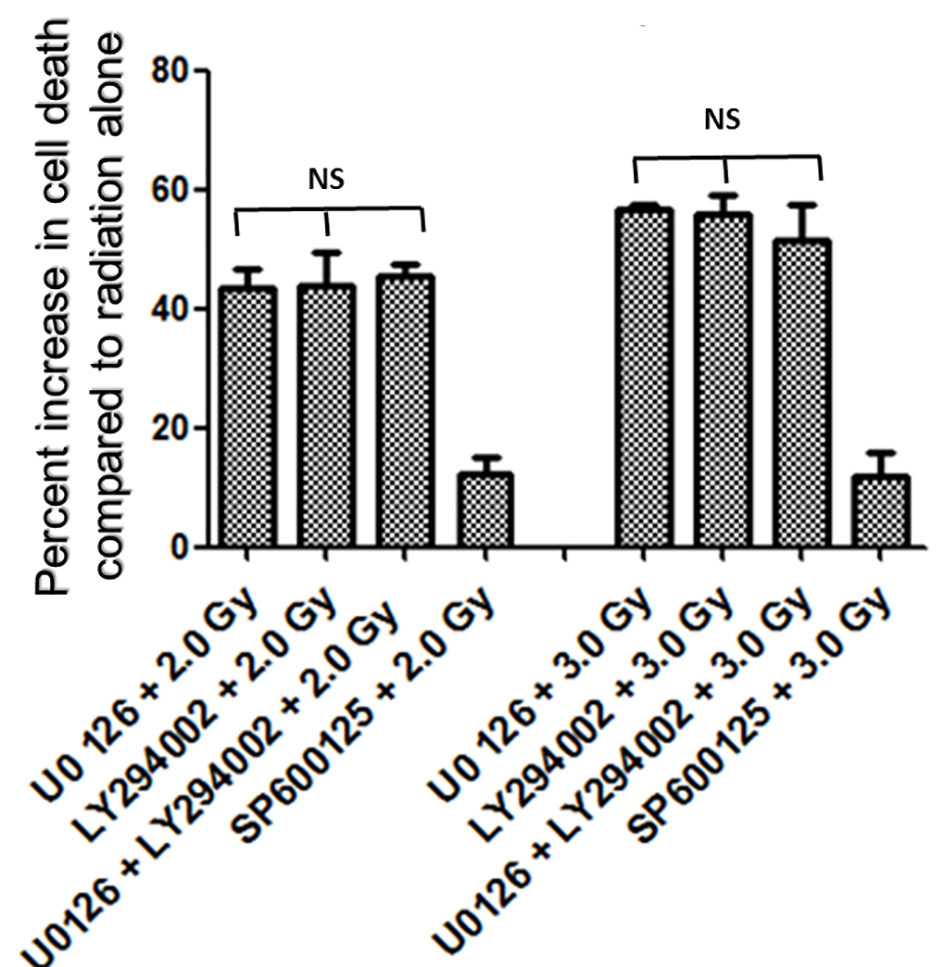
Figure 4. Increase in amount of cell death (%) with inhibitors of ERK1/2, AKT and JNK pathways. Inhibition of either ERK1/2 or AKT pathways enhanced radiation-induced cell death almost equally (about 43% at 2.0 Gy and about 55% at 3.0 Gy), while inhibition of JNK enhanced relatively low amount of cell death (about 12%) at 2.0 Gy as well as at 3.0 Gy. Combined inhibition of U0126 + LY294002 prior to radiation treatment enhanced radiation induced cell death at 2.0 Gy by 45% and at 3.0 Gy by 51%. Overall no significant difference in percent increase in cell death was observed between U0126, LY294002 or their combination both with 2.0 Gy and 3.0 Gy treatments.
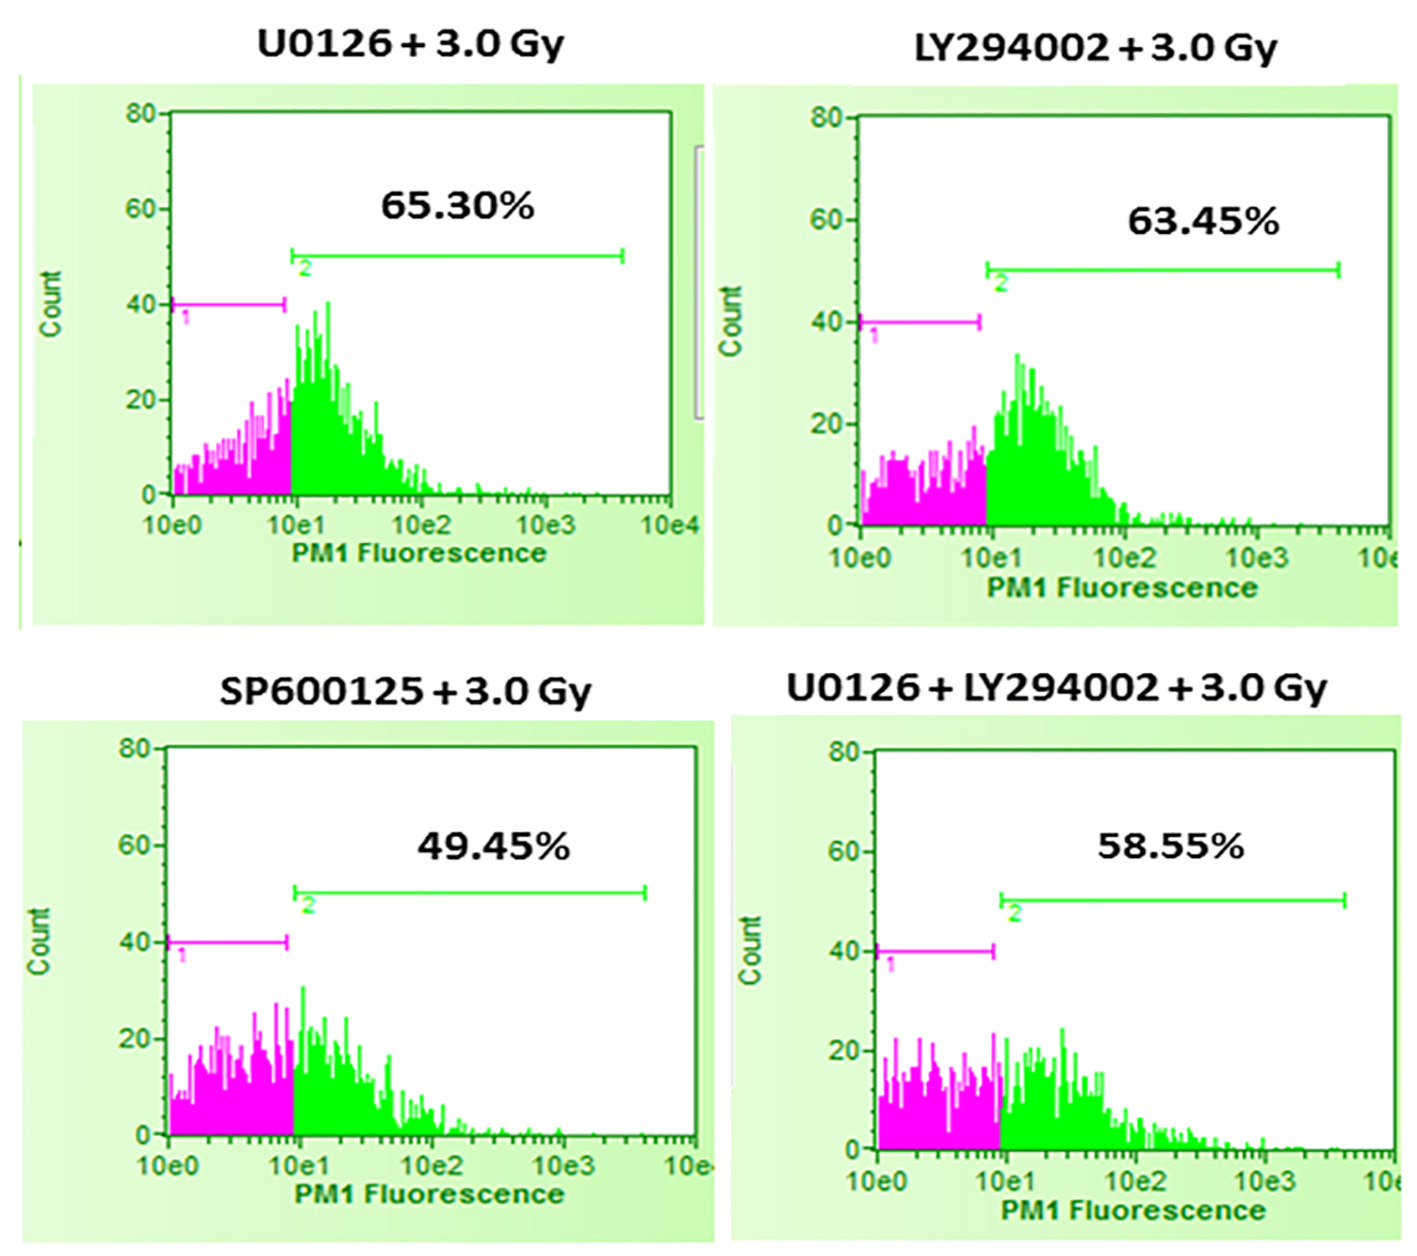
Figure 5. Effect of inhibition of ERK1/2, AKT and JNK pathways prior to 3.0 Gy radiation exposures of B16F10 cells. B16F10 cells were treated with 20 µM concentrations of U0126, LY294002 and SP600125, 24 h before exposing cells to 3.0 Gy of radiation. Pink color indicates viable cell fraction and green color indicates dead cell fraction. Cell death in U0126 + 3.0 Gy group versus 3.0 Gy alone: P < 0.0001; cell death in LY294002 + 3.0 Gy group versus 3.0 Gy alone: P < 0.0001; cell death in SP600125 + 3.0 Gy group versus 3.0 Gy alone: P < 0.01; cell death in U0126 + LY29400 + 3.0 Gy versus 3.0 Gy alone: P < 0.0001.