World Journal of Oncology, ISSN 1920-4531 print, 1920-454X online, Open Access
Article copyright, the authors; Journal compilation copyright, World J Oncol and Elmer Press Inc
Journal website http://www.wjon.org

Original Article

Volume 9, Number 4, August 2018, pages 97-103


Age-Related Chromosomal Aberrations in Patients with Diffuse Large B-Cell Lymphoma: An In Silico Approach

Figures

Figure 1.
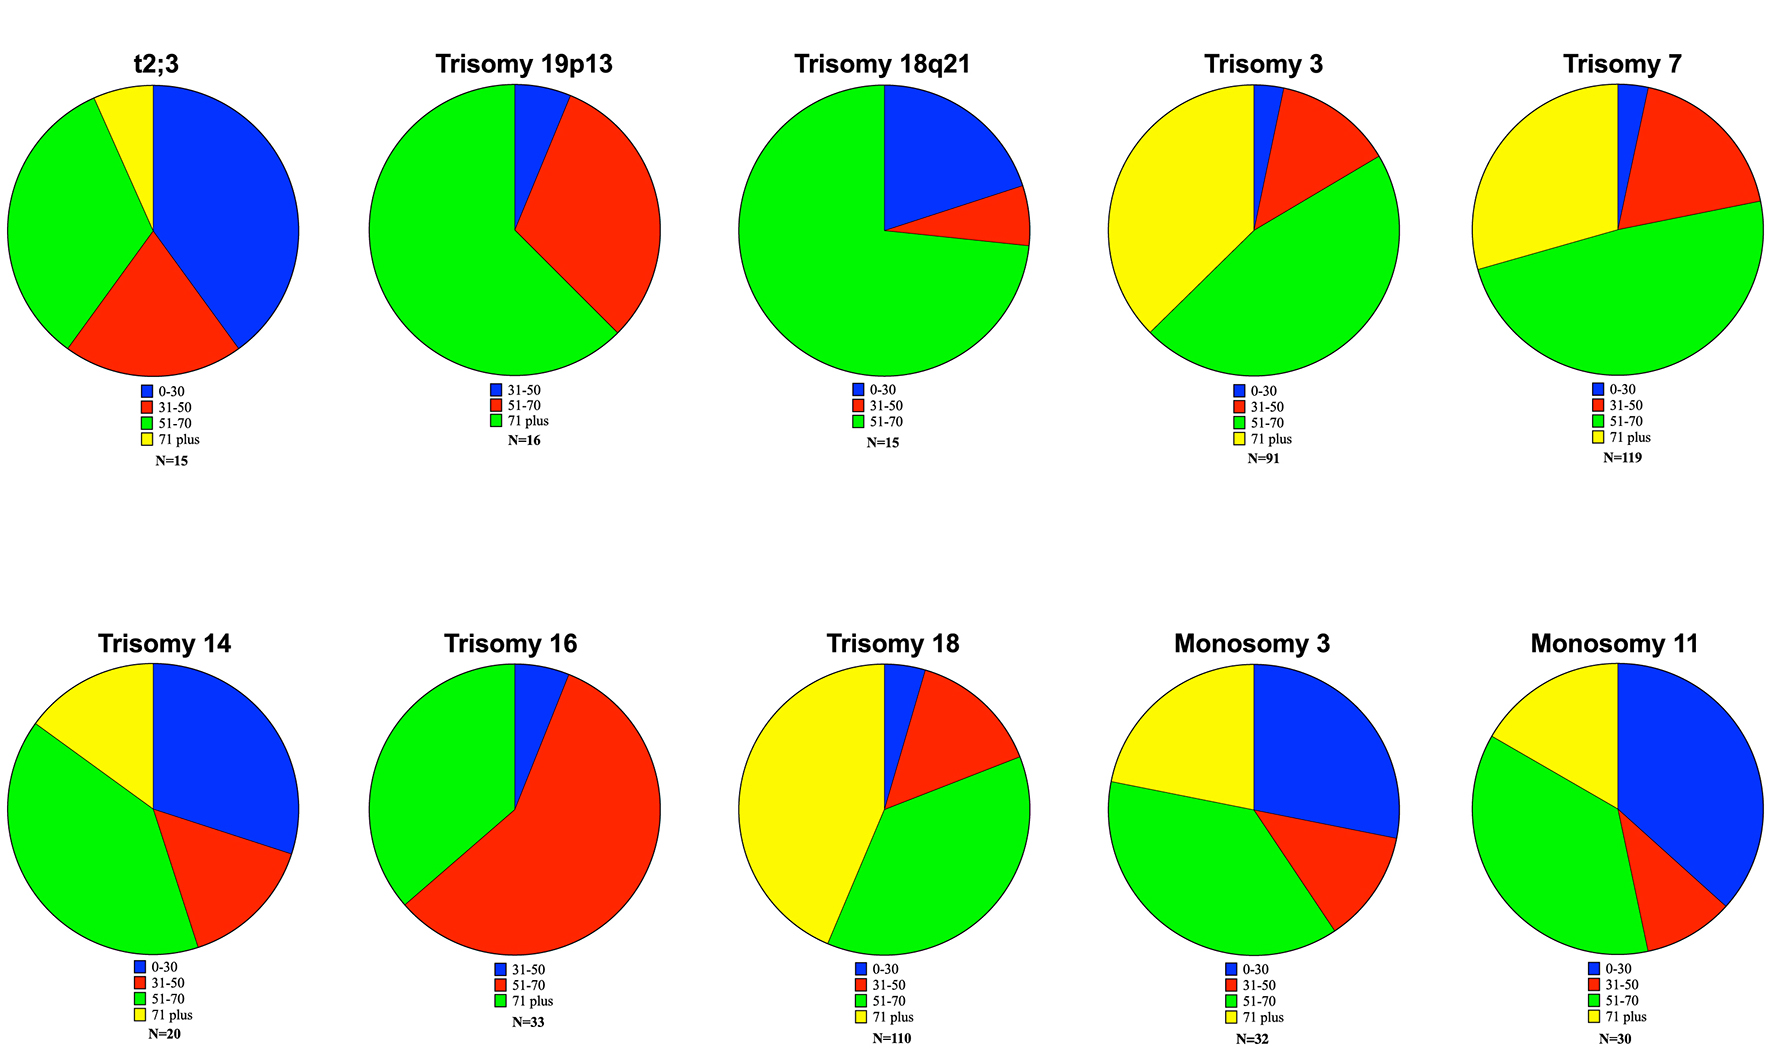
Figure 1. Age-based proportions of significant aberrations. Ten significant data points were obtained. The t(2;3) translocation showed a significant increase in the proportion of patients less than 30. Similar findings were observed in trisomy 14, monosomy 3 and monosomy 11. Older patients (> 71 years) showed increased incidence of the additions of 19p13, 18q21, trisomy 3, trisomy 16 and trisomy 18.
Figure 2.
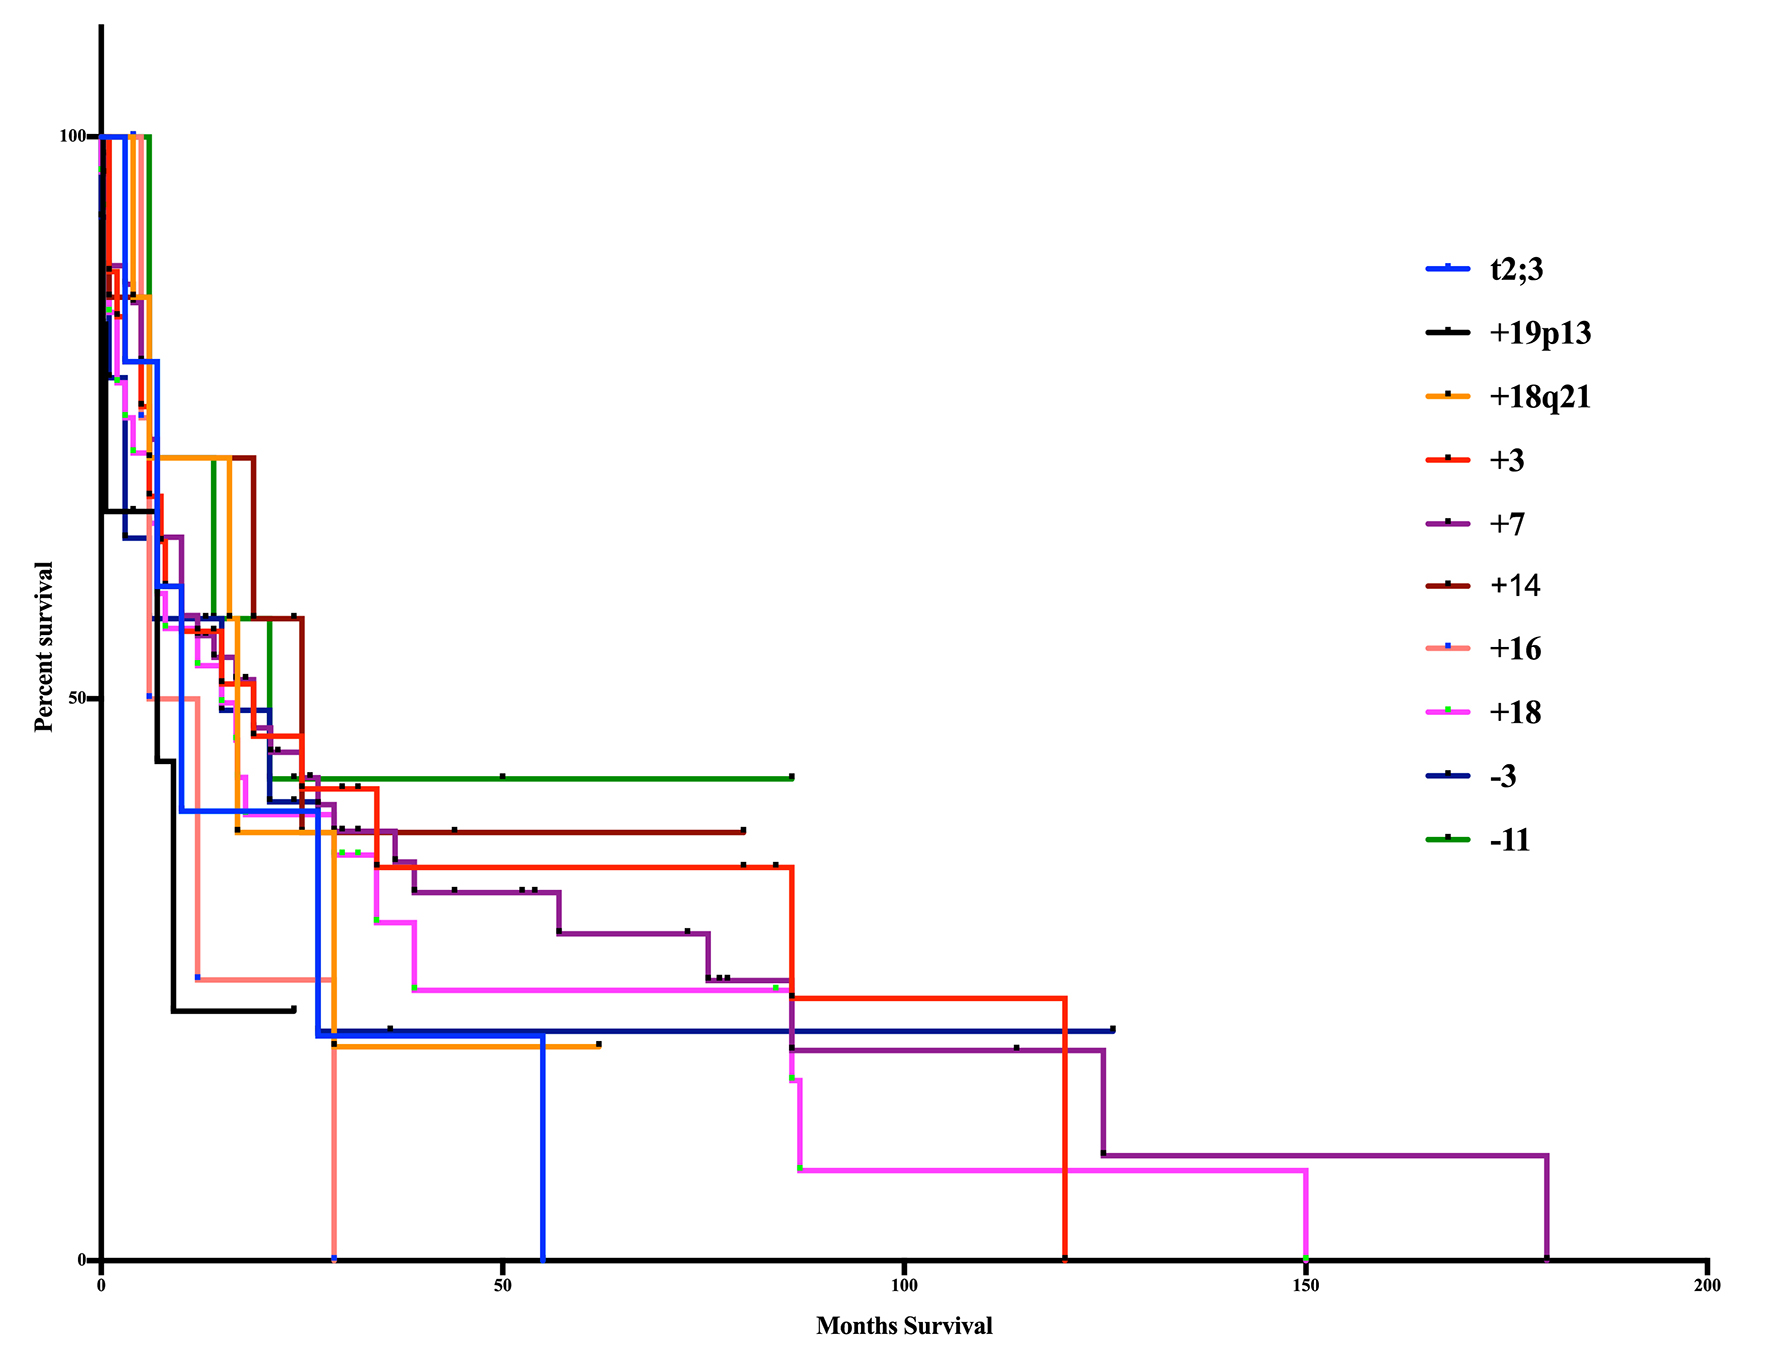
Figure 2. Kaplan-Meier curve of age-based aberrations. The 10 significant aberrations did not show any significant differences from one another (log-rank test, P = 0.7512, Gahen-Breslow-Wilcoxon test, P = 0.8759). The poorest overall survival occurred in patients with the addition of 19p13 (7m) and trisomy 16 (9m). Superior survival occurred in those patients in trisomy 14 (25m), monosomy 11 (21m), trisomy 3 (19m) and trisomy 7 (19m).

Table

Table 1. Overview of Patient Characteristics
 
Overallt2;3Trisomy 19p13Trisomy 18q21Trisomy 3*Trisomy 7Trisomy 14Trisomy 16Trisomy 18Monosomy 3Monosomy 11
In total, 749 DLBCL patients were studied. Of these, there are 391 men and 358 women (male/female ratio: 1.09), with median age of 62 years. Values for chromosome number and karyotype complexity are displayed as mean ± standard deviation. A full summary of patient characteristics is summarized, listed by chromosomal aberrations which were found to be significant. Ten aberrations in total were found to have significant age-related differences. There were no significant differences in sex for each of these aberrations, though trisomy 19p13 showed a male predominance (75% male, P = 0.06). The median year of publication for the dataset was 2000, with a range between 1990 and 2016.
Patients7491516159111920331103230
  Men391812943571117541419
  Women3587464862916551811
Median age (years)62407356676458.568685653
  0 - 3083 (11.1)6 (40)0 (0)3 (20)3 (3.3)4 (3.4)6 (30)0 (0)5 (4.5)9 (28.1)11 (36.7)
  31 - 50118 (15.8)3 (20)1 (6.3)1 (6.7)12 (13.2)22 (18.5)3 (15)2 (6.1)16 (14.5)4 (12.5)3 (10)
  51 – 70346 (46.2)5 (33.3)5 (31.3)11 (73.3)42 (46.2)58 (48.7)8 (40)19 (57.6)41 (37.3)12 (37.5)11 (36.7)
  71 and over203 (27.1)1 (6.7)10 (62.5)0 (0)34 (37.4)35 (29.4)3 (15)12 (36.4)48 (43.6)7 (21.9)5 (16.7)
Chromosome number (mean)59.8 ± 17.847.3 ± 1.968.7 ± 19.246.5 ± 3.555.4 ± 15.061.5 ± 15.862.5 ± 17.671.8 ± 17.856.3 ± 16.968.9 ± 16.874.2 ± 18.7
Karyotype Complexity8.6 ± 6.411.1± 7.313.5 ± 10.310.7 ± 7.210.3 ± 5.511.7 ± 7.112.8 ± 7.512.5 ± 7.610.8 ± 7.317.3 ± 7.318.8 ± 9.1
Median year of publication20002004200620041999200419991999199920042003
  Median survival (months)14107171919259151521
  P value-0.0020.010.040.020.030.050.05< 0.0010.02< 0.001