World Journal of Oncology, ISSN 1920-4531 print, 1920-454X online, Open Access
Article copyright, the authors; Journal compilation copyright, World J Oncol and Elmer Press Inc
Journal website http://www.wjon.org

Original Article

Volume 10, Number 3, June 2019, pages 132-141


Effects of p53 Status of Tumor Cells and Combined Treatment With Mild Hyperthermia, Wortmannin or Caffeine on Recovery From Radiation-Induced Damage

Figures

Figure 1.
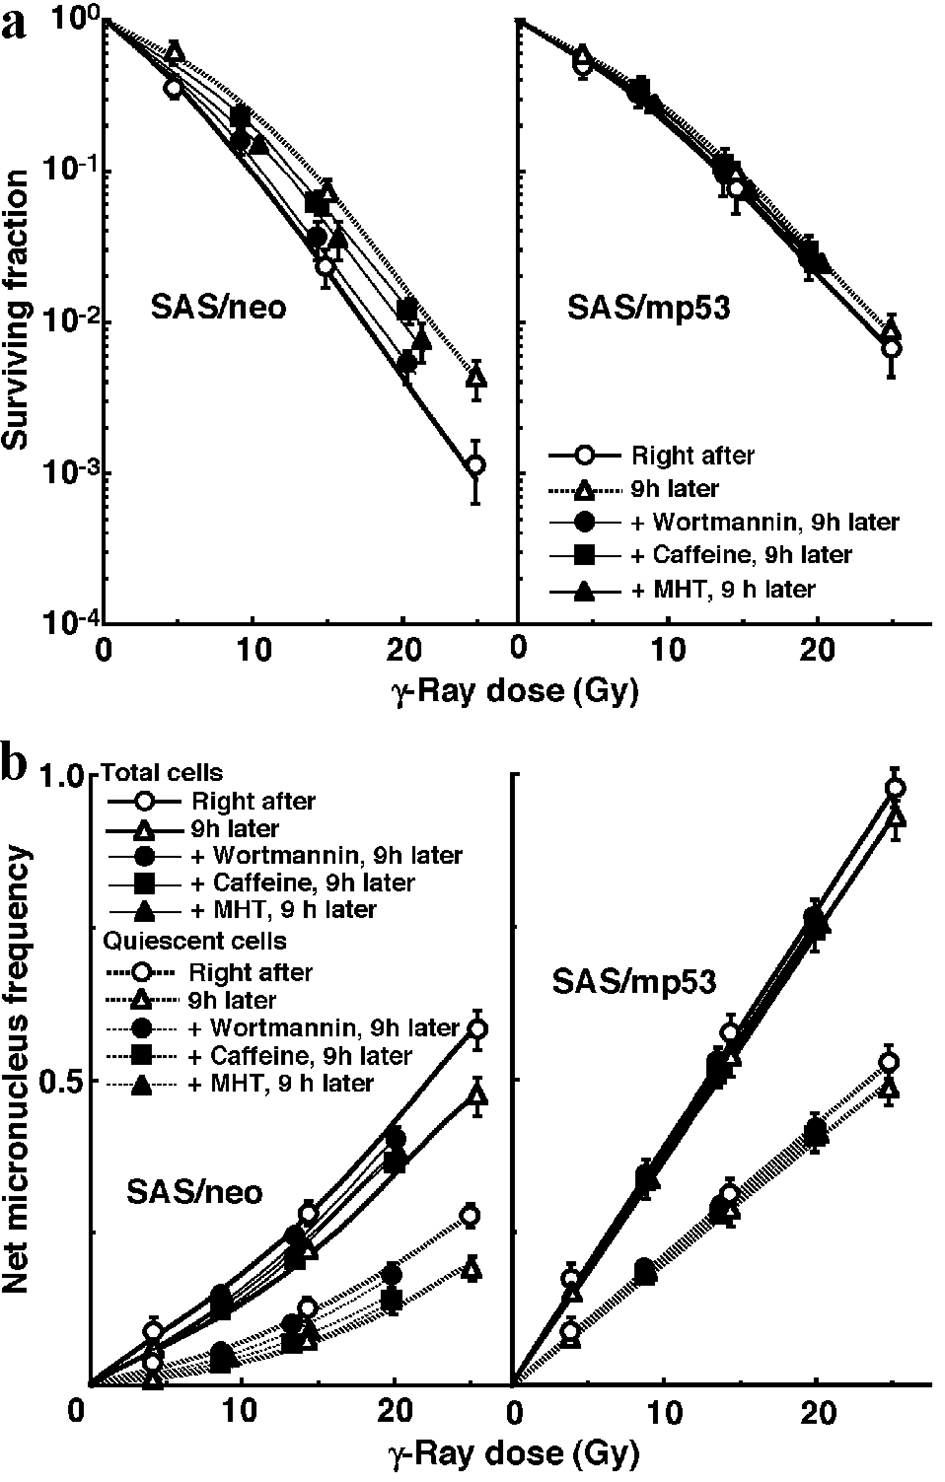
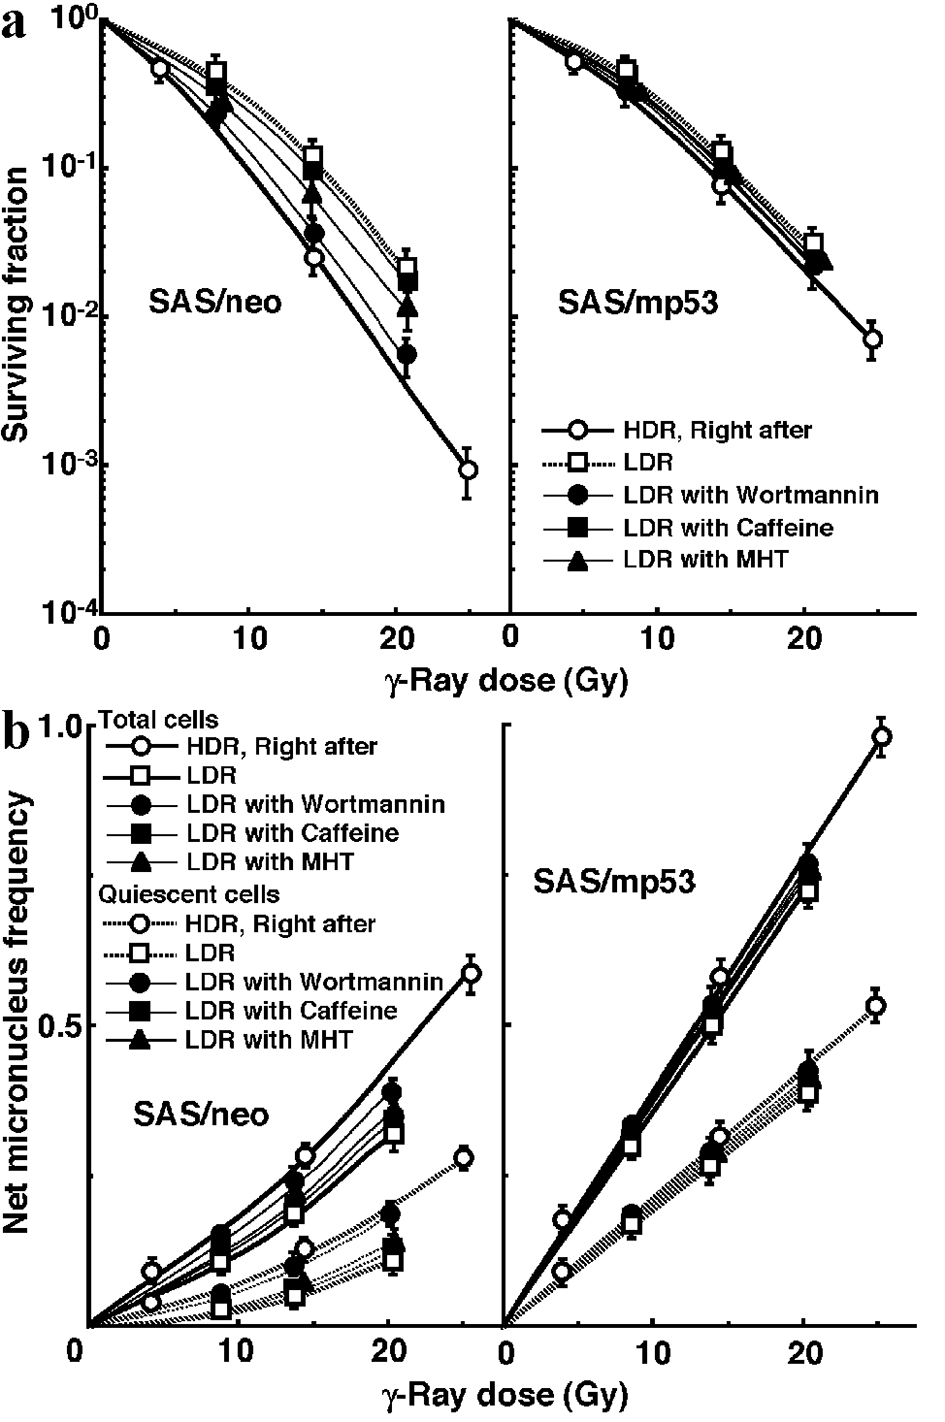
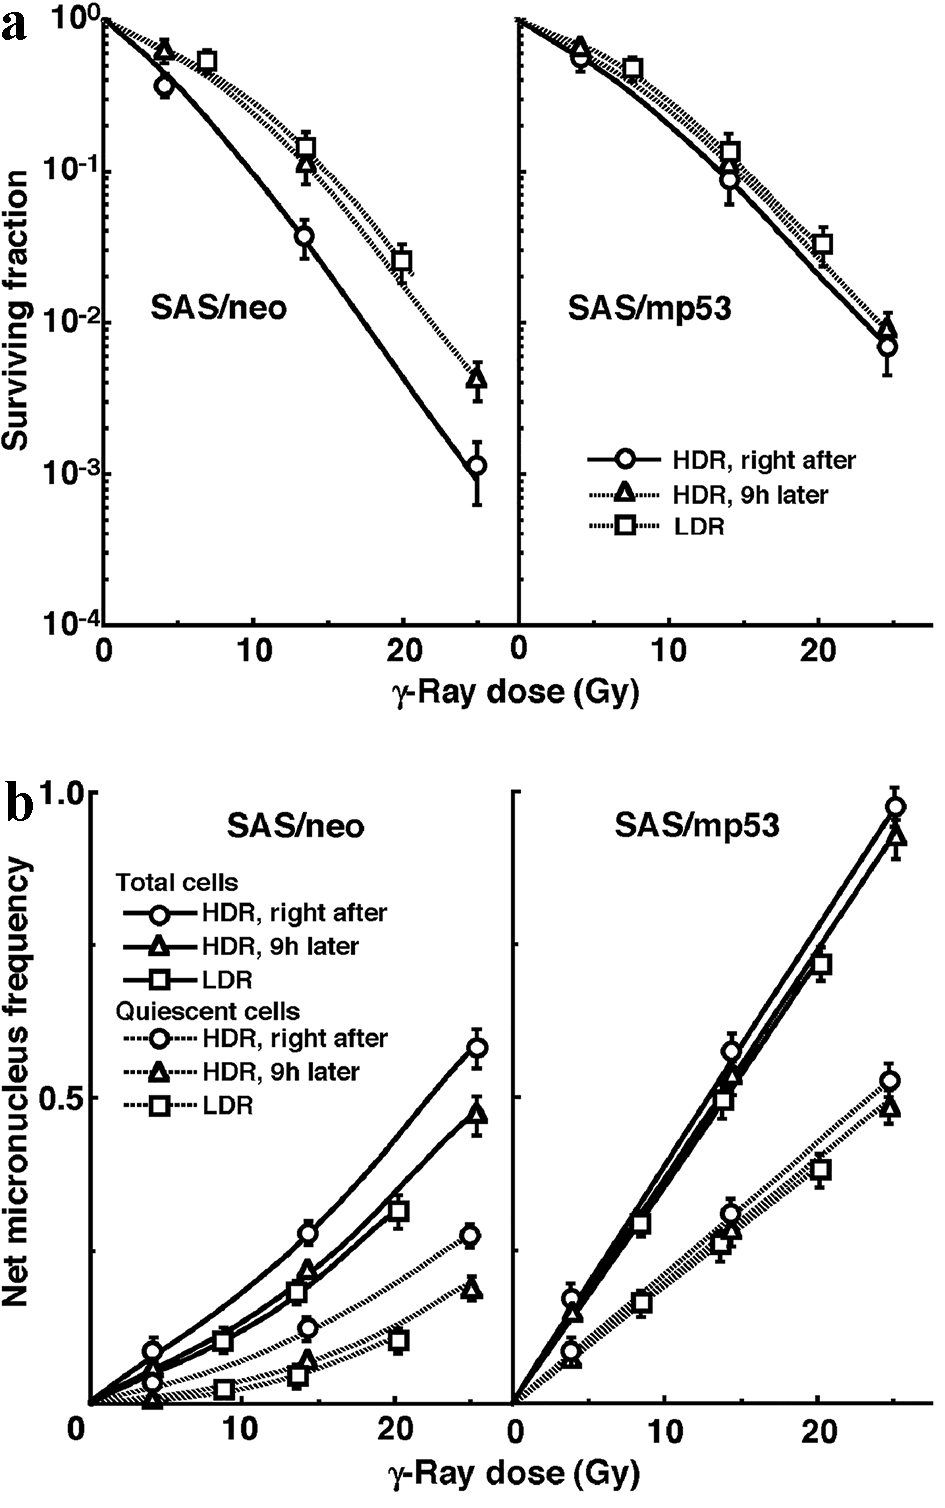
Figure 1. A marked reduction in sensitivity of SAS/neo tumor cells, especially quiescent tumor cells, compared with SAS/mp53 tumor cells with little recovery capacity. The clonogenic cell survival curves for total tumor cells and the net micronucleus frequencies for total and quiescent tumor cells immediately and 9 h after γ-ray irradiation with high dose-rate irradiation (HDR) and immediately after γ-ray irradiation with low dose-rate irradiation (LDR) are shown in (a) and (b), respectively. The left and right panels show SAS/neo and SAS/mp53 tumor cells, respectively. Bars represent 95% confidence limits. Three mice were used to assess each set of conditions and each experiment was repeated twice.
Figure 2.
Figure 2. Mild hyperthermia efficiently suppressed the reduction in sensitivity caused by leaving an interval between high dose-rate irradiation (HDR) and the assay in both total and quiescent cells within SAS/neo tumors, as well as wortmannin administration. The clonogenic cell survival curves for total tumor cells and the net micronucleus frequencies for total and quiescent tumor cells immediately after and 9 h after γ-ray irradiation with HDR immediately followed by mild hyperthermia, the administration of caffeine, that of wortmannin, or no treatment are shown in (a) and (b), respectively. The left and right panels show SAS/neo and SAS/mp53 tumor cells, respectively. Bars represent 95% confidence limits. Three mice were used to assess each set of conditions and each experiment was repeated twice.
Figure 3.
Figure 3. Mild hyperthermia efficiently suppressed the reduction in sensitivity caused by decreasing the irradiation dose rate in both total and quiescent cells within SAS/neo tumors, as well as wortmannin administration. The clonogenic cell survival curves for total tumor cell populations and the net micronucleus frequencies for total and quiescent cell populations immediately after γ-ray irradiation with high dose-rate irradiation (HDR) and after γ-ray irradiation with low dose-rate irradiation (LDR) in simultaneous combination with mild temperature hyperthermia, the administration of caffeine or wortmannin, or no treatment are shown in (a) and (b), respectively. The left and right panels show SAS/neo and SAS/mp53 tumor cells, respectively. Bars represent 95% confidence limits. Three mice were used to assess each set of conditions and each experiment was repeated twice.

Tables

Table 1. Plating Efficiencies and Micronucleus Frequencies at 0 Gy
 
TreatmentSAS/neoSAS/mp53
aNumbers in parentheses are 95% confidence limits, determined using mean values, standard deviations and the numbers of observations on which the means and standard deviations were based. The difference between the values for SAS/neo and SAS/mp53 is statistically significant under each set of condition (P < 0.05). MHT: mild hyperthermia.
Plating efficiency (%)
  Total tumor cells
    None48.4 (39.3 - 57.5)a28.5 (22.4 - 34.6)
    MHT43.2 (39.3 - 47.1)20.9 (18.0 - 23.8)
    Caffeine28.3 (24.3 - 32.3)17.9 (14.9 - 20.9)
    Wortmannin28.6 (25.3 - 31.9)18.1 (15.6 - 20.6)
Micronucleus frequency
  Total tumor cells
    None0.038 (0.032 - 0.044)0.072 (0.064 - 0.080)
    MHT0.050 (0.045 - 0.055)0.075 (0.068 - 0.082)
    Caffeine0.088 (0.079 - 0.097)0.137 (0.127 - 0.147)
    Wortmannin0.086 (0.078 - 0.094)0.136 (0.120 - 0.152)
  Quiescent tumor cells
    None0.056 (0.049 - 0.063)0.10 (0.09 - 0.11)
    MTH0.059 (0.053 - 0.065)0.10 (0.09 - 0.11)
    Caffeine0.114 (0.105 - 0.122)0.177 (0.164 - 0.190)
    Wortmannin0.116 (0.103 - 0.129)0.181 (0.161 - 0.201)


Table 2. Dose-Modifying Factors by Recoverya
 
SAS/neoSAS/mp53
aThe dose of radiation required to obtain each endpoint with each treatment in relation to that required to obtain each endpoint immediately after HDR. bNumbers in parentheses are 95% confidence limits, determined using mean values, standard deviations and the numbers of observations on which the means and standard deviations were based. Except for the conditions using treatment with wortmannin, the difference between the values for SAS/neo and SAS/mp53 is statistically significant under each set of condition (P < 0.05). HDR: high dose-rate irradiation; MHT: mild hyperthermia; WM: wortmannin; CAF: caffeine; LDR: low dose-rate irradiation.
Surviving fraction = 0.04
  Total tumor cells
    Right after HDR1.01.0
    9 h after HDR1.3 (1.2 - 1.4)b1.05 (1.0 - 1.1)
    MHT right after HDR, 9 h later1.2 (1.1 - 1.3)1.04 (1.01 - 1.07)
    WM right after HDR, 9 h later1.05 (1.0 - 1.1)1.02 (1.0 - 1.05)
    CAF right after HDR, 9 h later1.25 (1.2 - 1.3)1.05 (1.0 - 1.1)
    After LDR1.4 (1.3 - 1.5)1.1 (1.0 - 1.1)
    LDR with MHT1.25 (1.2 - 1.3)1.06 (1.04 - 1.08)
    LDR with WM1.05 (1.0 - 1.1)1.05 (1.0 - 1.1)
    LDR with CAF1.35 (1.3 - 1.4)1.07 (1.05 - 1.1)
Net micronucleus frequency = 0.1
  Total tumor cells
    Right after HDR1.01.0
    9 h after HDR1.25 (1.3 - 1.4)1.05 (1.0 - 1.1)
    MHT right after HDR, 9 h later1.2 (1.1 - 1.3)1.04 (1.0 - 1.08)
    WM right after HDR, 9 h later1.1 (1.0 - 1.2)1.03 (1.0 - 1.05)
    CAF right after HDR, 9 h later1.25 (1.2 - 1.3)1.05 (1.0 - 1.1)
    After LDR1.3 (1.2 - 1.4)1.1 (1.0 - 1.2)
    LDR with MHT1.25 (1.2 - 1.3)1.06 (1.04 - 1.08)
    LDR with WM1.1 (1.0 - 1.2)1.03 (1.0 - 1.05)
    LDR with CAF1.3 (1.2 - 1.4)1.07 (1.05 - 1.1)
  Quiescent tumor cells
    Right after HDR1.01.0
    9 h after HDR1.5 (1.4 - 1.6)1.07 (1.05 - 1.1)
    MHT right after HDR, 9 h later1.25 (1.2 - 1.3)1.05 (1.0 - 1.1)
    WM right after HDR, 9 h later1.1 (1.0 - 1.2)1.02 (1.0 - 1.05)
    CAF right after HDR, 9 h later1.35 (1.3 - 1.4)1.07 (1.04 - 1.1)
    After LDR1.65 (1.6 - 1.7)1.15 (1.1 - 1.2)
    LDR with MHT1.3 (1.2 - 1.4)1.07 (1.04 - 1.1)
    LDR with WM1.1 (1.0 - 1.2)1.02 (1.0 - 1.05)
    LDR with CAF1.45 (1.4 - 1.5)1.1 (1.0 - 1.1)


Table 3. Dose Ratiosa for Quiescent Tumor Cells Relative to the Total Tumor Cell Population
 
SAS/neoSAS/mp53
aThe dose of radiation required to obtain a net micronucleus frequency of 0.1 in quiescent tumor cells in relation to that required to obtain a net micronucleus frequency of 0.1 in the total tumor cell population. bNumbers in parentheses are 95% confidence limits, determined using mean values, standard deviations and the numbers of observations on which the means and standard deviations were based. The difference between the values for SAS/neo and SAS/mp53 is statistically significant under each set of condition (P < 0.05). HDR: high dose-rate irradiation; MHT: mild hyperthermia; WM: wortmannin; CAF: caffeine; LDR: low dose-rate irradiation.
Net micronucleus frequency = 0.1
  Right after HDR2.2 (2.1 - 2.3)b1.9 (1.8 - 2.0)
  9 h after HDR2.35 (2.25 - 2.45)1.95 (1.85 - 2.05)
  MHT right after HDR, 9 h later2.2 (2.1 - 2.3)1.9 (1.8 - 2.0)
  WM right after HDR, 9 h later2.1 (2.0 - 2.2)1.85 (1.75 - 1.95)
  CAF right after HDR, 9 h later2.3 (2.2 - 2.4)1.9 (1.8 - 2.0)
  After LDR2.35 (2.25 - 2.45)1.95 (1.85 - 2.05)
  LDR with MHT2.2 (2.1 - 2.3)1.9 (1.8 - 2.0)
  LDR with WM2.1 (2.0 - 2.2)1.85 (1.75 - 1.95)
  LDR with CAF2.3 (2.2 - 2.4)1.9 (1.8 - 2.0)