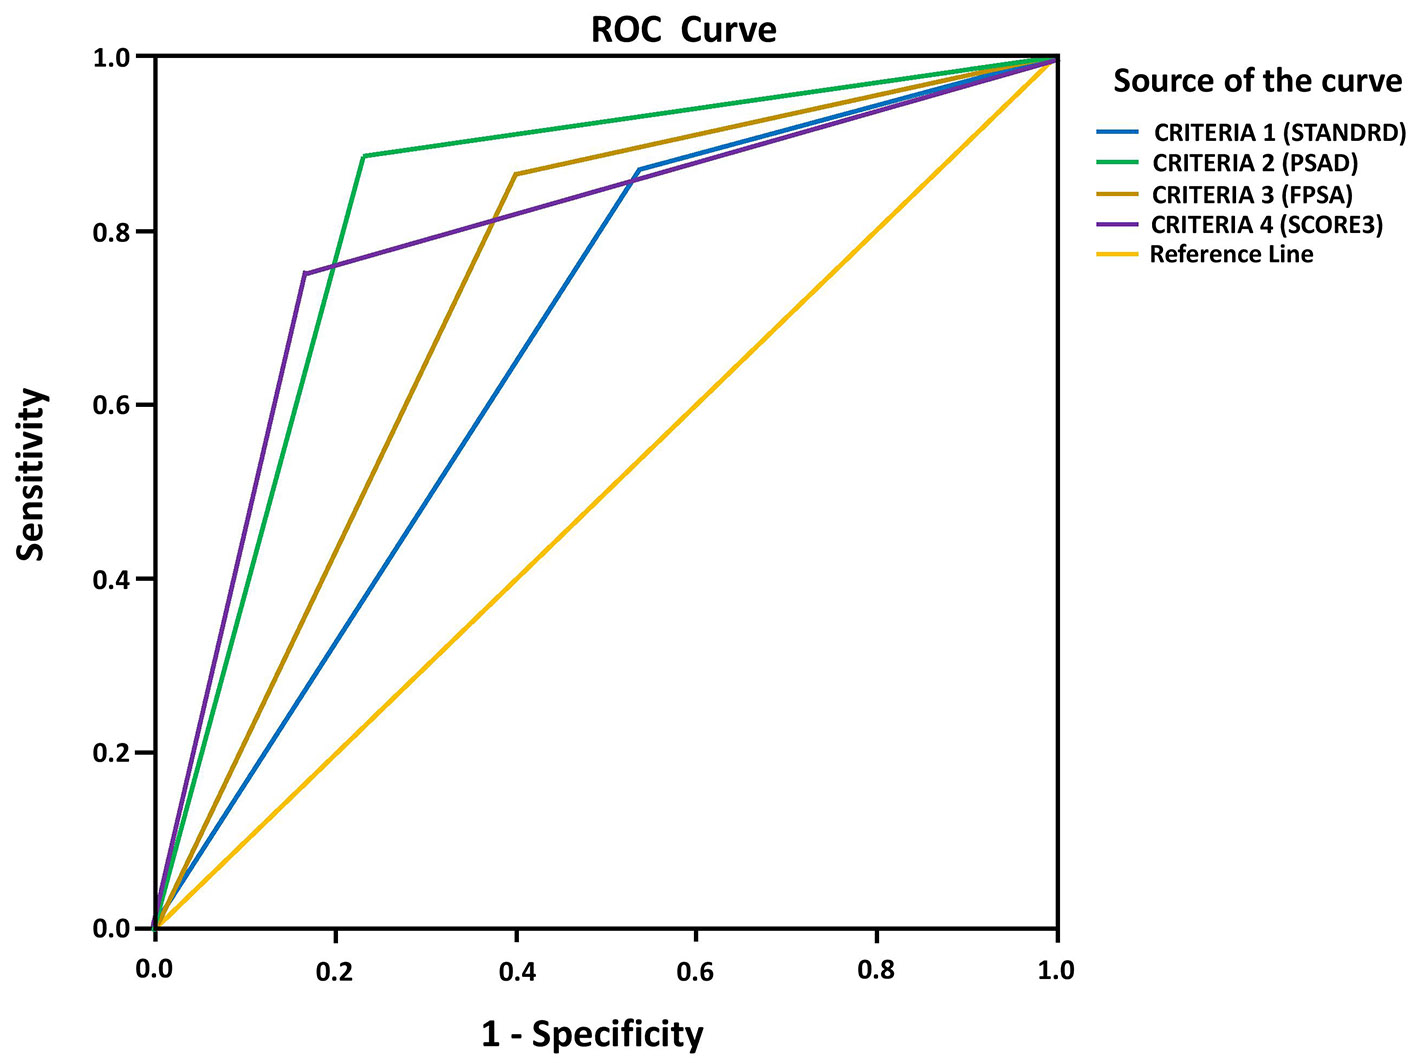
Figure 1. ROC curve analysis of PIRADS score criteria to determine CSPCa. ROC: receiver operating characteristic; PIRADS: Prostate Imaging Reporting and Data System; CSPCa: clinically significant prostate cancer.
| World Journal of Oncology, ISSN 1920-4531 print, 1920-454X online, Open Access |
| Article copyright, the authors; Journal compilation copyright, World J Oncol and Elmer Press Inc |
| Journal website http://www.wjon.org |
Original Article
Volume 10, Number 6, December 2019, pages 218-225
Combining Prostate-Specific Antigen Parameters With Prostate Imaging Reporting and Data System Score Version 2.0 to Improve Its Diagnostic Accuracy
Figure
Tables
| Characteristics | Patients with suspected PCa (n = 104) | Patients with PCa (n = 64) | Patients with BPH (n = 40) | P value* |
|---|---|---|---|---|
| Data shown as median (interquartile range), range. Unless otherwise specified. *Comparison between patients with PCa and patients with BPH. BPH: benign prostatic hyperplasia; DRE: digital rectal examination; PCa: prostate cancer; PSA: prostate-specific antigen; PSAD: prostate-specific antigen density; TRUS: transrectal ultrasound; USG: ultrasound sonography. | ||||
| Age (years) | 68 (60.25 - 71) 45 - 85 | 68 (62 - 71) | 65.5 (54.25 - 70) | 0.009 |
| PSA level (ng/mL) | 8.15 (6.4 - 9.7) 4.1 - 10 | 9.05 (7.73 - 9.9) | 6.4 (5.5 - 7.8) | < 0.001 |
| Prostate volume (mL) | 60 (44 - 75) 27 - 123 | 50 (43.25 - 60.75) | 75 (56.75 - 94) | < 0.001 |
| PSAD (ng/mL2) | 0.13 (0.09 - 0.18) 0.05 - 0.27 | 0.16 (0.13 - 0.21) | 0.09 (0.08 - 0.11) | < 0.001 |
| Free/total PSA ratio (%) | 21.5 (14.52 - 29.92) 5.5 - 44 | 16.75 (12.58-23) | 30 (23.75 - 35) | < 0.001 |
| Suspicious DRE, n (%) | 17 (16.3) | 12 (18.8) | 5 (12.5) | 0.402 |
| Hypoechoic lesion in TRUS/USG, n (%) | 5 (4.8) | 5 (7.8) | 0 (0) | 0.070 |
| Variables | CSPCa group (n = 44) | Non-CSPCa group (n = 60) | P value |
|---|---|---|---|
| Data shown as median (interquartile range), range. Unless otherwise specified. CSPCa: clinically significant PCa; BPH: benign prostatic hyperplasia; DRE: digital rectal examination; PCa: prostatic cancer; PSA: prostate-specific antigen; PSAD: prostate-specific antigen density; TRUS: transrectal ultrasound; USG: ultrasound sonography. | |||
| Age (years) | 70 (63.25 - 73.75) | 66 (59 - 70) | 0.001 |
| PSA level (ng/mL) | 9.6 (8.43 - 10) | 6.95 (5.5 - 8.4) | < 0.001 |
| Prostate volume (mL) | 44.5 (40.25 - 59.15) | 70 (56 - 89.75) | < 0.001 |
| PSAD (ng/mL2) | 0.20 (0.16 - 0.22) | 0.10 (0.08 - 0.12) | < 0.001 |
| Free/total PSA ratio (%) | 14.25 (11.08 - 18.73) | 28 (21.25 - 33) | < 0.001 |
| DRE positive, n (%) | 7 (15.9) | 10 (16.7) | 0.918 |
| USG/TRUS positive, n (%) | 4 (9.1) | 1 (1.7) | 0.080 |
| Multiparametric MRI results | CSPCa group (n = 44) | Non-CSPCa group (n = 60) | P value |
|---|---|---|---|
| Data shown as n (%). *PIRADS score 3, 4 or 5 is considered as a positive test. CSPCa: clinically significant prostate cancer; BPH: benign prostatic hyperplasia; PIRAD: Prostate Imaging Reporting and Data System; MRI: magnetic resonance imaging. | |||
| PIRADS (+)* | 38 (86.4) | 32 (53.3) | < 0.001 |
| PIRADS score 1 | 2 (4.5) | 7 (11.7) | < 0.001 |
| PIRADS score 2 | 3 (6.8) | 21 (35) | |
| PIRADS score 3 | 6 (13.6) | 22 (36.7) | |
| PIRADS score 4 | 11 (25) | 7 (11.7) | |
| PIRADS score 5 | 22 (50) | 3 (5) | |
| Parameters | AUC of ROC curve | 95% confidence interval | P value |
|---|---|---|---|
| AUC: area under the ROC curve; PCa: prostatic cancer; DRE: digital rectal examination; PIRADS: Prostate Imaging Reporting and Data System; PSA: prostate-specific antigen; PSAD: prostate-specific antigen density; ROC: receiver operating characteristic; TRUS: transrectal ultrasound; USG: ultrasound sonography. | |||
| Age | 0.684 | 0.582 - 0.785 | 0.001 |
| DRE | 0.496 | 0.383 - 0.609 | 0.948 |
| USG/TRUS | 0.537 | 0.423 - 0.651 | 0.519 |
| Serum PSA | 0.827 | 0.744 - 0.909 | < 0.001 |
| Prostate volume | 0.830 | 0.753 - 0.907 | < 0.001 |
| PSAD | 0.968 | 0.941 - 0.996 | < 0.001 |
| Free/total PSA ratio (%) | 0.855 | 0.776 - 0.935 | < 0.001 |
| PIRADS score V2 | 0.822 | 0.734 - 0.909 | < 0.001 |
| Parameters | Odds ratio (95% CI) | P value |
|---|---|---|
| PCa: prostatic cancer; DRE: digital rectal examination; PIRADS: Prostate Imaging Reporting and Data System; PSA: prostate-specific antigen; PSAD: prostate-specific antigen density; TRUS: transrectal ultrasound; USG: ultrasound sonography. | ||
| Age | ||
| Univariate | 1.101 (1.038 - 1.67) | 0.001 |
| Multivariate | 1.157 (1.008 - 1.327) | 0.038 |
| DRE (+) | 0.946 (0.329 - 2.717) | 0.918 |
| TRUS/USG (+) | 0.169 (0.018 - 1.573) | 0.118 |
| Prostate volume | 0.916 (0.882 - 0.950) | < 0.001 |
| Serum PSA | ||
| Univariate | 1.929 (1.442 - 2.580) | < 0.001 |
| Multivariate | 0.930 (0.571 - 1.515) | 0.772 |
| PSAD | ||
| Univariate | 2.090 (1.559 - 2.802) | < 0.001 |
| Multivariate | 2.033 (1.466 - 2.819) | < 0.001 |
| Free/total PSA ratio (%) | ||
| Univariate | 0.843 (0.787 - 0.902) | < 0.001 |
| Multivariate | 0.939 (0.846 - 1.043) | 0.243 |
| PIRADS V2 | 5.542 (2.04 - 15.053) | 0.001 |
| Criteria | Postive test | Negative test | Remarks |
|---|---|---|---|
| PIRADS: Prostate Imaging Reporting and Data System; fPSA: free/total PSA ratio; PSA: prostate-specific antigen; PSAD: prostate-specific antigen density. | |||
| 1 | Score 3,4 or 5 | Score 1 or 2 | Standard |
| 2 | Score 4, 5 or (3+ PSAD > 0.12 ng/mL2) | Score 1, 2 or (3+ PSAD ≤ 0.12 ng/mL2 ) | Combining present study cut-off of PSAD with score 3 |
| 3 | Score 4, 5 or (3+ fPSA ≤ 25.5%) | Score 1, 2 or (3+ fPSA > 25.5%) | Combining present study cut-off of fPSA with score 3 |
| 4 | Score 4 or 5 | Score 1, 2 or 3 | Score 3 taken as a negative test due to high rate of false positive in this study when score 3 is taken as positive. |
| Clinical group | Clinically significant PCa with PIRADS scoring | |||
|---|---|---|---|---|
| Criteria 1 | Criteria 2 | Criteria 3 | Criteria 4 | |
| Data shown as percentage (95% CI). CI: confidence interval; fPSA: free/total prostate specific antigen ratio; PCa: prostate cancer; PIRADS: Prostate Imaging Reporting and Data System; PSAD: prostate-specific antigen density; CSPCa: clinically significant prostate cancer. | ||||
| Sensitivity | 88.64 (75.44 - 96.21) | 85.19 (72.88 - 93.38) | 82.81 (71.32 - 91.10) | 75.00 (59.66 - 86.81) |
| Specificity | 46.67 (33.67 - 60.00) | 86.00 (73.26 - 94.18) | 77.50 (61.55 - 89.16) | 83.33 (71.48 - 91.71) |
| Positive likelihood ratio | 1.66 (1.28 - 2.15) | 6.08 (3.03 - 12.20) | 3.68 (2.05 - 6.61) | 4.50 (2.49 - 8.13) |
| Negative likelihood ratio | 0.24 (0.10 - 0.58) | 0.17 (0.09 - 0.33) | 0.22 (0.13 - 0.39) | 0.30 (0.18 - 0.51) |
| Disease prevalence | 42.31 (32.68 - 52.39) | 42.31 (32.68 - 52.39) | 42.31 (32.68 - 52.39) | 42.31 (32.68 - 52.39) |
| Positive predictive value | 54.93 (48.46 - 61.23) | 86.79 (76.62 - 92.95) | 85.48 (76.62 - 91.36) | 76.74 (64.63 - 85.63) |
| Negative predictive value | 84.85 (70.15 - 93.03) | 84.31 (73.74 - 91.14) | 73.81 (61.61 - 83.19) | 81.97 (72.91 - 88.48) |
| Accuracy | 64.42 (54.43 - 73.57) | 85.58 (77.33 - 91.70) | 80.77 (71.87 - 87.84) | 79.81 (70.81 - 87.04) |
| PIRADS score criteria | AUC of ROC curve | P value | 95% confidence interval | |
|---|---|---|---|---|
| Lower bound | Upper bound | |||
| AUC: area under the ROC curve; PIRADS: Prostate Imaging Reporting and Data System; ROC: receiver operating characteristic. | ||||
| Criteria 1 | 0.665 | 0.004 | 0.561 | 0.769 |
| Criteria 2 | 0.827 | < 0.001 | 0.743 | 0.910 |
| Criteria 3 | 0.732 | < 0.001 | 0.634 | 0.829 |
| Criteria 4 | 0.792 | < 0.001 | 0.699 | 0.884 |