Figures
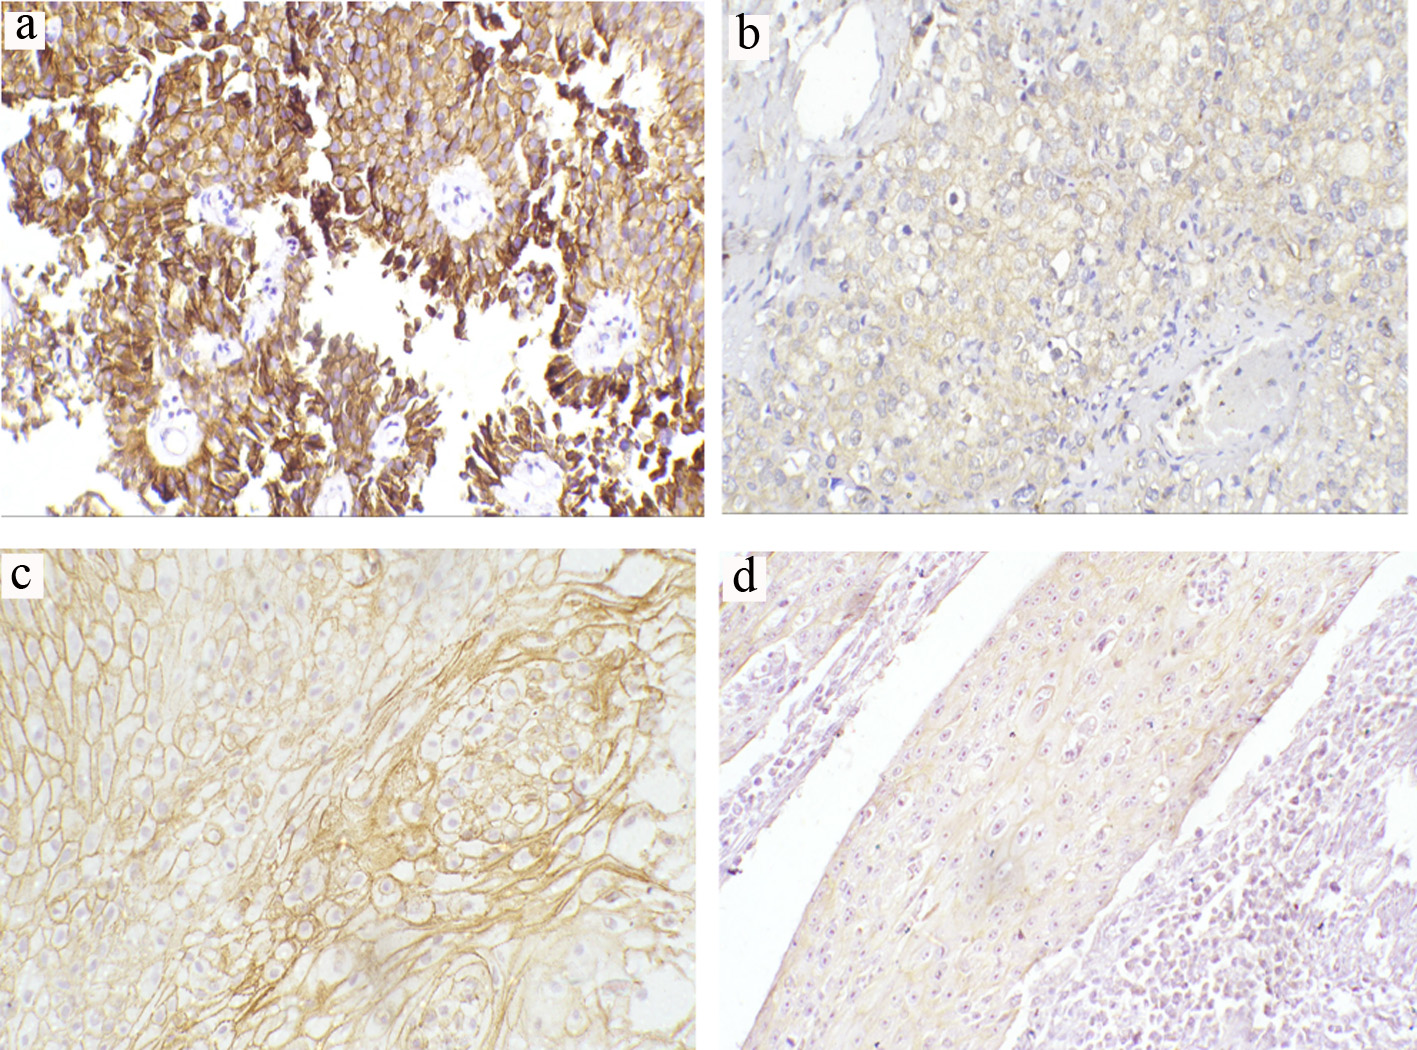
Figure 1. Representative immunohistochemical staining of E-cadherin in TCCs and SCCs (a-d) (magnification × 200). (a) Preserved normal positive membranous expression in low-grade non-muscle-invasive TCC. (b) Reduced membranous expression in high-grade invasive TCC. (c) Preserved normal positive membranous expression in moderately differentiated SCC. (d) Reduced membranous expression in poorly differentiated SCC. TCC: transitional cell carcinoma; SCC: squamous cell carcinoma.
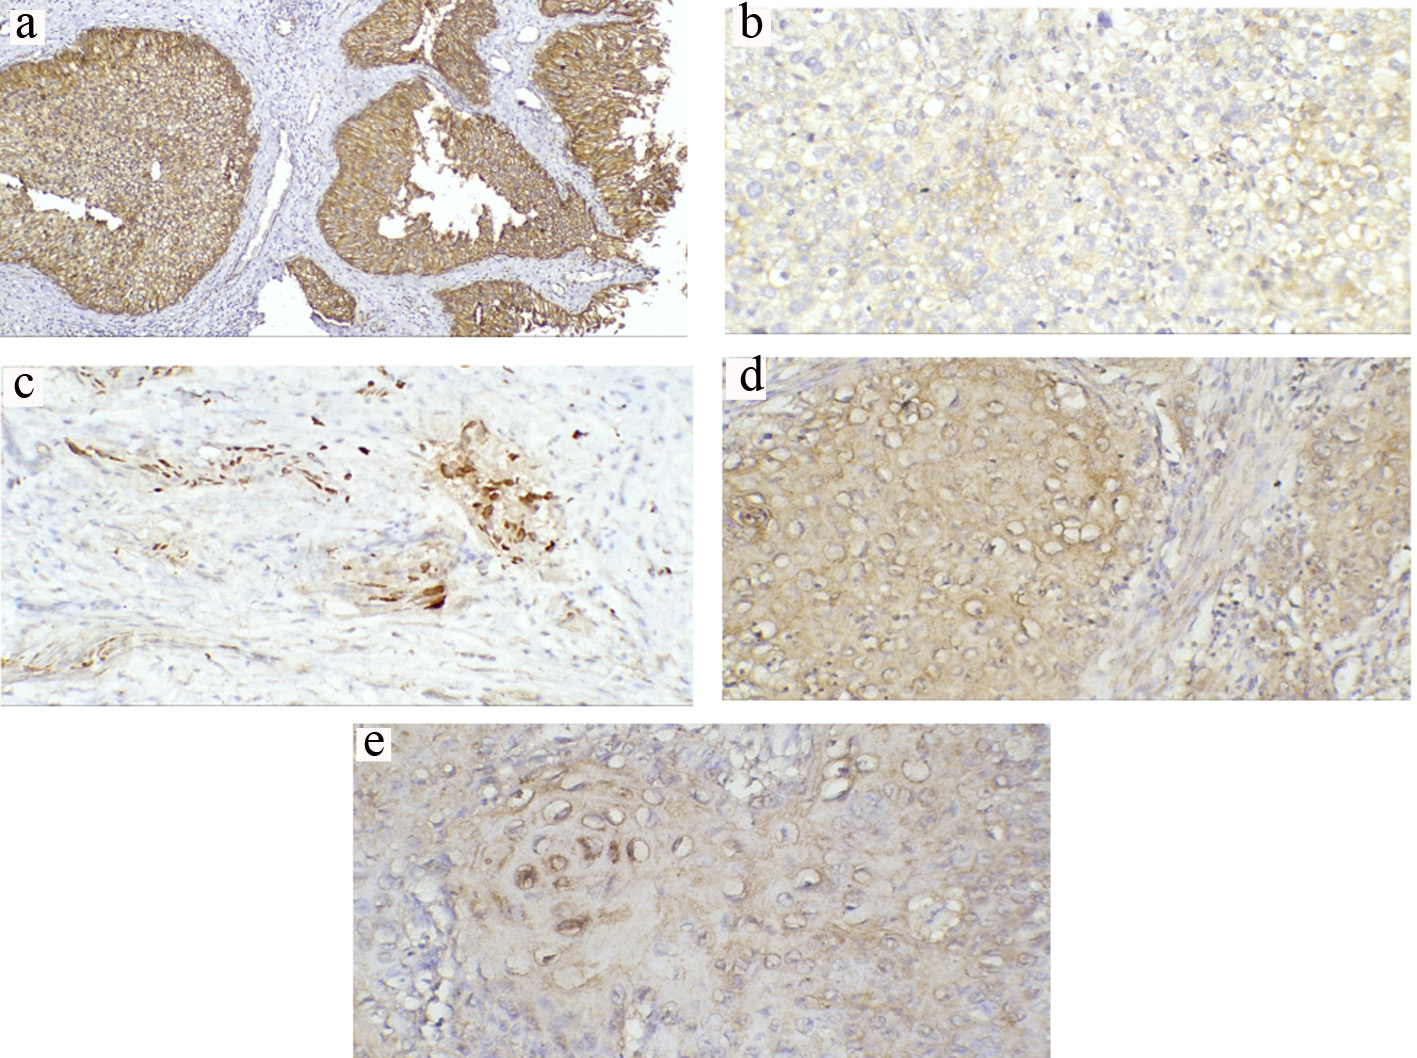
Figure 2. Representative immunohistochemical staining of β-catenin in TCCs and SCCs (a-e) (magnification × 200). (a) Normal positive membranous expression in low-grade non-muscle-invasive TCC. (b) Reduced membranous expression in high-grade invasive TCC. (c) Predominant nuclear expression in invasive TCC. (d) Reduced membranous expression with prominent cytoplasmic expression in invasive SCC. (e) Nuclear expression in invasive SCC. TCC: transitional cell carcinoma; SCC: squamous cell carcinoma.
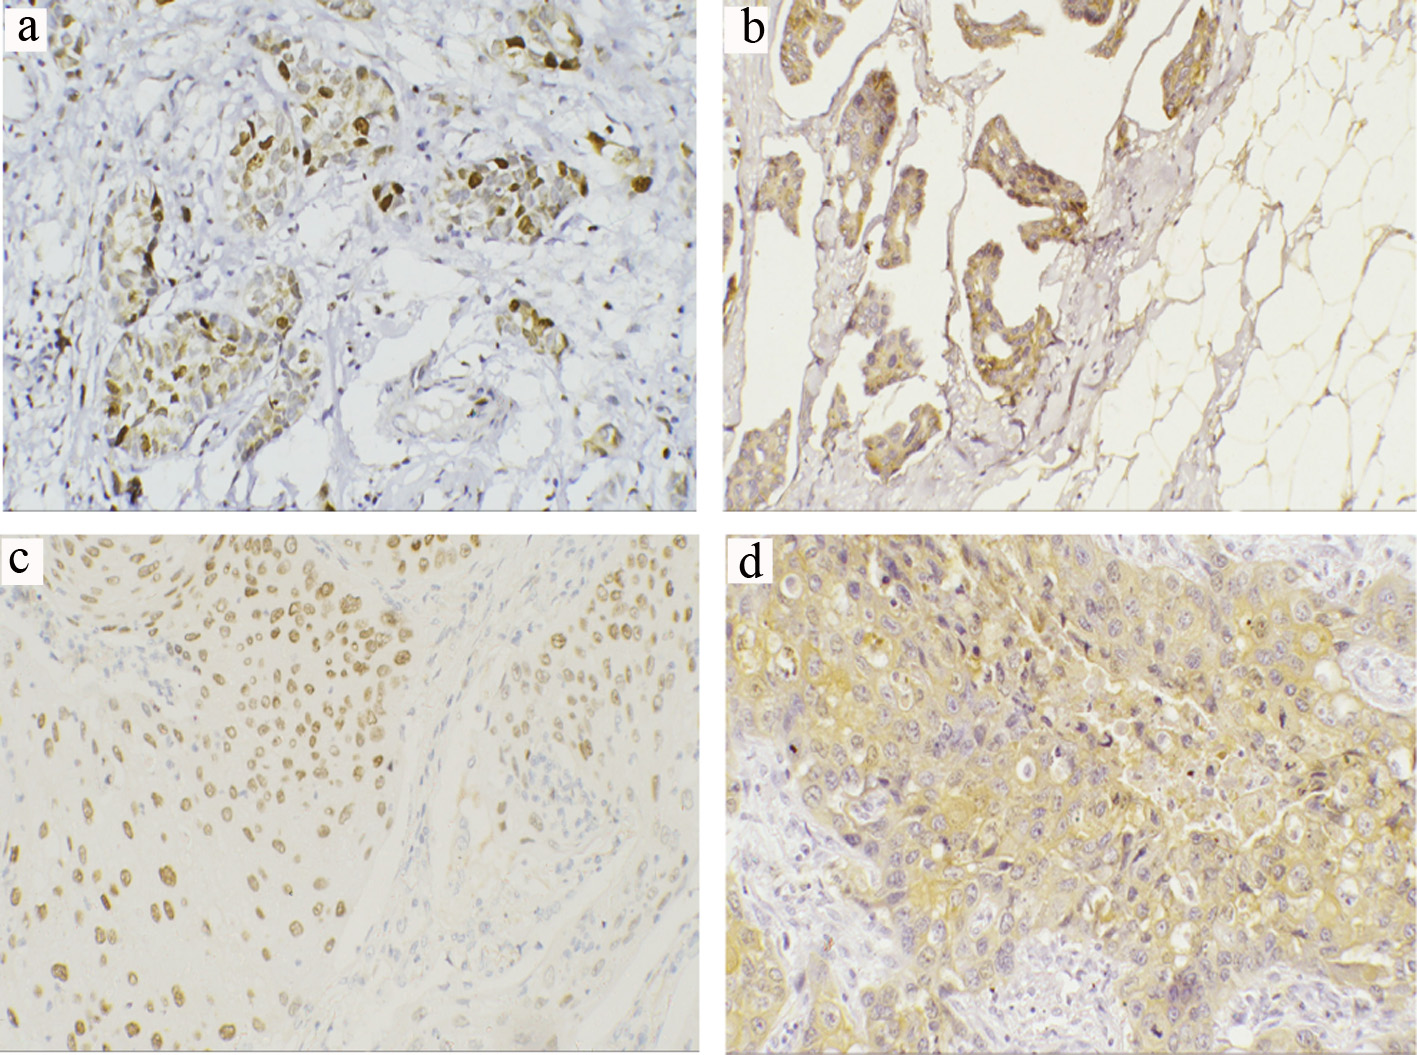
Figure 3. Representative immunohistochemical staining of ZEB1 and ZEB2 in TCCs and SCCs (a-d) (magnification × 200). (a) Positive ZEB1 nuclear expression in invasive TCC. (b) Positive ZEB2 cytoplasmic expression in invasive TCC. (c) Positive ZEB1 nuclear expression in invasive SCC. (d) Positive ZEB2 cytoplasmic expression in high-grade invasive SCC. TCC: transitional cell carcinoma; SCC: squamous cell carcinoma; ZEB: zinc-finger E-box-binding homeobox.
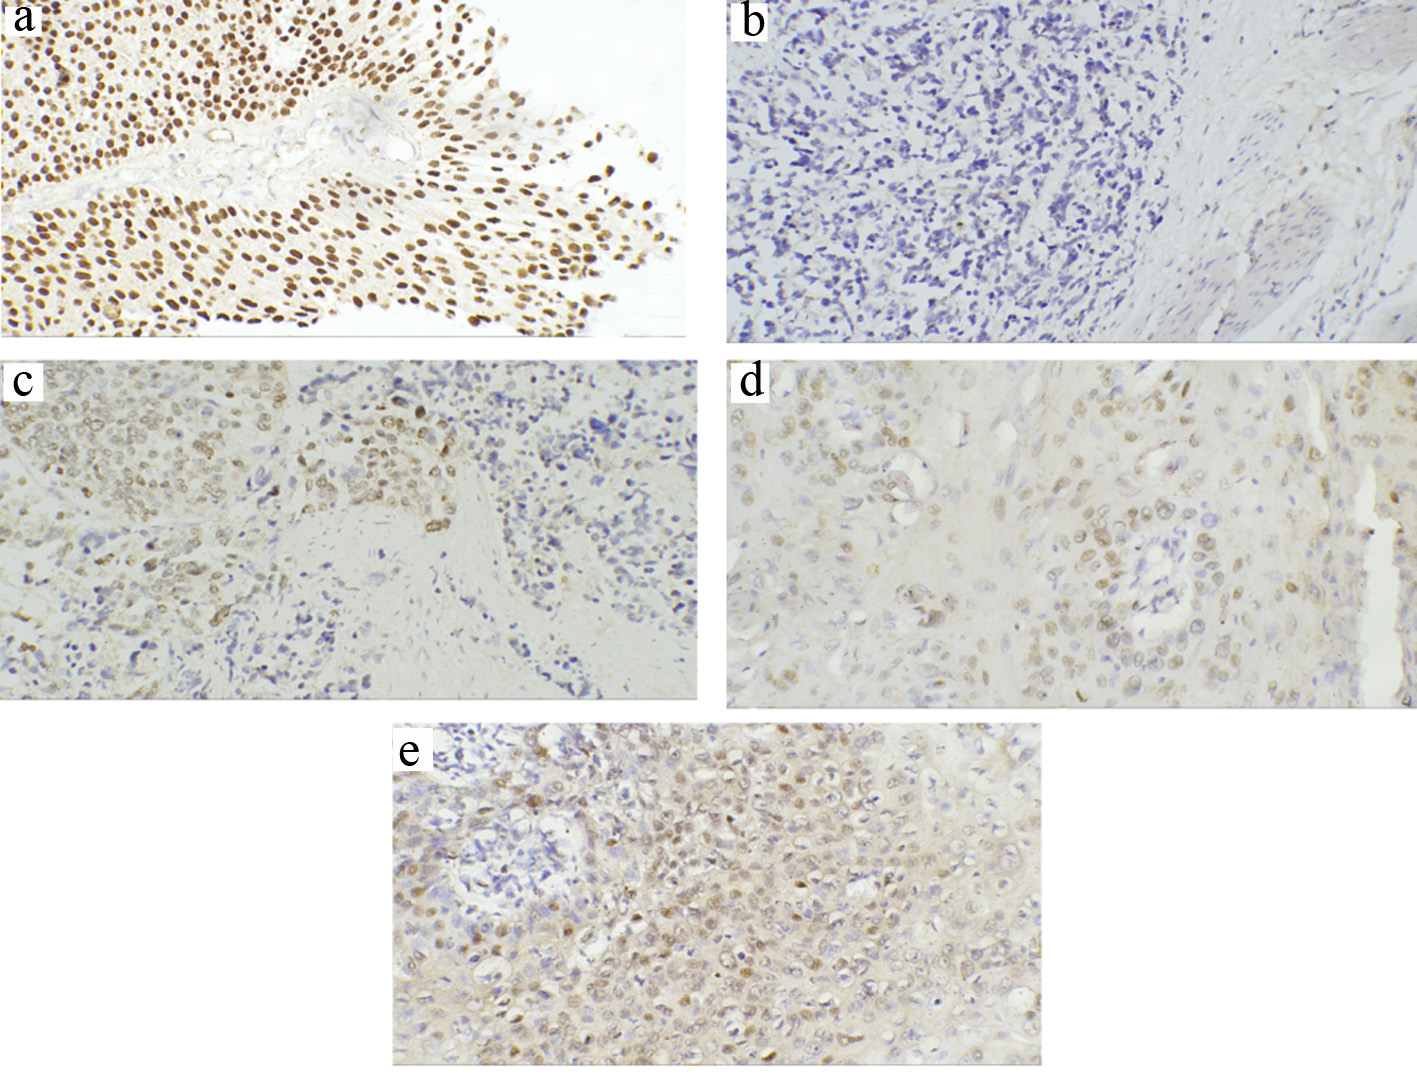
Figure 4. Representative immunohistochemical staining of p63 in TCCs and SCCs (a-e) (magnification × 200). (a) Strong staining of all cell layers in low-grade superficial TCC. (b) Loss of p63 expression in invasive TCC. (c) Some preserved positive p63 expression in invasive TCC. (d) Positive p63 in moderately differentiated SCC (G2) showing positivity in the cells of the basal layer. (e) Diffuse and high intense positivity for p63 in poorly differentiated SCC (G3). TCC: transitional cell carcinoma; SCC: squamous cell carcinoma.
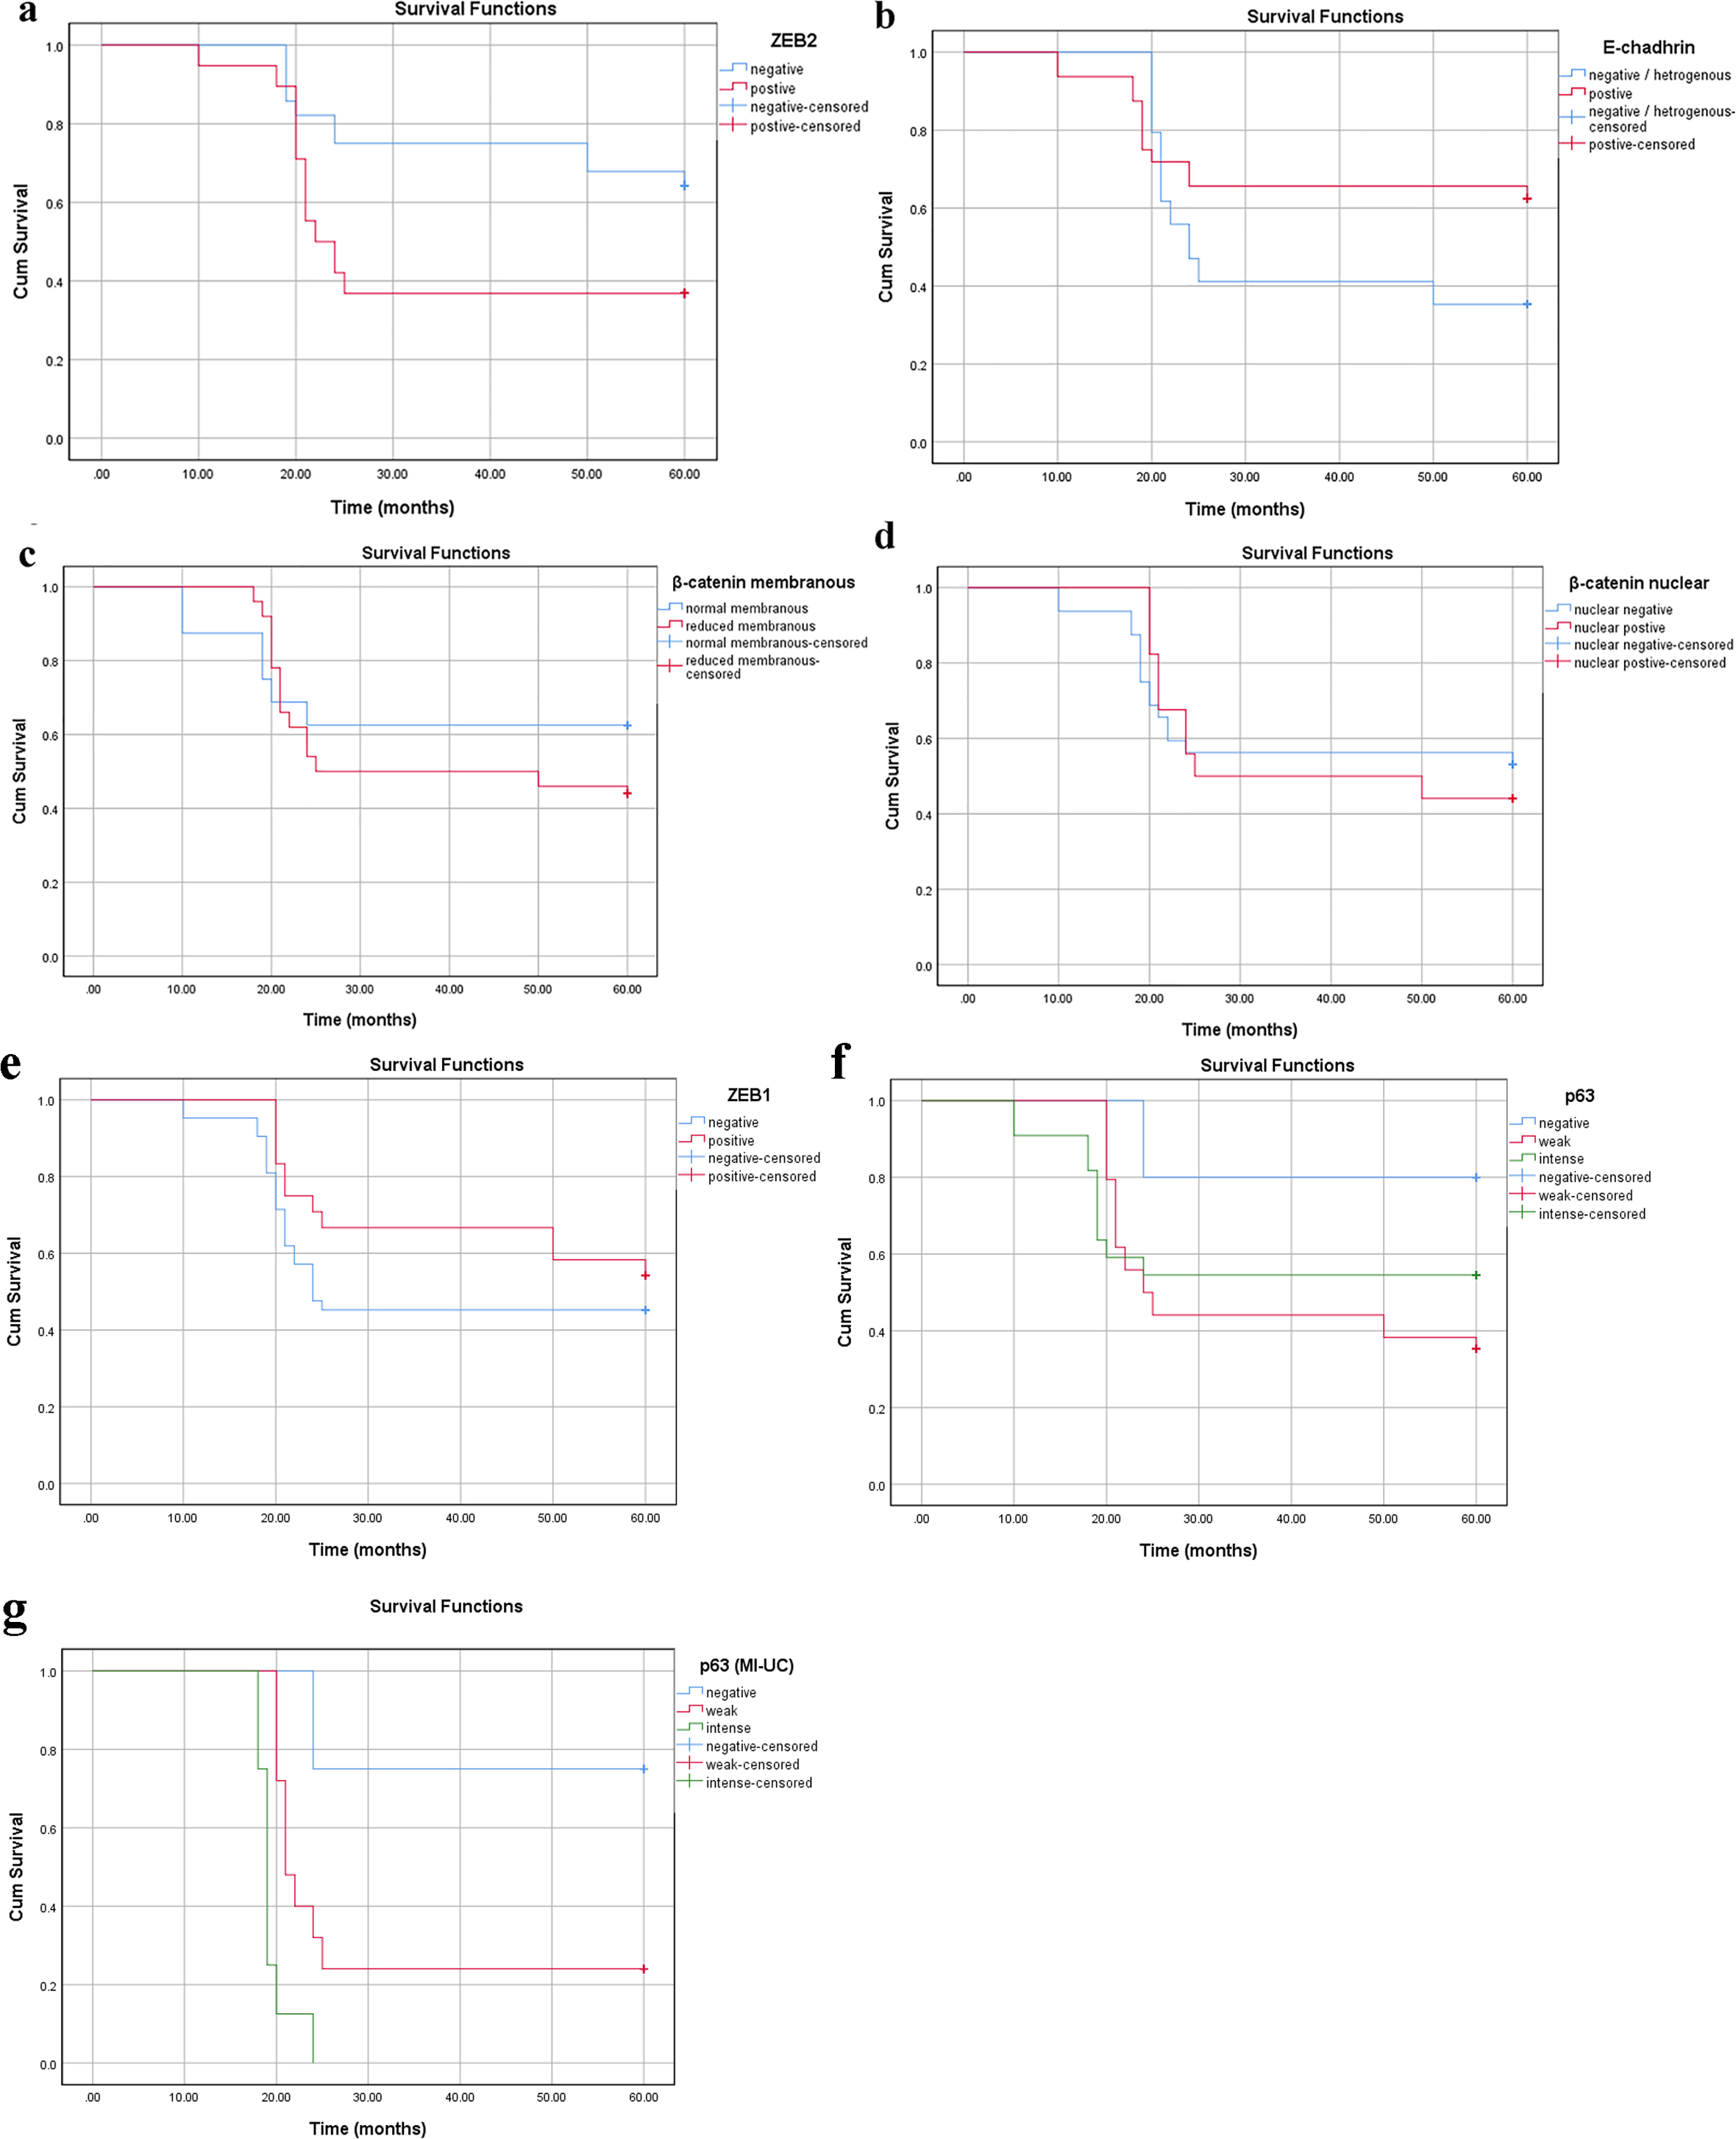
Figure 5. Survival analysis in the TCC group according to cumulative Kaplan-Meier methods (a-g). (a) ZEB2 cytoplasmic expression: negative group (blue) is associated with longer survival than positive group (red) (P = 0.024). (b-f) Reduced membranous E-cadherin, reduced membranous β-catenin, nuclear β-catenin, positive ZEB1, intense p63 expressions without significant correlations (P > 0.05). (g) Intense p63 expression is associated with poor survival in MI-UC (P < 0.001). MI-UC: urinary carcinoma with muscle invasion; TCC: transitional cell carcinoma; ZEB: zinc-finger E-box-binding homeobox.
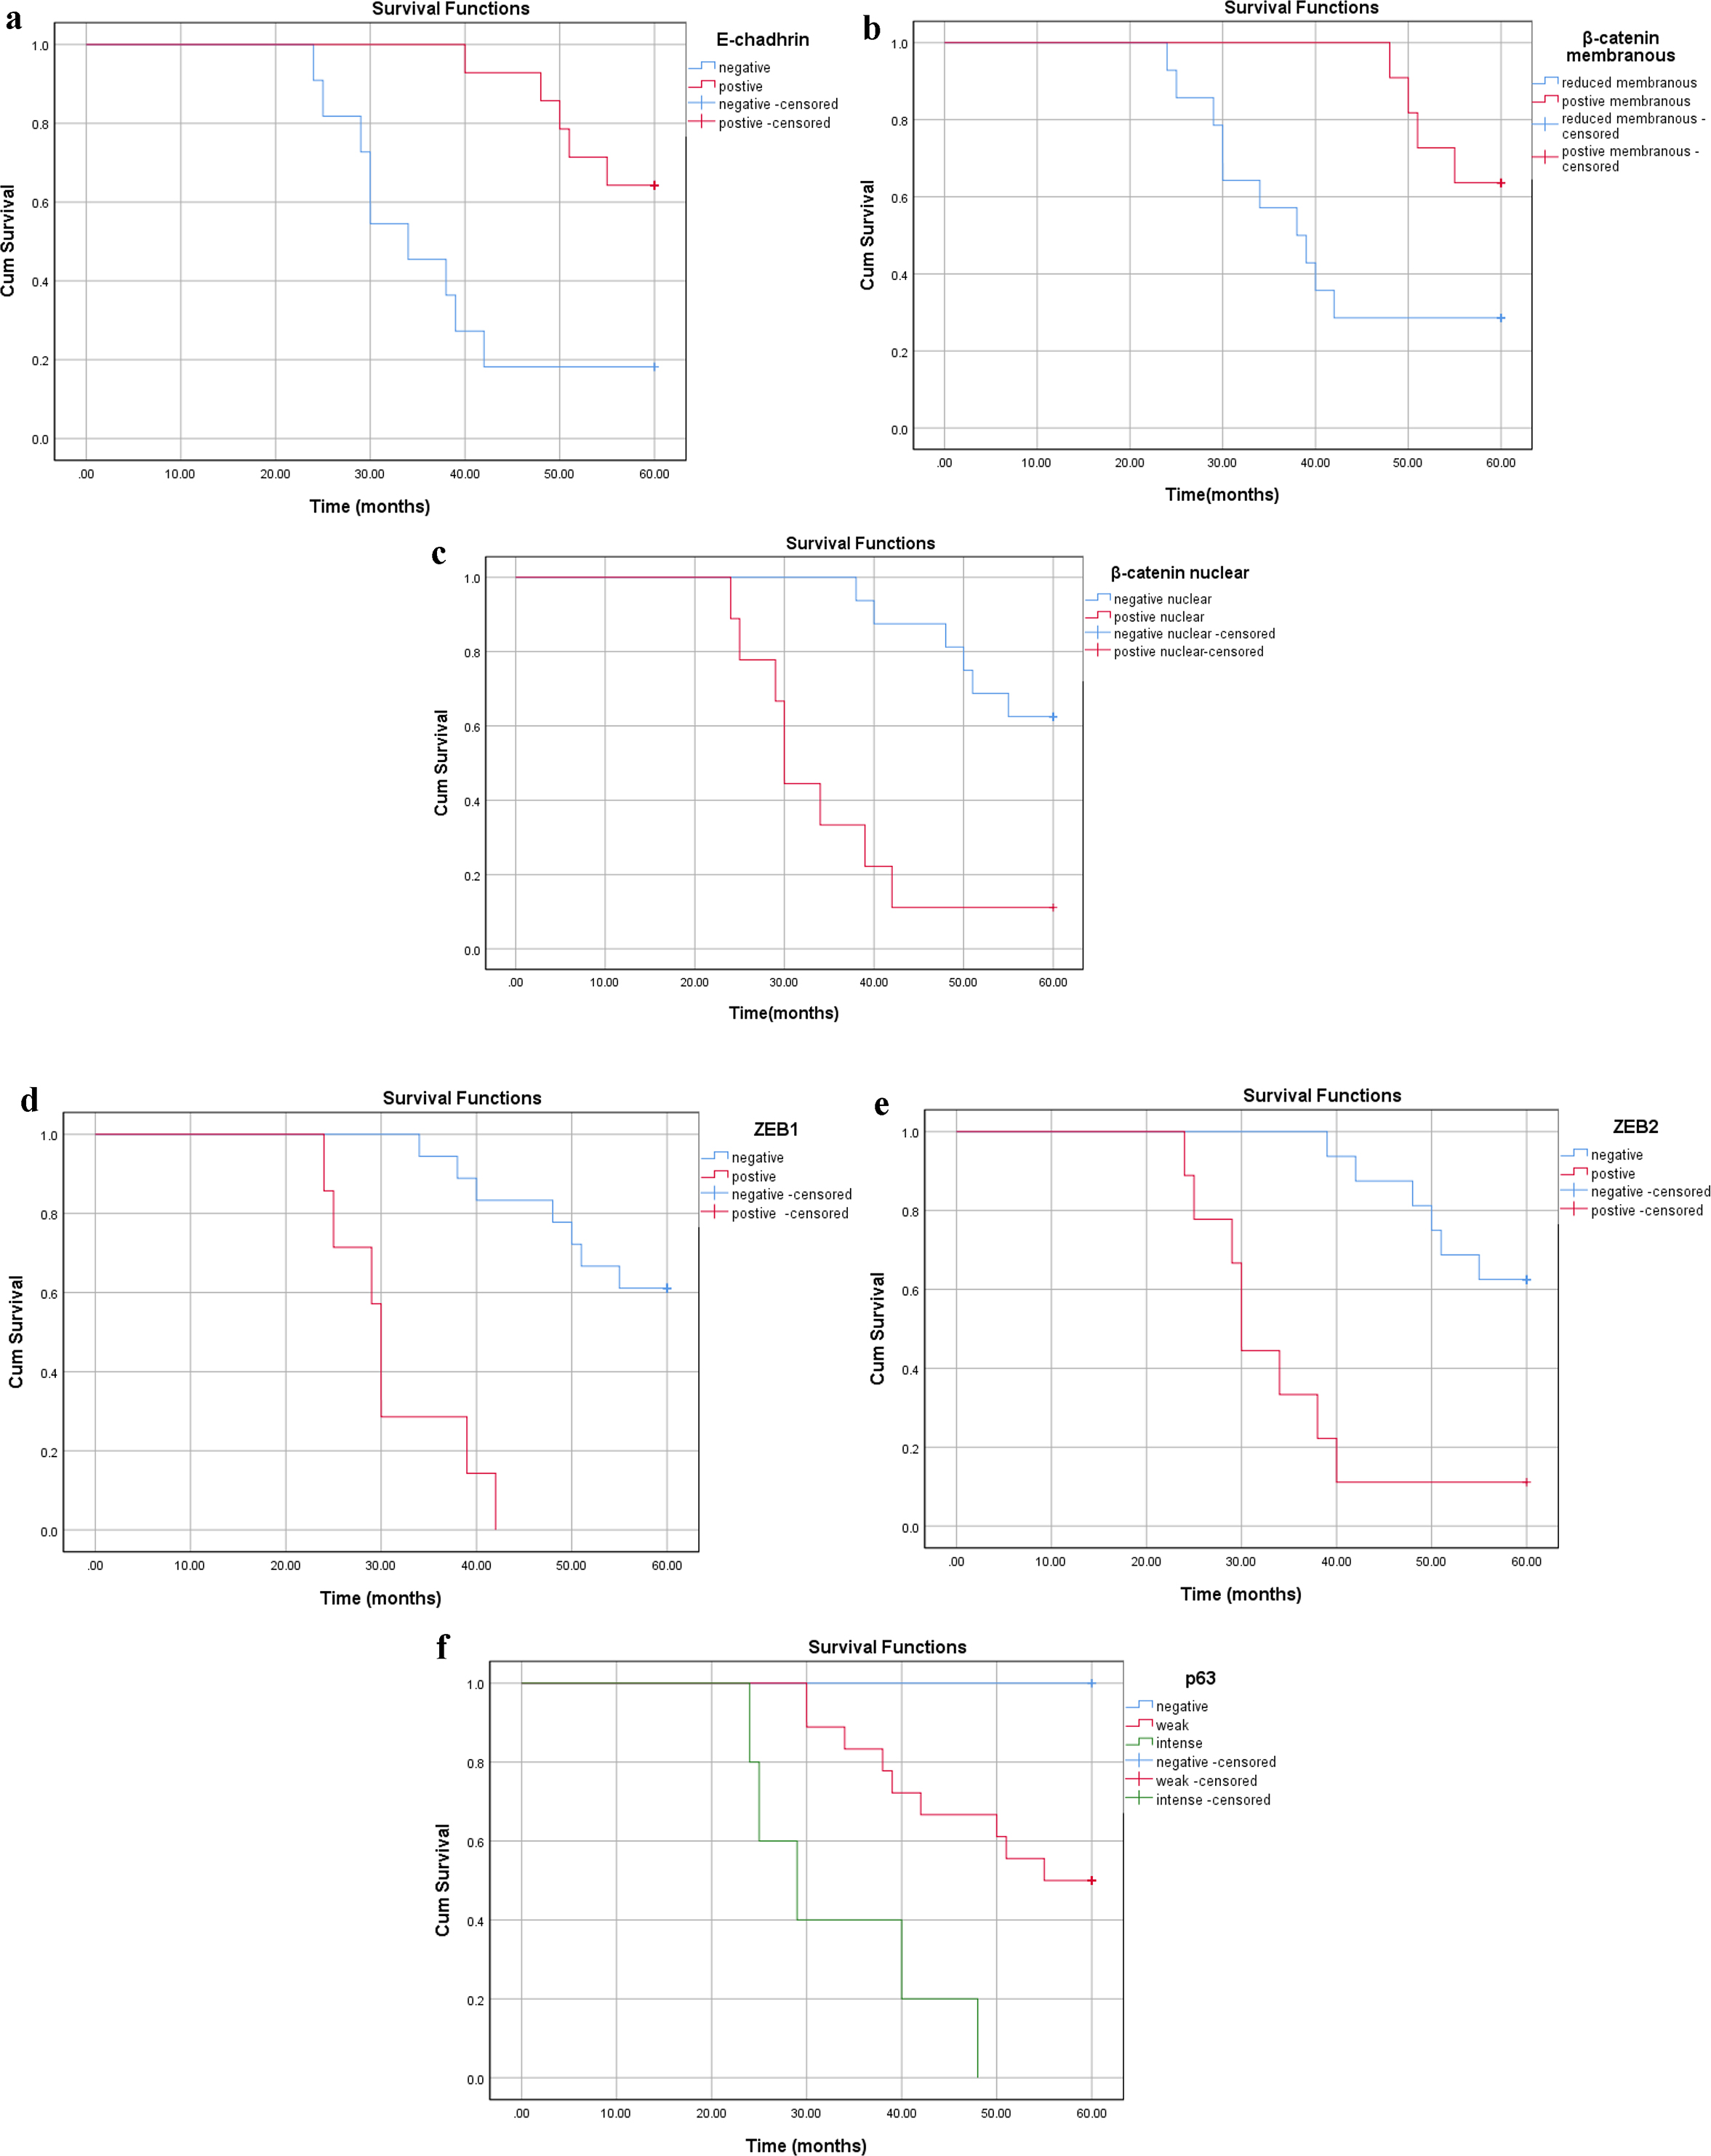
Figure 6. Survival analysis in the SCC group according to cumulative Kaplan-Meier methods (a-f). (a) Reduced membranous E-cadherin, (b) reduced membranous β-catenin, (c) nuclear β-catenin, (d) positive ZEB1 and (e) positive ZEB2 and (f) intense p63 expressions with significant correlations with shorter survival (P < 0.001). SCC: squamous cell carcinoma; ZEB: zinc-finger E-box-binding homeobox.
Tables
Table 1. Clinicopathological Characteristics of Patients With TCC and SCC
| Variables | TCC patients (%) (n = 66) | SCC patients (%) (n = 25) |
|---|
| TCC: transitional cell carcinoma; SCC: squamous cell carcinoma; NMIBC: non-muscle-invasive bladder carcinoma; MIBC: muscle-invasive bladder carcinoma. |
| Age (years) | ≤ 59.5: 35 (53%); > 59.5: 31 (47%) | ≤ 51.5: 14 (56%); > 51.5: 11 (44%) |
| Gender |
| Men | 57 (86.4%) | 21 (84%) |
| Women | 9 (13.6%) | 4 (16%) |
| Bilharzial status |
| No | 36 (54.5%) | 9 (36%) |
| Yes | 30 (45.5%) | 16 (64%) |
| Grade | Low grade: 16 (24.2%); high grade: 50 (75.8%) | G1: 1 (4%); G2: 18 (72%); G3: 6 (24%) |
| Stage | NMIBC: 25 (37.9%); MIBC: 41 (62.1%) | T1: 3 (12%); T2: 18 (72%); T3:4 (16%) |
| Lymph node metastases |
| No | 43 (65.2%) | 19 (76%) |
| Yes | 23 (34.8%) | 6 (24%) |
Table 2. Expression of E-Cadherin, β-Catenin, ZEB1, ZEB2 and p63 in TCC and Their Association With the Clinicopathological Characters
| Variable | No. of cases | E-cadherin | Membranous β-catenin | Nucleo-cytoplasmic β-catenin | ZEB1 | ZEB2 | p63 |
|---|
| Normal 32 (48.5%) | Reduced 34 (51.5%) | Normal 16 (24.2%) | Reduced 50 (75.8%) | -ve 32 (48.5%) | +ve 34 (51.5%) | -ve 42 (63.6%) | +ve 24 (36.4%) | -ve 28 (42.4%) | +ve 38 (57.6%) | -ve 10 (15.2%) | Weak 34 (51.5%) | Intense 22 (33.3%) |
|---|
| NMIBC: non-muscle-invasive bladder carcinoma; MIBC: muscle-invasive bladder carcinoma; ZEB: zinc-finger E-box-binding homeobox; TCC: transitional cell carcinoma. *Significant association. |
| Age |
| ≤ 59.5 years | 35 | 17 (48.6%) | 18 (51.5%) | 8 (22.9%) | 27 (77.1%) | 17 (48.6%) | 18 (51.4%) | 27 (77.1%) | 8 (22.9%) | 16 (45.7%) | 19 (54.3%) | 7 (20%) | 17 (48.6%) | 11 (31.4%) |
| > 59.5 years | 31 | 15 (48.4%) | 16 (51.6%) | 8 (25.8%) | 23 (74.2%) | 15 (48.4%) | 16 (51.6%) | 15 (48.4%) | 16 (51.6%) | 12 (38.7%) | 19 (61.3%) | 3 (9.7%) | 17 (54.8%) | 11 (35.5%) |
| P value | | 0.988 | 0.780 | 0.988 | 0.015* | 0.50 | 0.506 |
| Sex | | | | | | | | | | | | | | |
| Men | 57 | 28 (49.1%) | 29 (50.9%) | 13 (22.8%) | 44 (77.2%) | 27 (47.4%) | 30 (52.6%) | 37 (64.9%) | 20 (35.1%) | 25 (43.9%) | 32 (56.1%) | 8 (14%) | 31 (54.4%) | 18 (31.6%) |
| Women | 9 | 4 (44.4%) | 5 (55.6%) | 3 (33.3%) | 6 (66.7%) | 5 (55.6%) | 4 (44.4%) | 5 (55.6%) | 4 (44.4%) | 3 (33.3%) | 6 (66.7%) | 2 (22.2%) | 3 (33.3%) | 4 (44.4%) |
| P value | | 0.794 | 0.493 | 0.648 | 0.588 | 0.553 | 0.497 |
| Bilharzial status |
| No | 36 | 16 (44.4%) | 20 (55.6%) | 8 (22.2%) | 28 (77.8%) | 16 (44.6%) | 20 (55.6%) | 22 (61.1%) | 14 (38.9%) | 12 (33.3%) | 24 (66.7%) | 6 (16.7%) | 19 (52.8%) | 11 (30.6%) |
| Yes | 30 | 16 (53.3%) | 14 (46.7%) | 8 (26.7%) | 22 (73.3%) | 16 (53.3%) | 14 (46.7%) | 20 (66.7%) | 10 (33.3%) | 16 (53.3%) | 14 (46.7%) | 4 (13.3%) | 15 (50%) | 11 (36.7%) |
| P value | | 0.470 | 0.675 | 0.470 | 0.640 | 0.102 | 0.849 |
| Grade |
| Low grade | 16 | 12 (75%) | 4 (25%) | 12 (75%) | 4 (25%) | 14 (87.5%) | 2 (12.5%) | 14 (87.5%) | 2 (12.5%) | 6 (37.5%) | 10 (62.5%) | 2 (12.5%) | 4 (25%) | 10 (62%) |
| High grade | 50 | 20 (40%) | 30 (60%) | 4 (8%) | 46 (92%) | 18 (36%) | 32 (64%) | 28 (56%) | 22 (44%) | 22 (44%) | 28 (56%) | 8 (16%) | 30 (60%) | 12 (24%) |
| P value | | 0.015* | < 0.001* | < 0.001* | 0.023* | 0.640 | 0.015* |
| Stage |
| NMIBC | 25 | 18 (72%) | 7 (28%) | 12 (48%) | 13 (52%) | 18 (72%) | 7 (28%) | 16 (64%) | 9 (36%) | 16 (64%) | 9 (36%) | 2 (8%) | 9 (36%) | 14 (56%) |
| MIBC | 41 | 14 (34.1%) | 27 (65.9%) | 4 (9.8%) | 37 (90.2%) | 14 (34.1%) | 27 (65.9%) | 26 (63.4%) | 15 (36.6%) | 12 (29.3%) | 29 (70.7%) | 8 (10.5%) | 25 (61%) | 8 (19.5%) |
| P value | | 0.003* | < 0.001* | 0.003* | 0.96 | 0.006* | 0.009* |
| Lymph node metastasis |
| No | 43 | 26 (60.5%) | 17 (39.5%) | 15 (34.9%) | 28 (65.1%) | 23 (53.5%) | 20 (46.5%) | 26 (60.5%) | 17 (39.5%) | 25 (58.1%) | 18 (41.9%) | 9 (20.9%) | 16 (37.2%) | 18 (41.9%) |
| Yes | 23 | 6 (26.1%) | 17 (73.9%) | 1 (4.3%) | 22 (95.7%) | 9 (39.1%) | 14 (60.9%) | 16 (69.6%) | 7 (30.4%) | 3 (13%) | 20 (87%) | 1 (4.3%) | 18 (78.3%) | 4 (17.4%) |
| P value | | 0.008* | 0.006* | 0.260 | 0.460 | < 0.001* | 0.006* |
Table 3. Expression of E-Cadherin, β-Catenin, ZEB1, ZEB2 and p63 in SCC and Their Association With the Clinicopathological Characters
| Variable | No. of cases | E-cadherin | Membranous β-catenin | Nucleo-cytoplasmic β-catenin | ZEB1 | ZEB2 | p63 |
|---|
| Normal 14 (56%) | Reduced 11 (44%) | Normal 11 (44%) | Reduced 14 (56%) | -ve 16 (64%) | +ve 9 (36%) | -ve 18 (72%) | +ve 7 (28%) | -ve 16 (64%) | +ve 9 (36%) | -ve 2 (8%) | Weak 18 (72%) | Intense 5 (20%) |
|---|
| ZEB: zinc-finger E-box-binding homeobox; SCC: squamous cell carcinoma. *Significant association. |
| Age |
| ≤ 51.5 years | 14 | 9 (64.3%) | 5 (35.7%) | 6 (42.9%) | 8 (57.1%) | 10 (71.4%) | 4 (28.6%) | 10 (71.4%) | 4 (28.6%) | 10 (71.4%) | 4 (28.6%) | 1 (7.1%) | 9 (64.3%) | 4 (28.6%) |
| > 51.5 years | 11 | 5 (45.5%) | 6 (54.5%) | 5 (45.5%) | 6 (54.5%) | 6 (54.5%) | 5 (45.5%) | 8 (72.7%) | 3 (27.3%) | 6 (54.5%) | 5 (45.5%) | 1 (9.1%) | 9 (81.8%) | 1 (9.1%) |
| P value | | 0.346 | 0.897 | 0.383 | 0.943 | 0.383 | 0.482 |
| Sex |
| Men | 21 | 8 (38.1%) | 13 (61.9%) | 11 (52.4%) | 10 (47.6%) | 15 (71.4%) | 6 (28.6%) | 16 (76.2%) | 5 (23.8%) | 15 (71.4%) | 6 (28.6%) | 1 (4.8% | 16 (76.2%) | 4 (19%) |
| Women | 4 | 3 (75%) | 1 (25%) | 3 (75%) | 1 (25%) | 1 (25%) | 3 (75%) | 2 (50%) | 2 (50%) | 1 (25%) | 3 (75%) | 1 (25%) | 2 (50%) | 1 (25%) |
| P value | | 0.288 | 0.604 | 0.116 | 0.548 | 0.116 | 0.438 |
| Bilharzial status |
| No | 8 | 4 (50%) | 4 (50%) | 3 (37.5%) | 5 (62.5%) | 5 (62.5%) | 3 (37.5%) | 6 (75%) | 2 (25%) | 5 (62.5%) | 3 (37.5%) | 1 (12.5 | 5 (62.5%) | 2 (25%) |
| Yes | 17 | 10 (58.8%) | 7 (41.2%) | 8 (47.1%) | 9 (52.9%) | 11 (64.7%) | 6 (35.3%) | 12 (70.6%) | 5 (29.4%) | 11 (64.7%) | 6 (35.3%) | 1 (5.9%) | 13 (76.5%) | 3 (17.6%) |
| P value | | 1.000 | 1.000 | 0.900 | 1.000 | 0.915 | 0.752 |
| Grade |
| G1 | 1 | 1 (100%) | 0 (0%) | 1 (100%) | 0 (0%) | 1 (100%) | 0 (0%) | 1 (100%) | 0 (0%) | 1 (100%) | 0 (0%) | 1 (100%) | 0 (0%) | 0 (0%) |
| G2 | 18 | 12 (66.7%) | 6 (33.3%) | 10 (55.6%) | 8 (44.4%) | 14 (77.8%) | 4 (22.2%) | 15 (83.3%) | 3 (16.7%) | 14 (77.8%) | 4 (22.2%) | 1 (5.6%) | 15 (83.3%) | 2 (11.1%) |
| G3 | 6 | 1 (16.7%) | 5 (83.3%) | 0 (0%) | 6 (100%) | 1 (16.7%) | 5 (83.3%) | 2 (33.3%) | 4 (66.7%) | 1 (16.7%) | 5 (83.3%) | 0 (0%) | 3 (50%) | 3 (50%) |
| P value | | 0.040* | 0.008* | 0.017* | 0.040* | 0.017* | 0.046* |
| Stage |
| T1 | 3 | 3 (100%) | 0 (0%) | 3 (100%) | 0 (0%) | 3 (100%) | 0 (0%) | 3 (100%) | 0 (0%) | 3 (100%) | 0 (0%) | 1 (33%) | 2 (66.7%) | 0 (0%) |
| T2 | 18 | 10 (55.6%) | 8 (44.4%) | 8 (44.4%) | 10 (55.6%) | 12 (66.7%) | 6 (33.3%) | 14 (77.8%) | 4 (22.2%) | 13 (72.2%) | 5 (27.8%) | 1 (5.6%) | 15 (83.3% | 2 (11.1%) |
| T3 | 4 | 1 (25%) | 3 (75%) | 0 (0%) | 4 (100%) | 1 (25%) | 3 (75%) | 1 (25%) | 3 (75%) | 0 (0%) | 4 (100%) | 0 (0%) | 1 (25%) | 3 (75%) |
| P value | | 0.079 | 0.008* | 0.072 | 0.048* | 0.003* | 0.046* |
| Lymph node metastasis |
| No | 19 | 13 (68.4%) | 6 (31.6%) | 9 (47.4%) | 10 (52.6%) | 15 (78.9%) | 4 (21.1%) | 17 (89.5%) | 2 (10.5%) | 15 (78.9%) | 4 (21.1%) | 2 (10.5) | 16 (84.2%) | 1 (5.3%) |
| Yes | 6 | 1 (16.7%) | 5 (83.3%) | 5 (83.3%) | 1 (16.7%) | 1 (16.7%) | 5 (83.3%) | 1 (16.7%) | 5 (83.3%) | 1 (16.7%) | 5 (83.3%) | 0 (0%) | 2 (33.3%) | 4 (66.7%) |
| P value | | 0.026* | 0.180 | 0.012* | 0.001* | 0.012* | 0.004* |
Table 4. Correlation of E-Cadherin Expression With p63, ZEB1, ZEB2 and Nucleo-Cytoplasmic β-Catenin Expression in TCC Cases
| E-cadherin | Spearman | P value |
|---|
| Normal | Reduced |
|---|
| ZEB: zinc-finger E-box-binding homeobox; TCC: transitional cell carcinoma. |
| p63 | 0.512 | 0.000 |
| -ve | 6 (60%) | 4 (40%) | | |
| Weak | 4 (11.8%) | 30 (88.2%) | | |
| Intense | 22 (100%) | 0 (0%) | | |
| ZEB 1 | -0.481 | 0.000 |
| -ve | 28 (66.7%) | 14 (33.3%) | | |
| +ve | 4 (16.7%) | 20 (83.3%) | | |
| ZEB2 | -0.517 | 0.000 |
| -ve | 22 (78.6%) | 6 (21.4%) | | |
| +ve | 10 (26.3%) | 28 (73.7%) | | |
| Nucleo-cytoplasmic β-catenin | -0.757 | 0.000 |
| -ve | 28 (87.5%) | 4 (12.5%) | | |
| +ve | 4 (11.8%) | 30 (88.2%) | | |
Table 5. Correlation of E-cadherin Expression With p63, ZEB1, ZEB2 and Nucleo-Cytoplasmic β-Catenin Expression in SCC Cases
| E-cadherin | Spearman | P value |
|---|
| Normal | Reduced |
|---|
| ZEB: zinc-finger E-box-binding homeobox; SCC: squamous cell carcinoma. |
| p63 | -0.263 | 0.242 |
| -ve | 2 (100%) | 0 (0%) | | |
| Weak | 10 (55.6% | 8 (44.4%) | | |
| Intense | 2 (40%) | 3 (60%) | | |
| ZEB1 | -0.704 | 0.000 |
| -ve | 14 (77.8%) | 4 (22.2%) | | |
| +ve | 0 (0%) | 7 (100%) | | |
| ZEB2 | -0.678 | 0.000 |
| -ve | 13 (81.3%) | 3 (18. 8%) | | |
| +ve | 1 (11.1%) | 8 (88.9%) | | |
| Nucleo-cytoplasmic β-catenin | -0.846 | 0.000 |
| -ve | 14 (87.5%) | 2 (12.5%) | | |
| +ve | 0 (0%) | 9 (100%) | | |