World Journal of Oncology, ISSN 1920-4531 print, 1920-454X online, Open Access
Article copyright, the authors; Journal compilation copyright, World J Oncol and Elmer Press Inc
Journal website http://www.wjon.org

Original Article

Volume 10, Number 6, December 2019, pages 187-198


Low Body Mass Index Is an Independent Prognostic Factor in Patients With Non-Small Cell Lung Cancer Treated With Epidermal Growth Factor Receptor Tyrosine Kinase Inhibitor

Figures

Figure 1.
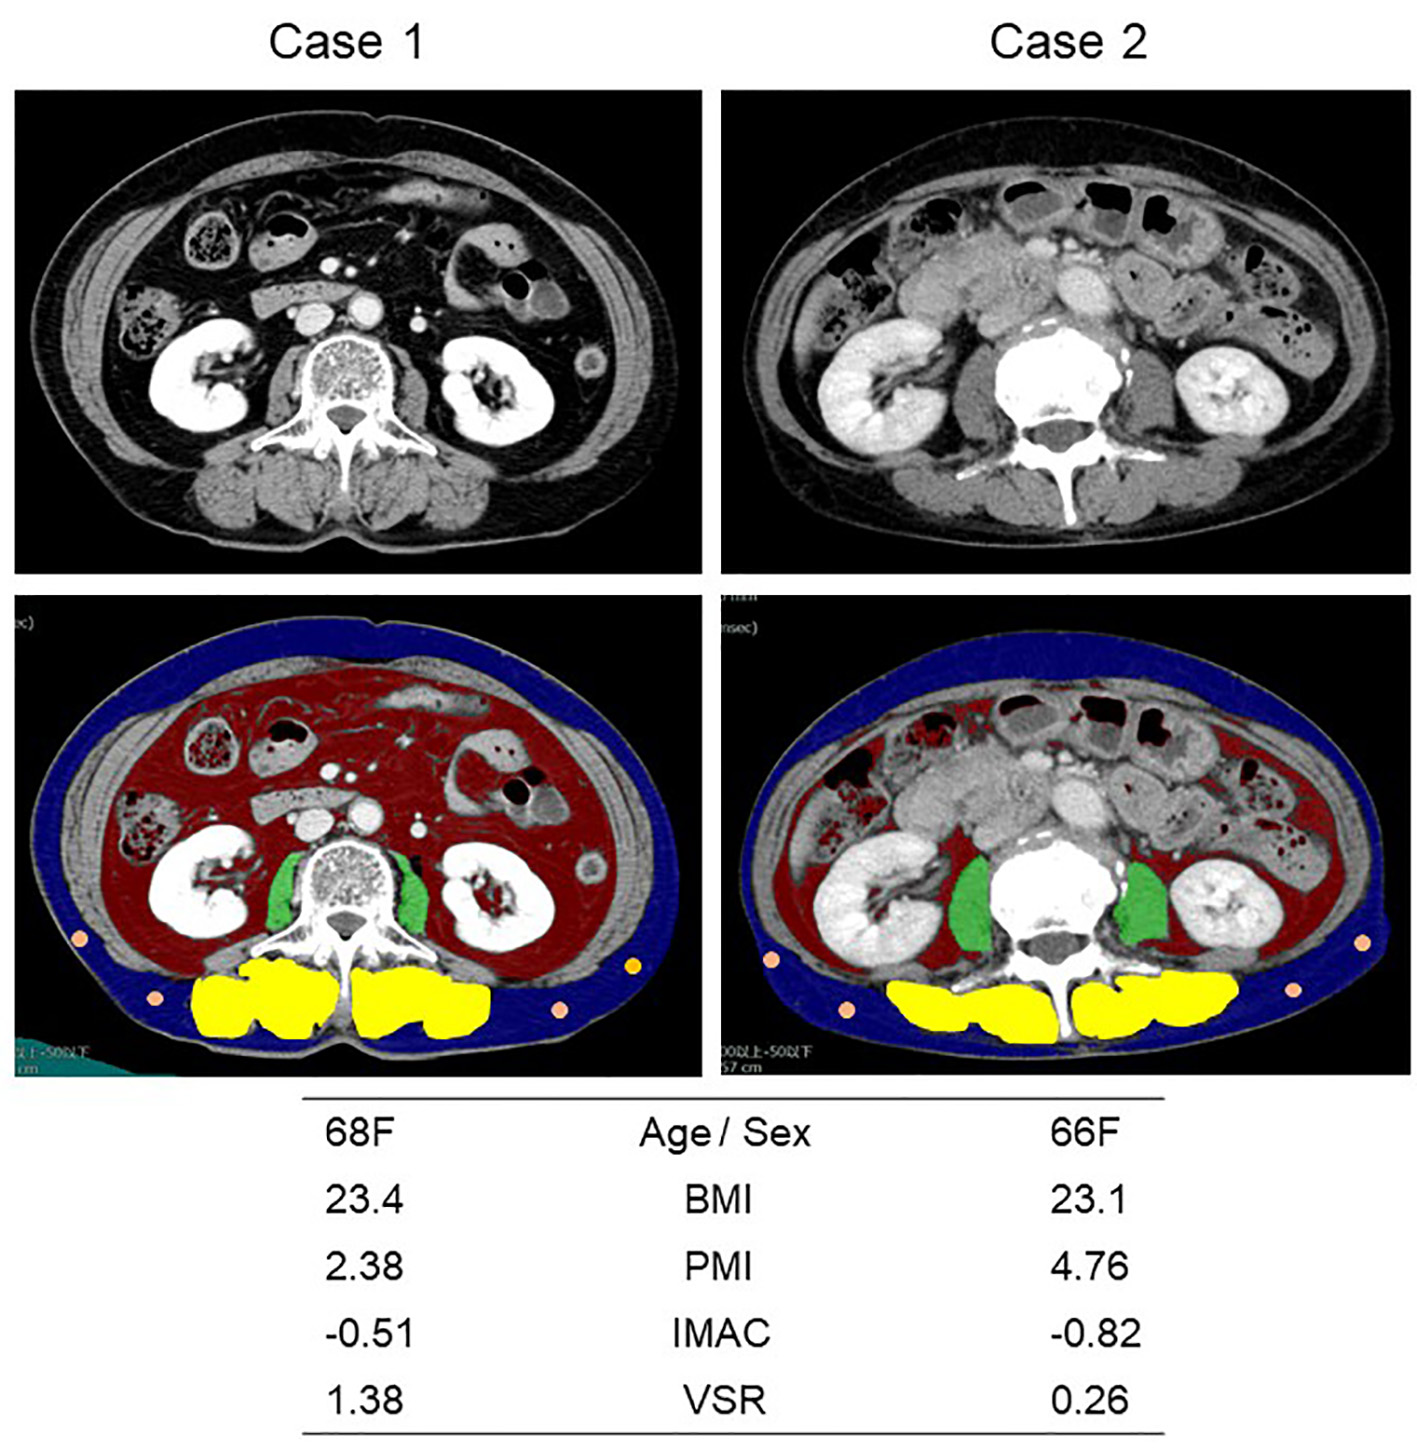
Figure 1. Representative cross-sectional CT images obtained at the third lumber vertebra. Two female patients had similar BMI and age, but different PMI, IMAC and VSR. The areas of bilateral psoas muscles, visceral fat, subcutaneous fat, multifidus muscle and subcutaneous four small circles were identified by green, red, blue, yellow and orange. CT: computed tomography; BMI: body mass index; PMI: psoas muscle index; IMAC: intramuscular adipose tissue content; VSR: visceral-to-subcutaneous adipose tissue area ratio.
Figure 2.
Figure 2. Kaplan-Meier curves of overall survival according to BMI (a), PMI (b), IMAC (c) and VSR (d). BMI: body mass index; PMI: psoas muscle index; IMAC: intramuscular adipose tissue content; VSR: visceral-to-subcutaneous adipose tissue area ratio.
Figure 3.
Figure 3. Kaplan-Meier curves of progression-free survival according to BMI (a), PMI (b), IMAC (c) and VSR (d). BMI: body mass index; PMI: psoas muscle index; IMAC: intramuscular adipose tissue content; VSR: visceral-to-subcutaneous adipose tissue area ratio.

Tables

Table 1. Baseline Characteristics According to Body Mass Index
 
BMIP
≥ 18.5< 18.5
aFisher’s exact test. bMann-Whitney U test. BMI: body mass index; CI: confidence interval; CR: complete response; CS: current smoker; DCR: disease control rate; ECOG-PS: Eastern Cooperative Oncology Group performance status; EGFR: epidermal growth factor receptor; Ex: ex-smoker; ICI: immune-checkpoint inhibitors; IQR: interquartile range; NE: not evaluated; NLR: neutrophil-to-lymphocyte ratio; NS: non-smoker; ORR: overall response rate; PD: progressive disease; PR: partial response; SD: stable disease; TKI: tyrosine kinase inhibitor.
N13433
Backgrounds
  Sex (N)
    Male/female50/8413/200.84a
  Age (years)
    Median (IQR)72 (63.3 - 77.0)74 (67.8 - 78.3)0.21b
    < 75/≥ 75 years (N)82/5218/150.55a
  Smoking status
    NS/Ex, CS69/6516/170.85a
  EGFR mutation
    Ex19del/others67/6713/200.33a
  ECOG-PS
    0-1/2/3-4103/25/622/6/50.10a
  Extra-pulmonary metastases
    Yes/no72/6220/130.56a
  Metastatic sites
    < 3/≥ 368/668/25< 0.01a
  BMI
    Median (IQR)23.2 (21.1 - 24.8)17.7 (16.4 - 18.1)< 0.01b
Treatment (N)
  Regimen
    Gefitinib/erlotinib/afatinib15/31/882/11/200.44a
  Line
    First/Second or later95/3924/91.00a
  Post-TKI treatment
    Osimertinib2130.42a
    ICI therapy1310.31a
  TKI efficacy
    CR/PR/SD/PD/NE6/82/26/15/51/16/5/5/6
    ORR (%) (95% CI)65.7 (57.0 - 73.7)51.5 (33.5 - 69.2)0.16a
    DCR (%) (95% CI)85.1 (77.9 - 90.6)66.7 (48.2 - 82.0)0.02a
Laboratory data
  NLR
    Median (IQR)2.51 (1.78 - 4.27)2.98 (2.20 - 3.98)0.23b
    ≤ 5/> 5 (N)112/2228/51.00a


Table 2. Baseline Characteristics According to Psoas Muscle Index
 
PMIP
LowHigh
aFisher’s exact test. bMann-Whitney U test. BMI: body mass index; CI: confidence interval; CR: complete response; CS: current smoker; DCR: disease control rate; ECOG-PS: Eastern Cooperative Oncology Group performance status; EGFR: epidermal growth factor receptor; Ex: ex-smoker; ICI: immune-checkpoint inhibitors; IQR: interquartile range; NE: not evaluated; NLR: neutrophil-to-lymphocyte ratio; NS: non-smoker; ORR: overall response rate; PD: progressive disease; PMI: psoas muscle index; PR: partial response; SD: stable disease; TKI: tyrosine kinase inhibitor.
N10265
Backgrounds
  Sex (N)
    Male/female43/5920/450.15a
  Age (years)
    Median (IQR)74 (66 - 79)71 (60 - 76)0.03b
    < 75/≥ 75 years (N)58/4442/230.34a
  Smoking status
    NS/Ex, CS49/5336/290.43a
  EGFR mutation
    Ex19del/others45/5735/300.27a
  ECOG-PS
    0-1/2/3-471/23/854/8/30.16a
  Extra-pulmonary metastases
    Yes/no60/4232/330.27a
  Metastatic sites
    < 3/≥ 346/5630/351.00a
  BMI
    Median (IQR)21.2 (18.3 - 23.4)23.7 (21.0 - 25.6)< 0.01b
  PMI
    Median (IQR)3.53 (2.91 - 4.45)5.01 (4.58 - 6.75)< 0.01b
Treatment (N)
  Regimen
    Gefitinib/erlotinib/afatinib65/28/943/14/80.59a
  Line
    First/second or later74/2845/200.73a
  Post-TKI treatment
    Osimertinib10140.04a
    ICI therapy680.16a
  TKI efficacy
    CR/PR/SD/PD/NE4/55/19/14/103/43/12/6/1
    ORR (%) (95% CI)57.8 (47.7 - 67.6)70.8 (58.2 - 81.4)0.10a
    DCR (%) (95% CI)76.5 (67.0 - 84.3)89.2 (79.1 - 95.6)0.04a
Laboratory data
  NLR
    Median (IQR)2.83 (1.94 - 4.57)2.50 (1.61 - 3.54)0.10b
    ≤ 5/> 5 (N)82/2058/70.20a


Table 3. Baseline Characteristics According to Intramuscular Adipose Tissue Content
 
IMACP
LowHigh
aFisher’s exact test. bMann-Whitney U test. BMI: body mass index; CI: confidence interval; CR: complete response; CS: current smoker; DCR: disease control rate; ECOG-PS: Eastern Cooperative Oncology Group performance status; EGFR: epidermal growth factor receptor; Ex: ex-smoker; ICI: immune-checkpoint inhibitors; IMAC: intramuscular adipose tissue content; IQR: interquartile range; NE: not evaluated; NLR: neutrophil-to-lymphocyte ratio; NS: non-smoker; ORR: overall response rate; PD: progressive disease; PR: partial response; SD: stable disease; TKI: tyrosine kinase inhibitor.
N14819
Backgrounds
  Sex (N)
    Male/female91/5713/60.62a
  Age (years)
    Median (IQR)72 (64 - 77)76 (69.5 - 81)0.04b
    < 75/≥ 75 years (N)91/579/100.32a
  Smoking status
    NS/Ex, CS77/718/110.47a
  EGFR mutation
    Ex19del/others70/7810/90.81a
  ECOG-PS
    0-1/2/3-4114/24/1011/7/10.10a
  Extra-pulmonary metastases
    Yes/no80/6812/70.63a
  Metastatic sites
    < 3/≥ 370/786/130.23a
  BMI
    Median (IQR)20.1 (19.1 - 24.4)22.3 (20.1 - 24.4)0.68a
  IMAC
    Median (IQR)-0.52 (-0.63, -0.43)-0.16 (-0.23, -0.10)< 0.01b
Treatment (N)
  Regimen
    Gefitinib/erlotinib/afatinib97/35/1611/7/10.45a
  Line
    First/second or later106/4213/60.79a
  Post-TKI treatment
    Osimertinib2310.32a
    ICI therapy1400.37a
  TKI efficacy
    CR/PR/SD/PD/NE33/81/24/8/23/8/7/1
    ORR (%) (95% CI)77.0 (69.4 - 83.5)57.9 (33.5 - 79.7)0.09a
    DCR (%) (95% CI)93.2 (87.9 - 96.7)94.7 (74.0 - 99.9)1.00a
Laboratory data
  NLR
    Median (IQR)2.67 (1.79 - 3.93)2.95 (2.05 - 4.92)0.42b
    ≤ 5/> 5 (N)126/2214/50.20a


Table 4. Baseline Characteristics According to Visceral-to-Subcutaneous Adipose Tissue Area Ratio
 
VSRP
LowHigh
aFisher’s exact test. bMann-Whitney U test. BMI: body mass index; CI: confidence interval; CR: complete response; CS: current smoker; DCR: disease control rate; ECOG-PS: Eastern Cooperative Oncology Group performance status; EGFR: epidermal growth factor receptor; Ex: ex-smoker; ICI: immune-checkpoint inhibitors; IQR: interquartile range; NE: not evaluated; NLR: neutrophil-to-lymphocyte ratio; NS: non-smoker; ORR: overall response rate; PD: progressive disease; PR: partial response; SD: stable disease; TKI: tyrosine kinase inhibitor; VSR: visceral-to-subcutaneous adipose tissue area ratio.
N12839
Backgrounds
  Sex (N)
    Male/female44/8419/200.13a
  Age (years)
    Median (IQR)71 (64 - 76)77 (70.5 - 80.5)< 0.01b
    < 75/≥ 75 years (N)83/4517/220.02a
  Smoking status
    NS/Ex, CS65/6320/191.00a
  EGFR mutation
    Ex19del/others62/6618/210.86a
  ECOG-PS
    0-1/2/3-497/23/828/8/30.81a
  Extra-pulmonary metastases
    Yes/no69/5923/160.71a
  Metastatic sites
    < 3/≥ 354/7422/170.14a
  BMI
    Median (IQR)21.6 (19.1 - 24.1)23.4 (19.7 - 25.6)0.16b
  VSR
    Median (IQR)0.41 (0.23 - 0.74)1.45 (1.26 - 1.93)< 0.01b
Treatment (N)
  Regimen
    Gefitinib/erlotinib/afatinib82/31/1526/11/20.54a
  Line
    First/second or later91/3728/111.00a
  Post-TKI treatment
    Osimertinib2040.60a
    ICI therapy1220.52a
  TKI efficacy
    CR/PR/SD/PD/NE4/79/23/15/73/19/8/5/4
    ORR (%) (95% CI)64.8 (55.9 - 73.1)56.4 (39.6 - 72.2)0.35a
    DCR (%) (95% CI)82.8 (75.1 - 88.9)76.9 (60.7 - 88.9)0.48a
Laboratory data
  NLR
    Median (IQR)2.60 (1.79 - 4.16)2.84 (2.02 - 4.23)0.53b
    ≤ 5/> 5 (N)105/2335/40.33a


Table 5. Adjusted Hazard Ratios of Markers of Sarcopenia and Visceral Obesity by Age, Neutrophil to Lymphocyte Ratio, ECOG-PS, EGFR Mutation Type, Regimen Line and Extra-Pulmonary Metastases
 
VariablesOSPFS
HR (95% CI)PHR (95% CI)P
Multivariate adjustment for age (< 75 vs. ≥ 75 years), neutrophil to lymphocyte ratio (< 5 vs. ≥ 5), ECOG-PS (0 - 1 vs. 2 - 4), EGFR mutation type (exon 19 deletion vs. others), regimen line (first-line vs. second or later line) and extra-pulmonary metastases (yes vs. no). BMI: body mass index; CI: confidence interval; ECOG-PS: Eastern Cooperative Oncology Group performance status; EGFR: epidermal growth factor receptor; HR: hazard ratio; IMAC: intramuscular adipose tissue content; OS: overall survival; PFS: progression-free survival; PMI: psoas muscle index; VSR: visceral-to-subcutaneous adipose tissue area ratio.
BMI (kg/m2)
  ≥ 18.51 (Reference)1(Reference)
  < 18.51.70 (1.03 - 2.81)0.041.72 (1.11 - 2.67)0.02
PMI (cm2/m2)
  High1 (Reference)1(Reference)
  Low1.10 (0.73 - 1.64)0.651.10 (0.76 - 1.58)0.61
IMAC
  Low1 (Reference)1(Reference)
  High1.25 (0.66 - 2.37)0.490.98 (0.56 - 1.71)0.94
VSR
  Low1 (Reference)1(Reference)
  High1.20 (0.76 - 1.91)0.441.01 (0.66 - 1.54)0.98


Table 6. Multivariate Cox Proportional Hazard Analyses, When Extra-Pulmonary Metastases Was Replaced by Numbers of Metastatic Sites as an Explanatory Variable
 
VariablesOSPFS
HR (95% CI)PHR (95% CI)P
BMI: body mass index; CI: confidence interval; ECOG-PS: Eastern Cooperative Oncology Group performance status; EGFR: epidermal growth factor receptor; HR: hazard ratio; NLR: neutrophil-to-lymphocyte ratio; OS: overall survival; PFS: progression-free survival.
Age
  < 75 years1 (Reference)1(Reference)
  ≥ 75 years1.08 (0.72 - 1.64)0.710.86 (0.59 - 1.24)0.42
NLR
  < 51 (Reference)1(Reference)
  ≥ 50.95 (0.55 - 1.63)0.850.79 (0.50 - 1.26)0.33
ECOG-PS
  0 - 11 (Reference)1(Reference)
  2 - 42.86 (1.80 - 4.54)< 0.012.09 (1.39 - 3.13)< 0.01
EGFR mutation
  Exon 19 del1 (Reference)1 (Reference)
  Others1.29 (0.86 - 1.93)0.221.28 (0.90 - 1.82)0.17
Regimen line
  First-line1 (Reference)1 (Reference)
  Second or later1.72 (1.12 - 2.65)0.011.46 (1.00 - 2.12)0.049
Metastatic sites
  < 31 (Reference)1 (Reference)
  ≥ 31.96 (1.28 - 3.00)< 0.012.11 (1.46 - 3.05)< 0.01
BMI (kg/m2)
  ≥ 18.51 (Reference)1(Reference)
  < 18.51.48 (0.89 - 2.46)0.131.36 (0.87 - 2.13)0.18