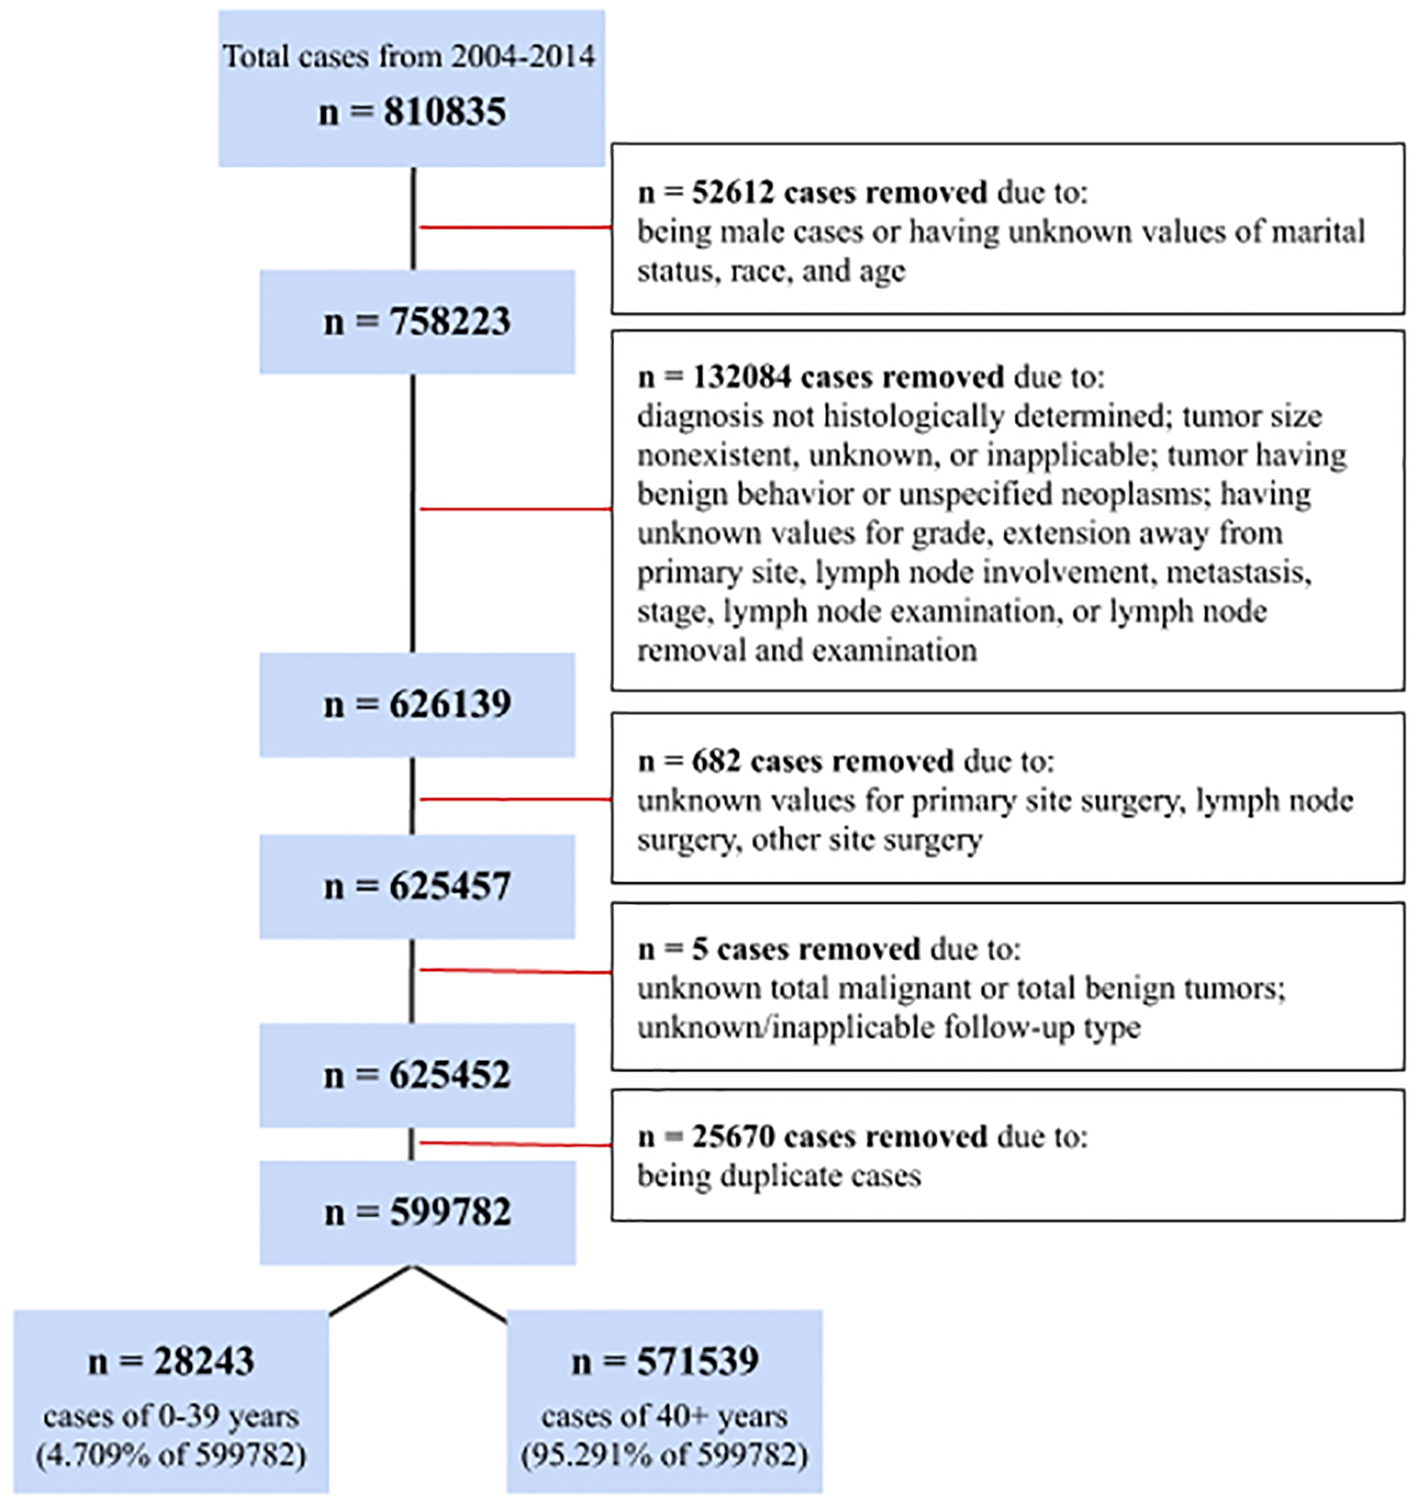
Figure 1. Inclusion and Exclusion Criteria.
| World Journal of Oncology, ISSN 1920-4531 print, 1920-454X online, Open Access |
| Article copyright, the authors; Journal compilation copyright, World J Oncol and Elmer Press Inc |
| Journal website http://www.wjon.org |
Original Article
Volume 11, Number 3, June 2020, pages 88-97
Breast Cancer Incidence and Behavior in Younger Patients: A Study From the Surveillance, Epidemiology and End Results Database
Figure
Tables
| Variables | Younger group (0 - 39), n = 28,243 (4.709%) | Older group (40+), n = 571,539 (95.291%) | P-value |
|---|---|---|---|
| NOS: not otherwise specified; SD: standard deviation; IQR: interquartile range. | |||
| Age at diagnosis | < 0.001 | ||
| Mean (SD) | 34.889 (3.81) | 62.158 (12.51) | |
| Median (IQR) | 36 (33 - 38) | 61 (52 - 71) | |
| Marital status, n (%) | < 0.001 | ||
| Single (never married) | 8,133 (28.80) | 76,542 (13.39) | |
| Married (including common law) | 17,730 (62.78) | 331,938 (58.08) | |
| Separated | 433 (1.53) | 5,703 (1.00) | |
| Divorced | 1,755 (6.21) | 64,914 (11.36) | |
| Widowed | 130 (0.46) | 91,723 (16.05) | |
| Unmarried/domestic partner | 62 (0.22) | 719 (0.13) | |
| Race, n (%) | < 0.001 | ||
| White | 20,345 (72.04) | 463,663 (81.13) | |
| Black | 4,328 (15.32) | 58,330 (10.21) | |
| American Indian/Alaska Native | 185 (0.66) | 2,784 (0.49) | |
| Asian or Pacific Islander | 3,385 (11.99) | 46,762 (8.18) | |
| Insurance status, n (%) | < 0.001 | ||
| Uninsured | 679 (2.40) | 6,057 (1.06) | |
| Any Medicaid | 3,375 (11.95) | 43,192 (7.56) | |
| Insured | 14,467 (51.22) | 318,414 (55.71) | |
| Insured/no specifics | 1,965 (6.96) | 60,277 (10.55) | |
| Insurance status unknown | 252 (0.89) | 5,137 (0.90) | |
| Undocumented | 7,505 (26.57) | 138,462 (24.23) | |
| Primary site, n (%) | < 0.001 | ||
| Nipple | 79 (0.28) | 2,746 (0.48) | |
| Central portion of breast | 1,130 (4.00) | 31,136 (5.45) | |
| Upper-inner quadrant of breast | 3,104 (10.99) | 65,068 (11.38) | |
| Lower-inner quadrant of breast | 1,437 (5.09) | 33,857 (5.92) | |
| Upper-outer quadrant of breast | 9,516 (33.69) | 195,041 (34.13) | |
| Lower-outer quadrant of breast | 2,254 (7.98) | 41,689 (7.29) | |
| Axillary tail of breast | 228 (0.81) | 2,967 (0.52) | |
| Overlapping lesion of breast | 6,206 (21.97) | 128,795 (22.54) | |
| Breast, NOS | 4,289 (15.19) | 70,240 (12.29) | |
| Diagnosis confirmation, n (%) | 0.008 | ||
| Positive histology | 28,175 (99.76) | 570,584 (99.83) | |
| Positive cytology | 63 (0.22) | 809 (0.14) | |
| Positive histology and positive immunophenotyping and/or positive genetic studies | 0 (0.00) | 2 (0.00) | |
| Positive microscopic confirmation, method not specified | 5 (0.02) | 144 (0.03) | |
| Variables | Younger group (0 - 39), n = 28,243 (4.709%) | Older group (40+), n = 571,539 (95.291%) | P-value |
|---|---|---|---|
| NOS: not otherwise specified; ITCs: isolated tumor cells. | |||
| Tumor size, n (%) | < 0.001 | ||
| 0.1 - 2.0 cm | 12,121 (42.92) | 362,102 (63.36) | |
| 2.1 - 5.0 cm | 12,045 (42.65) | 164,218 (28.73) | |
| 5.1 - 10.0 cm | 3,278 (11.61) | 32,596 (5.70) | |
| 10.1 cm+ | 419 (1.48) | 4,348 (0.76) | |
| Diagnosis confirmed but size undefined | 380 (1.35) | 8,275 (1.45) | |
| Grade, n (%) | < 0.001 | ||
| Grade I: well differentiated; differentiated, NOS | 2,249 (7.96) | 123,875 (21.67) | |
| Grade II: moderately differentiated; intermediate differentiation | 9,560 (33.85) | 247,788 (43.36) | |
| Grade III: poorly differentiated; differentiated | 15,783 (55.88) | 187,737 (32.85) | |
| Grade IV: undifferentiated; anaplastic | 651 (2.31) | 12,139 (2.12) | |
| Immunohistochemistry (IHC) of regional lymph nodes, n (%) | < 0.001 | ||
| Nodes clinically negative, not examined pathologically | 9,560 (33.85) | 275,155 (48.14) | |
| Negative on routine H and E, IHC studies done, negative for tumor | 5,233 (18.53) | 134,288 (23.50) | |
| Negative on routine H and E, IHC studies done, positive for ITCs | 349 (1.24) | 6,020 (1.05) | |
| Negative on routine H and E, IHC tumor positive, metastases not stated | 56 (0.20) | 1,115 (0.20) | |
| Not applicable | 13,045 (46.19) | 154,961 (27.11) | |
| Molecular (MOL) studies of regional lymph nodes, n (%) | < 0.001 | ||
| Nodes clinically negative, not examined pathologically | 14,212 (50.32) | 392,877 (68.74) | |
| Negative on routine H and E, RT-PCR MOL studies done, negative for tumor | 954 (3.38) | 23,175 (4.06) | |
| Negative on routine H and E, RT-PCR MOL studies done, positive for tumor | 32 (0.11) | 526 (0.09) | |
| Not applicable | 13,045 (46.19) | 154,961 (27.11) | |
| Metastasis at diagnosis, n (%) | < 0.001 | ||
| No distant metastasis | 26,949 (95.42) | 555,563 (97.21) | |
| Microscopic, < 0.2 mm without symptoms or signs of metastasis | 2 (0.01) | 27 (0.01) | |
| Stated as M0(i+) with no other information on distant metastasis | 1 (0.00) | 4 (0.00) | |
| Unilateral or bilateral axillary or cervical nodes | 122 (0.43) | 1,148 (0.20) | |
| Distant metastasis except distant lymph node(s); Carcinomatosis | 415 (1.47) | 4,848 (0.85) | |
| Skin over: axilla, contralateral (opposite) breast, sternum, upper abdomen | 13 (0.05) | 166 (0.03) | |
| Adrenal bone, lung ovary satellite nodule, or opposite breast metastasis | 512 (1.81) | 6,735 (1.18) | |
| Distant lymph nodes; carcinomatosis | 196 (0.69) | 2,506 (0.44) | |
| Distant metastasis, NOS | 33 (0.12) | 542 (0.10) | |
| Behavior, n (%) | < 0.001 | ||
| Carcinoma in situ; intraepithelial; non-infiltrating; noninvasive | 2,413 (8.54) | 84,397 (14.77) | |
| Malignant, primary site (invasive) | 25,830 (91.46) | 487,142 (85.23) | |
| Simplified stage, n (%) | < 0.001 | ||
| In situ | 2,413 (8.54) | 84,397 (14.77) | |
| Localized | 12,388 (43.86) | 322,914 (56.50) | |
| Regional | 11,512 (40.76) | 142,482 (24.93) | |
| Distant | 1,930 (6.83) | 21,746 (3.81) | |
| Size of tumor-invasive component, n (%) | < 0.001 | ||
| Entire tumor reported as invasive | 8,153 (28.87) | 159,696 (27.94) | |
| Entire tumor reported as in situ | 2,407 (8.52) | 84,191 (14.73) | |
| Invasive and in situ components present | 10,788 (38.20) | 217,644 (38.08) | |
| Invasive/in situ components present, in situ described as minimal (< 25%) | 2,376 (8.41) | 52,107 (9.12) | |
| Invasive/in situ components present, in situ described as extensive (> 25%) | 1,026 (3.63) | 13,855 (2.42) | |
| Invasive/in situ components present, proportions in situ and invasive unknown | 1,866 (6.61) | 30,050 (5.26) | |
| Unknown if invasive/in situ components present, unknown if tumor “pure” or “mixed” | 1,627 (5.76) | 13,996 (2.45) | |
| Estrogen receptor (ER) status, n (%) | < 0.001 | ||
| Positive | 18,676 (66.13) | 446,374 (78.10) | |
| Negative | 8,476 (30.01) | 97,525 (17.06) | |
| Borderline | 53 (0.19) | 714 (0.13) | |
| Unknown | 1,038 (3.68) | 26,926 (4.71) | |
| Progesterone receptor (PR) status, n (%) | < 0.001 | ||
| Positive | 16,232 (57.47) | 379,407 (66.38) | |
| Negative | 10,619 (37.60) | 155,506 (27.21) | |
| Borderline | 121 (0.43) | 2,129 (0.37) | |
| Unknown | 1,271 (4.50) | 34,497 (6.04) | |
| Human epidermal growth factor receptor 2 (HER2), n (%) | < 0.001 | ||
| Positive | 2,954 (10.46) | 32,687 (5.72) | |
| Negative | 8,366 (29.62) | 193,630 (33.88) | |
| Borderline | 229 (0.81) | 5,332 (0.93) | |
| Unknown | 1,261 (4.47) | 44,744 (7.83) | |
| Not 2010+ breast | 15,433 (54.64) | 295,146 (51.64) | |
| Breast subtype, n (%) | < 0.001 | ||
| Her2+/HR+ | 2,136 (7.56) | 22,848 (4.00) | |
| Her2+/HR- | 814 (2.88) | 9,771 (1.71) | |
| Her2-/HR+ | 6,146 (21.76) | 168,694 (29.52) | |
| Triple negative | 2,212 (7.83) | 24,654 (4.31) | |
| Unknown | 1,502 (5.32) | 50,426 (8.82) | |
| Not 2010+ breast | 15,433 (54.64) | 295,146 (51.64) | |
| High grade, n (%) | < 0.001 | ||
| Higher grade | 16,434 (58.19) | 199,876 (34.97) | |
| Lower grade | 11,809 (41.81) | 371,663 (65.03) | |
| Stage, n (%) | Younger group (0 - 39), n = 28,243 (4.709%) | Older group (40+), n = 571,539 (95.291%) | P < 0.001 |
|---|---|---|---|
| NOS: not otherwise specified. | |||
| 0 | 1,201 (4.25) | 44,979 (7.87) | |
| IA | 3,102 (10.98) | 119,099 (20.84) | |
| IB | 285 (1.01) | 5,456 (0.95) | |
| IIA | 3,152 (11.16) | 51,100 (8.94) | |
| IIB | 2,300 (8.14) | 25,060 (4.38) | |
| III NOS | 4 (0.01) | 14 (0.00) | |
| IIIA | 1,419 (5.02) | 13,959 (2.44) | |
| IIIB | 316 (1.12) | 4,322 (0.76) | |
| IIIC | 498 (1.76) | 5,741 (1.00) | |
| IV | 683 (2.42) | 8,464 (1.48) | |
| Not applicable | 25 (0.09) | 171 (0.03) | |
| Stage unknown | 31 (0.11) | 387 (0.07) | |
| Undocumented/missing | 15,227 (53.91) | 292,787 (51.23) | |
| Covariate | Odds ratio | P-value | 95% confidence interval |
|---|---|---|---|
| White race and single marital status were used as a reference in the analysis. | |||
| Race | |||
| Black | 1.660 | < 0.001 | 1.63 - 1.69 |
| American Indian/Alaska Native | 1.138 | 0.001 | 1.06 - 1.23 |
| Asian or Pacific Islander | 1.074 | < 0.001 | 1.05 - 1.10 |
| Marital status | |||
| Married (including common law) | 0.973 | 0.001 | 0.96 - 0.99 |
| Separated | 1.057 | 0.040 | 1.00 - 1.12 |
| Divorced | 1.008 | 0.483 | 0.99 - 1.03 |
| Widowed | 1.109 | < 0.001 | 1.09 - 1.13 |
| Unmarried/domestic partner | 0.853 | 0.036 | 0.73 - 0.99 |
| Age at diagnosis | 0.978 | < 0.001 | 0.98 - 0.98 |
| Constant | 2.025 | < 0.001 | 1.97 - 2.09 |
| Covariate | Odds ratio | P-value | 95% confidence interval |
|---|---|---|---|
| High grade: grades III and IV. Low grade (grades I and II), white race and single marital status were used as references in the analysis. | |||
| Younger vs older age | 2.437 | < 0.001 | 2.38 - 2.50 |
| Marital status | |||
| Married (including common law) | 0.535 | < 0.001 | 0.52 - 0.55 |
| Separated | 0.696 | < 0.001 | 0.63 - 0.77 |
| Divorced | 0.267 | < 0.001 | 0.25 - 0.28 |
| Widowed | 0.015 | < 0.001 | 0.01 - 0.02 |
| Unmarried or domestic partner | 0.898 | 0.422 | 0.69 - 1.17 |
| Race | |||
| Black | 1.318 | < 0.001 | 1.27 - 1.37 |
| American Indian/Alaska Native | 1.347 | < 0.001 | 1.16 - 1.57 |
| Asian or Pacific Islander | 1.491 | < 0.001 | 1.44 - 1.55 |
| Constant | 0.062 | < 0.001 | 0.06 - 0.06 |