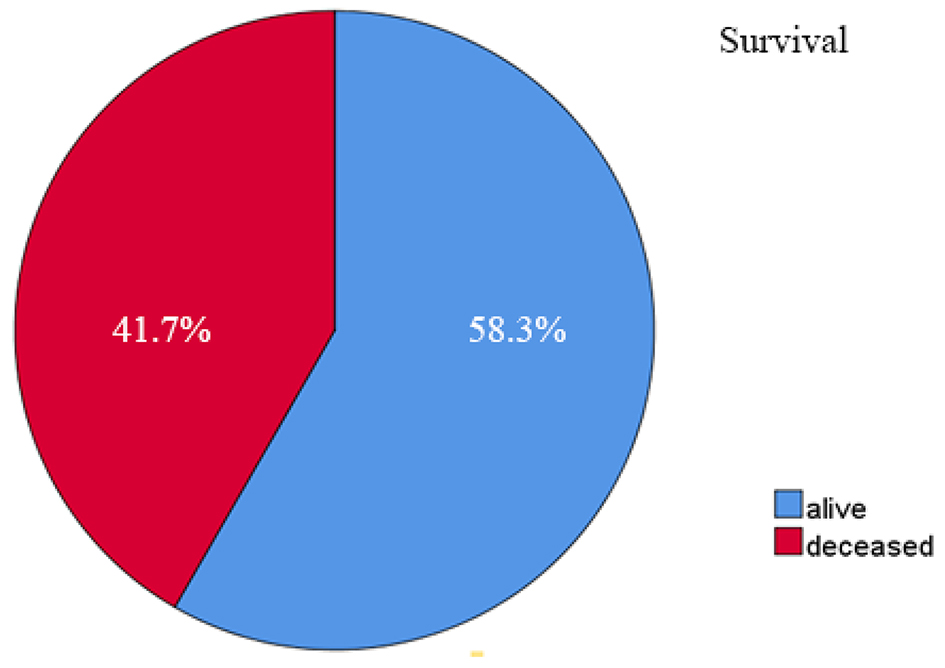
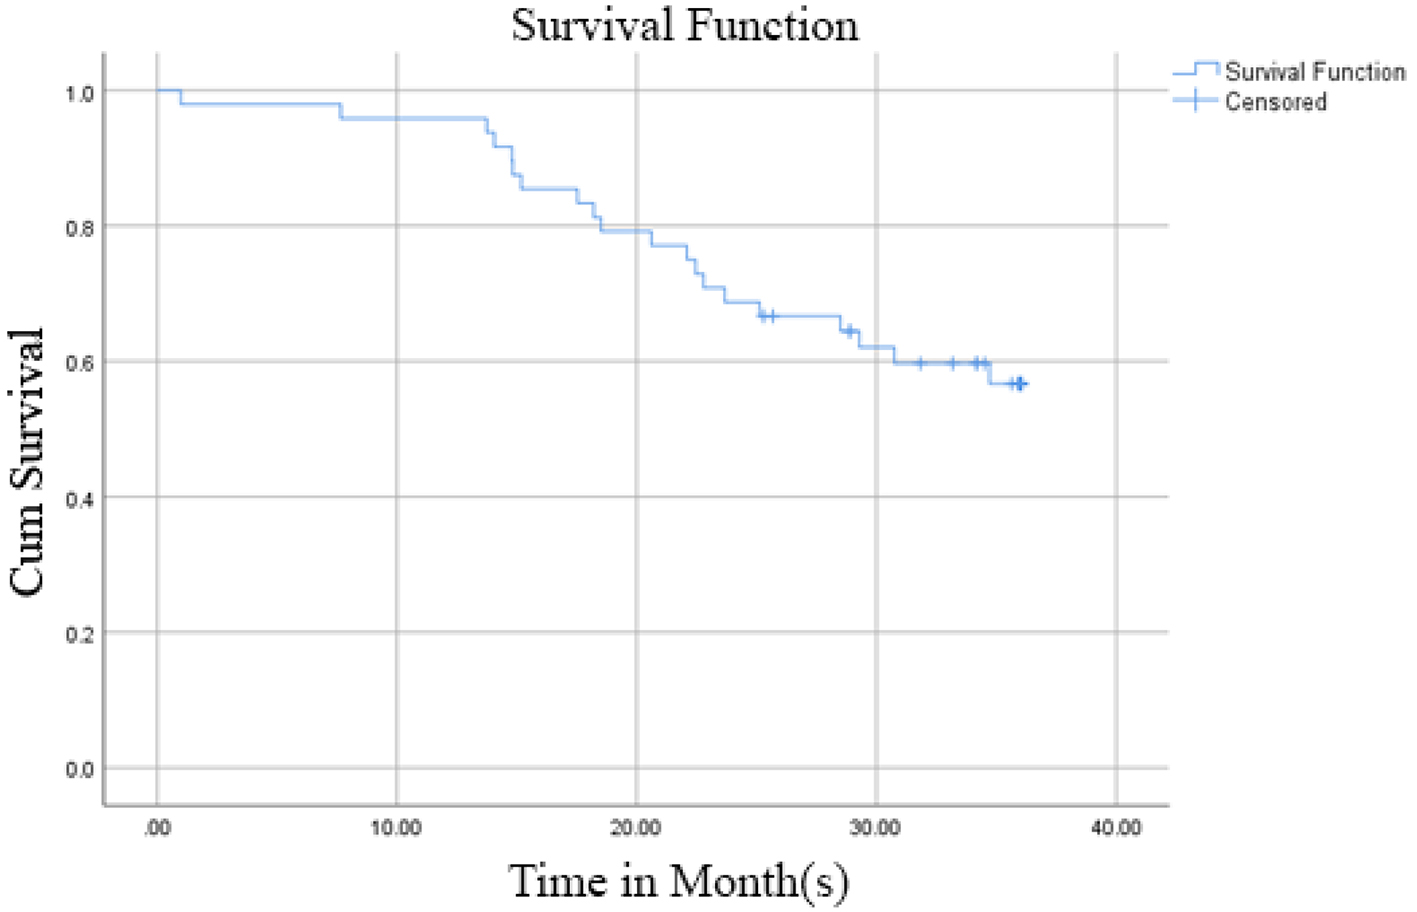
Figure 1. Three-year survival rate of 48 TNBC patients. TNBC: triple negative breast cancer.
| World Journal of Oncology, ISSN 1920-4531 print, 1920-454X online, Open Access |
| Article copyright, the authors; Journal compilation copyright, World J Oncol and Elmer Press Inc |
| Journal website https://www.wjon.org |
Original Article
Volume 11, Number 5, October 2020, pages 216-222
Overexpression of Programmed Death-Ligand 1 Receptor mRNA as an Independent Negative Prognostic Factor for Triple Negative Breast Cancer
Figures
Tables
| Characteristic | N | Percentage |
|---|---|---|
| TNBC: triple negative breast cancer; BMI: body mass index. | ||
| Age | ||
| < 50 | 21 | 43.80% |
| ≥ 50 | 27 | 56.30% |
| BMI | ||
| < 23 | 15 | 31.30% |
| ≥ 23 | 33 | 68.80% |
| Grouping stage | ||
| Early breast cancer (I, II) | 22 | 45.80% |
| Locally advanced breast cancer (IIIA-IIIC) | 26 | 54.20% |
| Histological grade | ||
| Low grade | 18 | 37.50% |
| High grade | 30 | 62.50% |
| Time interval from diagnosis to chemotherapy | ||
| < 60 days | 27 | 56.3% |
| ≥ 60 days | 21 | 43.8% |
| Chemotherapy regimen | ||
| Platinum based | 23 | 47.90% |
| Anthracycline based | 25 | 52.10% |
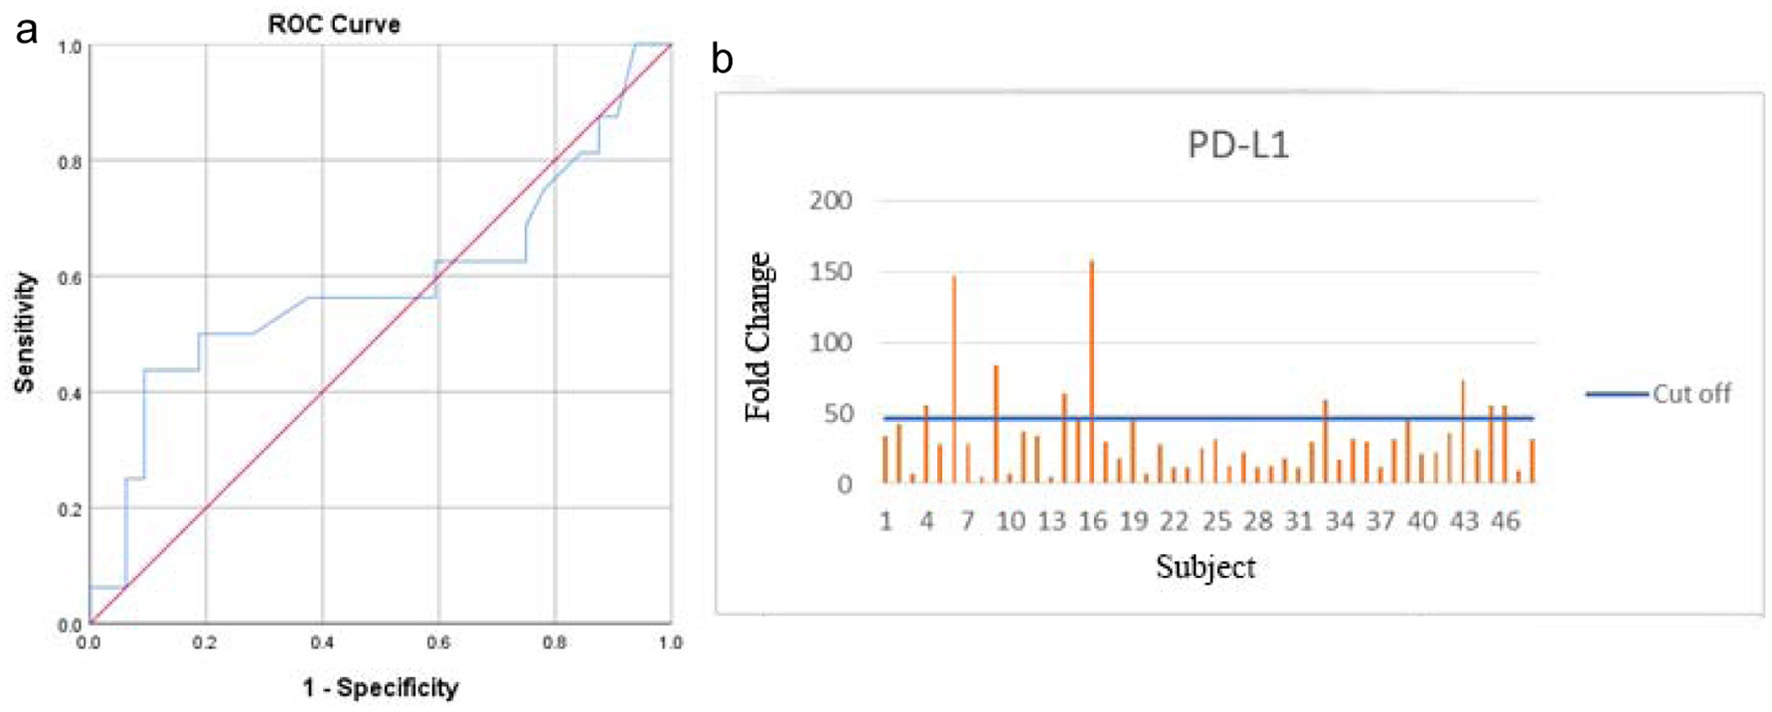
| Biomarker | Cutoff value | Sensitivity | Specificity | Youden index | AUC (95% CI) | P |
|---|---|---|---|---|---|---|
| PD-L1: programmed death-ligand 1 receptor; AUC: area under the curve; CI: confidence interval. | ||||||
| PD-L1 | 46.875 | 43.8% | 90.6% | 0.344 | 0.586 (0.394 - 0.778) | 0.336 |
| Variables | Underexpression PD-L1 | Overexpression PD-L1 | P value |
|---|---|---|---|
| PD-L1: programmed death-ligand 1 receptor; TNBC: triple negative breast cancer; BMI: body mass index. | |||
| Age | 0.654 | ||
| < 50 | 16 | 5 | |
| ≥ 50 | 22 | 5 | |
| Grouping BMI | 0.103 | ||
| < 23 | 14 | 1 | |
| ≥ 23 | 24 | 9 | |
| Grouping stage | 0.565 | ||
| Early breast cancer (I, II) | 18 | 4 | |
| Locally advanced breast cancer (IIIA-IIIC) | 20 | 6 | |
| Histological grade | 0.859 | ||
| Low grade | 14 | 4 | |
| High grade | 24 | 6 | |
| Time interval from diagnosis to chemotherapy | 0.788 | ||
| < 60 days | 21 | 6 | |
| ≥ 60 days | 17 | 4 | |
| Chemotherapy regimen | 0.763 | ||
| Platinum based | 19 | 4 | |
| Anthracycline based | 19 | 6 | |