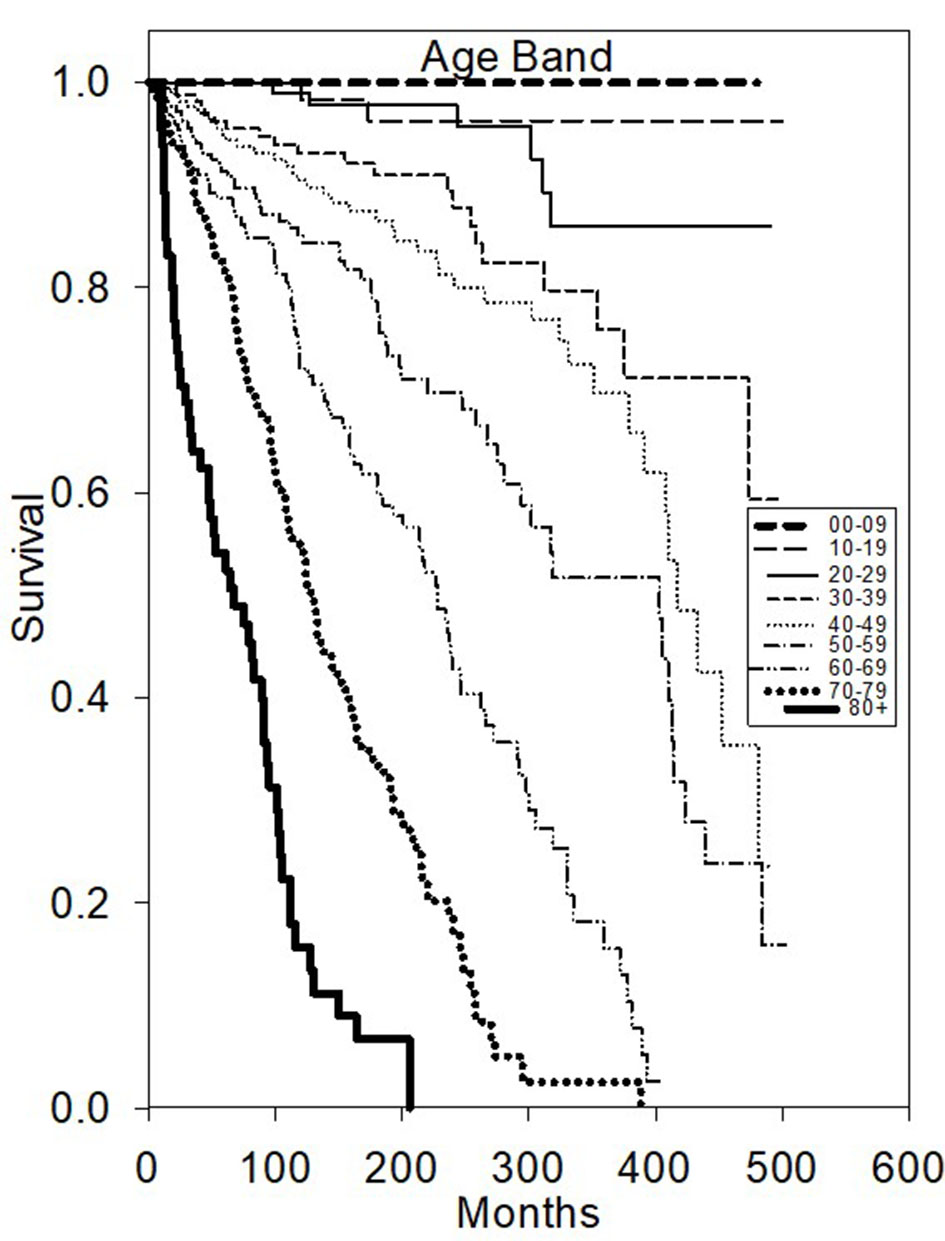
Figure 1. Kaplan-Meier survival plot of overall survival based on age diagnosed.
| World Journal of Oncology, ISSN 1920-4531 print, 1920-454X online, Open Access |
| Article copyright, the authors; Journal compilation copyright, World J Oncol and Elmer Press Inc |
| Journal website https://www.wjon.org |
Original Article
Volume 11, Number 5, October 2020, pages 188-196
Clinicopathologic Features and Survival Trends for Acinic Cell Carcinoma of the Major Salivary Glands: A Surveillance, Epidemiology, and End Results Population Analysis
Figures
Tables
| N | Median survival | Univariate | Multivariate | |||||
|---|---|---|---|---|---|---|---|---|
| Hazard ratio | Hazard ratio | |||||||
| 95% CI | Estimate | 95% CI | P value | Estimate | 95% CI | P value | ||
| “Cannot estimate” means statistically a numeric variable is not able to be calculated. aIndicates reference group. CI: confidence interval. | ||||||||
| Age bands | ||||||||
| 00 - 09 | 5 | Cannot estimate | Cannot estimate | Cannot estimate | ||||
| 10 - 19 | 85 | Cannot estimate | 0.11 | 0.01 - 0.44 | < 0.0001 | 0.11 | 0.04 - 0.3 | < 0.001 |
| 20 - 29 | 138 | Cannot estimate | 0.22 | 0.08 - 0.52 | < 0.0001 | 0.21 | 0.14 - 0.33 | < 0.001 |
| 30 - 39 | 172 | Cannot estimate | 0.6 | 0.34 - 1.04 | 0.0729 | 0.61 | 0.56 - 0.67 | < 0.001 |
| 40 - 49a | 228 | 417 ± 28.25 | Reference | Reference | ||||
| 50 - 59 | 218 | 403 ± 101.24 | 1.72 | 1.13 - 2.63 | 0.0085 | 1.72 | 1.64 - 1.8 | < 0.001 |
| 60 - 69 | 203 | 219 ± 20.67 | 4.36 | 2.90 - 6.69 | < 0.0001 | 4.54 | 4.16 - 4.97 | < 0.001 |
| 70 - 79 | 136 | 128 ± 17.12 | 8.67 | 5.64 - 13.63 | < 0.0001 | 9.42 | 8.54 - 10.41 | < 0.001 |
| 80 + | 69 | 403 ± 101.24 | 18.04 | 10.52 - 31.84 | < 0.0001 | 21.05 | 13.11 - 33.85 | < 0.001 |
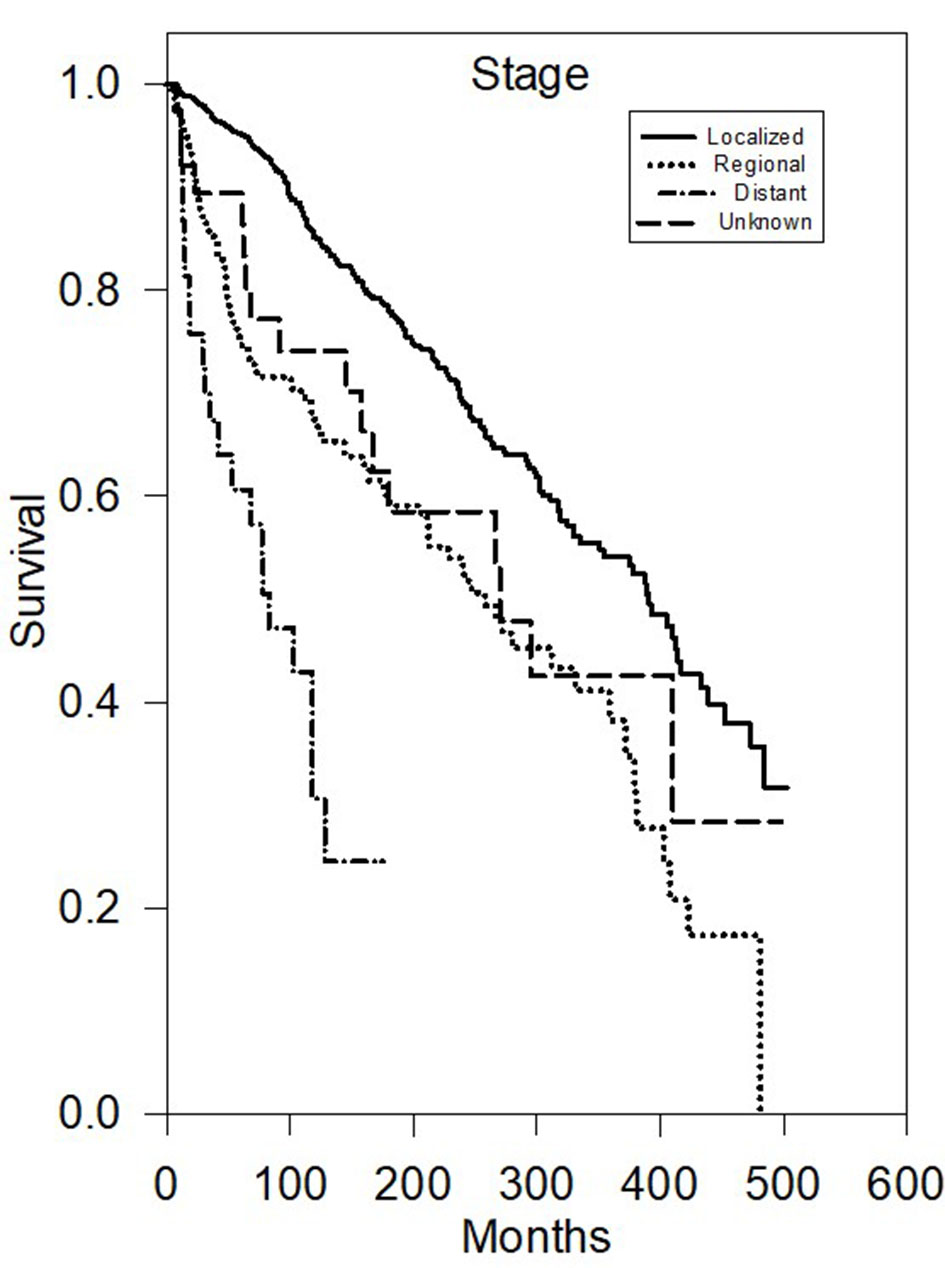
| Stage | ||||||||
| Localizeda | 947 | 391 ± 35.25 | Reference | Reference | ||||
| Regional | 196 | 258 ± 67.97 | 2.11 | 1.64 - 2.69 | < 0.0001 | 1.22 | 1.19 - 1.25 | < 0.001 |
| Distant | 39 | 83 ± 41.85 | 7.79 | 4.70 - 12.38 | < 0.0001 | 3.55 | 3.06 - 4.12 | < 0.001 |
| Unknown | 72 | 270 ± 37.2 | 1.64 | 0.94 - 2.68 | 0.0583 | 0.87 | 0.48 - 1.58 | 0.64 |
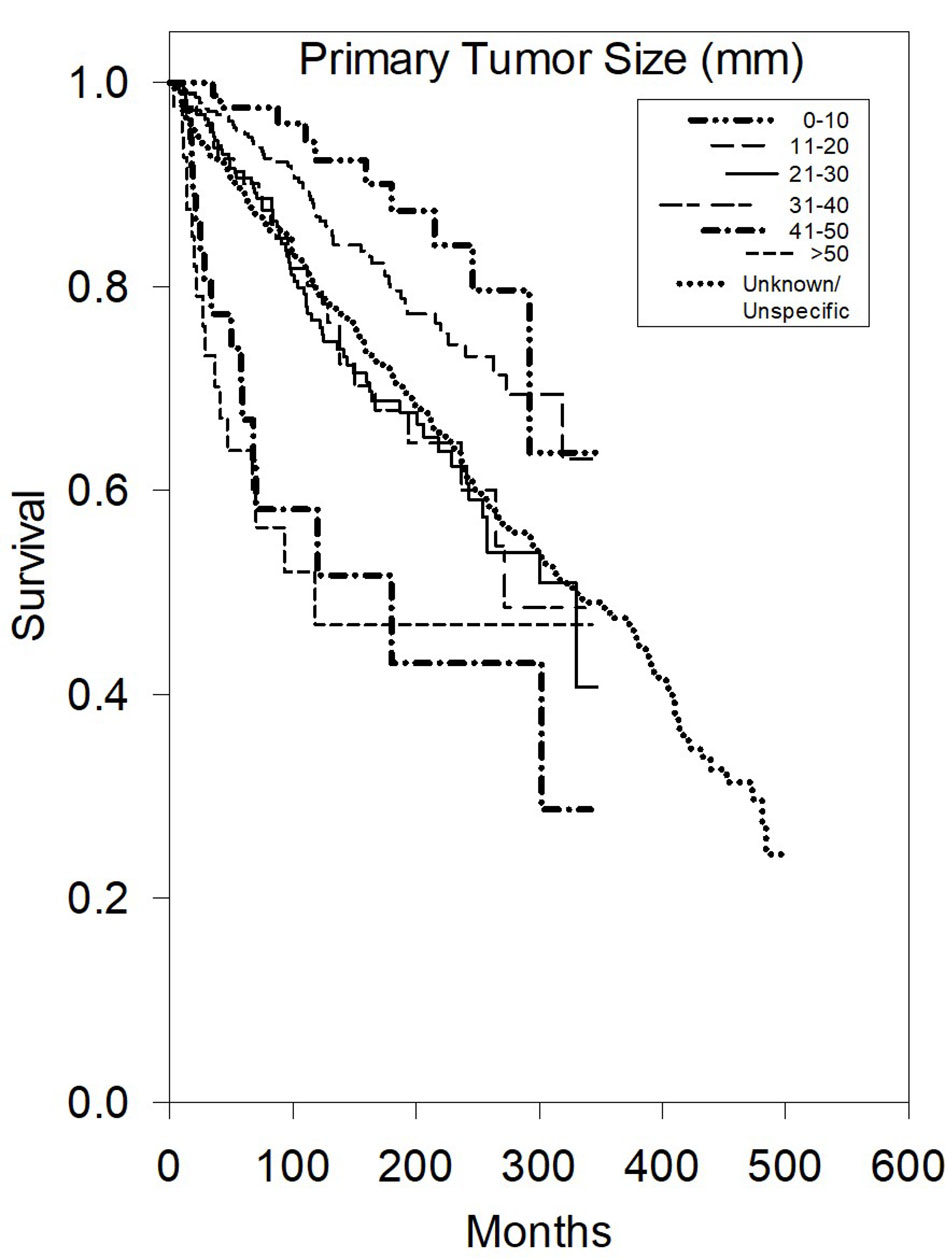
| Primary tumor size (mm) | ||||||||
| 0 - 10a | 92 | Cannot estimate | Reference | Reference | ||||
| 11 - 20 | 370 | Cannot estimate | 1.57 | 0.80 - 3.45 | 0.2378 | 1.35 | 1.06 - 1.71 | 0.02 |
| 21 - 30 | 270 | 330 ± 88.55 | 2.85 | 1.46 - 6.21 | 0.0007 | 1.57 | 1.21 - 2.02 | < 0.001 |
| 31 - 40 | 109 | Cannot estimate | 2.81 | 1.31 - 6.55 | 0.0041 | 1.02 | 0.85 - 1.22 | 0.83 |
| 41 - 50 | 42 | 180 ± 114.72 | 5.79 | 2.42 - 14.54 | < 0.0001 | 7.4 | 6.71 - 8.18 | < 0.001 |
| > 50 | 46 | Cannot estimate | 6.74 | 2.85 - 16.85 | < 0.0001 | 2.78 | 1.24 - 6.25 | 0.01 |
| Unknown/unspecific | 325 | 330 ± 49.63 | 2.59 | 1.36 - 5.54 | 0.0018 | 1.54 | 1.2 - 1.98 | < 0.001 |
| Grade | ||||||||
| Ia | 197 | 393 ± 77.06 | Reference | Reference | ||||
| II | 164 | Cannot estimate | 1.04 | 0.64 - 1.67 | 0.9076 | 1.01 | 0.96 - 1.05 | 0.76 |
| III/IV | 55 | 48 ± 22.99 | 5.28 | 3.23 - 8.58 | < 0.0001 | 2.5 | 2.32 - 2.7 | < 0.001 |
| Unknown | 838 | 375 ± 36.82 | 1.14 | 0.82 - 1.61 | 0.4775 | 1.21 | 0.86 - 1.69 | 0.27 |
| Race | ||||||||
| American Indian/Alaska Native | 5 | Cannot estimate | 1.73 | 0.21 - 6.33 | 0.3238 | 9.47 | 2.20 - 40.73 | 0.003 |
| Asian or Pacific Islander | 97 | Cannot estimate | 0.57 | 0.32 - 0.94 | 0.0266 | 0.78 | 0.46 - 1.30 | 0.336 |
| Black | 96 | 379 ± 80.34 | 0.78 | 0.48 - 1.21 | 0.319 | 1.48 | 0.93 - 2.34 | 0.098 |
| Unknown | 14 | Cannot estimate | 0.22 | 0.01 - 1.25 | 0.1425 | 1.07 | 0.14 - 8.05 | 0.949 |
| Whitea | 1,042 | 335 ± 39.77 | Reference | Reference | ||||
| Sex | ||||||||
| Femalea | 750 | 372 ± 35.5 | Reference | Reference | ||||
| Male | 504 | 351 ± 79.47 | 1.23 | 0.99 - 1.52 | 0.0544 | 1.54 | 1.24 - 1.90 | < 0.001 |
| Radiation | ||||||||
| No/unknown | 810 | 391 ± 23.66 | 0.54 | 0.44 - 0.67 | < 0.0001 | 0.36 | 0.16 - 0.83 | 0.016 |
| Yesa | 444 | 258 ± 37.77 | Reference | Reference | ||||
| Sequence | ||||||||
| Not applicablea | 819 | 389 ± 31.43 | Reference | Reference | ||||
| Radiation after surgery | 422 | 265 ± 36.43 | 1.74 | 1.39 - 2.17 | < 0.0001 | 0.52 | 0.23 - 1.20 | 0.125 |
| Radiation before surgery | 13 | Cannot estimate | 1.66 | 0.66 - 3.48 | 0.2111 | 0.67 | 0.22 - 2.04 | 0.475 |
| Surgery | ||||||||
| No | 30 | Cannot estimate | 2.35 | 1.16 - 4.28 | 0.0095 | 1.66 | 0.79 - 3.49 | 0.18 |
| Unknown | 5 | 144 ± 227.59 | 2.35 | 0.75 - 5.58 | 0.0676 | 2.83 | 1.76 - 4.54 | < 0.001 |
| Yesa | 1,219 | 372 ± 36.77 | Reference | Reference | ||||
| Diagnosis year | ||||||||
| 1975 - 1995 | 461 | 330 ± 41.09 | 1.36 | 1.06 - 1.74 | 0.0129 | 1.38 | 1.04 - 1.83 | 0.028 |
| 1996 - 2016a | 793 | Cannot estimate | Reference | Reference | ||||
| Surgery type | ||||||||
| Excisiona | 1,204 | 372 ± 36.48 | Reference | Variable not used in multivariate analysis | ||||
| Limited surgical procedure/biopsy | 15 | 58 ± 17.67 | 3.51 | 1.17 - 10.54 | 0.0005 | |||
| None | 30 | Cannot estimate | 2.43 | 1.20 - 4.43 | 0.0076 | |||
| Unknown | 5 | 144 ± 227.59 | 2.38 | 0.76 - 5.67 | 0.0643 | |||
| Diagnosis year | ||||||||
| 1975 - 1984 | 157 | 351 ± 64 | 1.25 | 0.74 - 2.09 | 0.3781 | Variable not used in multivariate analysis | ||
| 1985 - 1994 | 264 | 319 ± 42.61 | 1.89 | 1.24 - 2.90 | 0.0021 | |||
| 1995 - 2004 | 356 | Cannot estimate | 1.32 | 0.87 - 2.02 | 0.1972 | |||
| 2005 - 2016a | 477 | Cannot estimate | Reference | |||||
| N | Median survival | Univariate | Multivariate | |||||
|---|---|---|---|---|---|---|---|---|
| Hazard ratio | Hazard ratio | |||||||
| 95% CI | Estimate | 95% CI | P value | Estimate | 95% CI | P value | ||
| “Cannot estimate” means statistically a numeric variable is not able to be calculated. aIndicates reference group. CI: confidence interval. | ||||||||
| Age bands | ||||||||
| 00 - 09 | 5 | Cannot estimate | Cannot estimate | Cannot estimate | ||||
| 10 - 19 | 85 | Cannot estimate | 0 | 0.00 - 0.44 | 0.0011 | Cannot estimate | ||
| 20 - 29 | 138 | Cannot estimate | 0.14 | 0.02 - 0.58 | 0.0012 | Cannot estimate | ||
| 30 - 39 | 172 | Cannot estimate | 0.4 | 0.14 - 0.98 | 0.0356 | Cannot estimate | ||
| 40 - 49a | 228 | Cannot estimate | Reference | Reference | ||||
| 50 - 59 | 218 | Cannot estimate | 1.16 | 0.60 - 2.23 | 0.6457 | Cannot estimate | ||
| 60 - 69 | 203 | Cannot estimate | 2.04 | 1.11 - 3.85 | 0.0197 | Cannot estimate | ||
| 70 - 79 | 136 | Cannot estimate | 2.05 | 1.01 - 4.18 | 0.0326 | Cannot estimate | ||
| 80 + | 69 | Cannot estimate | 8.47 | 4.19-17.50 | < 0.0001 | Cannot estimate | ||
| Stage | ||||||||
| Localizeda | 947 | Cannot estimate | Reference | Reference | ||||
| Regional | 196 | Cannot estimate | 4.11 | 2.73 - 6.17 | < 0.0001 | 1.84 | 1.18 - 2.86 | 0.007 |
| Distant | 39 | Cannot estimate | 13.84 | 6.73 - 26.73 | < 0.0001 | 4.48 | 2.24 - 8.96 | < 0.001 |
| Unknown | 72 | Cannot estimate | 2.07 | 0.65 - 5.11 | 0.1078 | 1.17 | 0.42 - 3.30 | 0.762 |
| Primary tumor size (mm) | ||||||||
| 0 - 10a | 92 | Cannot estimate | Reference | Reference | ||||
| 11 - 20 | 370 | Cannot estimate | 2.05 | 0.48 - 18.43 | 0.5565 | 1.46 | 0.65 - 3.26 | 0.36 |
| 21 - 30 | 270 | Cannot estimate | 4.85 | 1.20 - 42.39 | 0.0157 | 2 | 0.46 - 8.65 | 0.35 |
| 31 - 40 | 109 | Cannot estimate | 2.81 | 1.31 - 6.55 | 0.0041 | 1.25 | 0.64 - 2.47 | 0.51 |
| 41 - 50 | 42 | Cannot estimate | 15.99 | 3.37 - 151.34 | < 0.0001 | 11.52 | 5.91 - 22.44 | < 0.001 |
| > 50 | 46 | Cannot estimate | 14.79 | 2.86 - 146.58 | 0.0002 | 3.84 | 2.06 - 7.17 | < 0.001 |
| Unknown/unspecific | 325 | Cannot estimate | 5.38 | 1.41 - 45.81 | 0.0051 | 2.76 | 1.12 - 6.83 | 0.03 |
| Grade | ||||||||
| Ia | 197 | Cannot estimate | Reference | Reference | ||||
| II | 164 | Cannot estimate | 0.79 | 0.31 - 1.93 | 0.6817 | 0.96 | 0.41 - 2.28 | 0.93 |
| III/IV | 55 | 280 ± 339.83 | 8.36 | 4.10 - 17.49 | < 0.0001 | 3.2 | 3.16 - 3.24 | < 0.001 |
| Unknown | 838 | Cannot estimate | 1.04 | 0.59 - 1.94 | > 0.9999 | 1.08 | 0.94 - 1.25 | 0.29 |
| Race | ||||||||
| American Indian/Alaska Native | 5 | Cannot estimate | 4.59 | 0.55 - 17.08 | 0.0732 | 24.75 | 4.82 - 127.19 | < 0.001 |
| Asian or Pacific Islander | 97 | Cannot estimate | 0.4 | 0.11 - 1.06 | 0.0849 | 0.66 | 0.24 - 1.82 | 0.417 |
| Black | 96 | Cannot estimate | 0.6 | 0.22 - 1.35 | 0.3097 | 0.91 | 0.38 - 2.18 | 0.826 |
| Unknown | 14 | Cannot estimate | 0.7 | 0.02 - 3.98 | > 0.9999 | 1.62 | 0.17 - 15.75 | 0.676 |
| Whitea | 1,042 | Cannot estimate | Reference | Reference | ||||
| Sex | ||||||||
| Femalea | 750 | Cannot estimate | Reference | Reference | ||||
| Male | 504 | Cannot estimate | 1.58 | 1.09 - 2.29 | 0.0123 | 1.68 | 1.15 - 2.43 | 0.007 |
| Radiation | ||||||||
| No/unknown | 810 | Cannot estimate | 0.29 | 0.20 - 0.42 | < 0.0001 | 0.78 | 0.49 - 1.25 | 0.31 |
| Yesa | 444 | Cannot estimate | Reference | Reference | ||||
| Sequence | ||||||||
| Not applicablea | 819 | Cannot estimate | Reference | Reference | ||||
| Radiation after surgery | 422 | Cannot estimate | 1.74 | 1.39 - 2.17 | < 0.0001 | 0.46 | 0.15 - 1.37 | 0.163 |
| Radiation before surgery | 13 | Cannot estimate | 3.1 | 0.62 - 9.62 | 0.0797 | 0.62 | 0.13 - 3.07 | 0.558 |
| Surgery | ||||||||
| No | 30 | Cannot estimate | 2.74 | 0.87 - 6.60 | 0.0413 | 1.46 | 0.48 - 4.52 | 0.507 |
| Unknown | 5 | Cannot estimate | 3.69 | 0.44 - 13.81 | 0.1058 | 2.98 | 0.56 - 15.96 | 0.202 |
| Yesa | 1,219 | Cannot estimate | Reference | Reference | ||||
| Diagnosis year | ||||||||
| 1975 - 1995 | 461 | Cannot estimate | 1.32 | 0.88 - 1.97 | 0.1712 | 1.28 | 0.80 - 2.04 | 0.305 |
| 1996 - 2016a | 793 | Cannot estimate | Reference | Reference | ||||
| Surgery type | ||||||||
| Excisiona | 1,204 | Cannot estimate | Reference | Variable not used in multivariate analysis | ||||
| Limited surgical procedure/biopsy | 15 | Cannot estimate | 4.8 | 1.52 - 11.60 | 0.0048 | |||
| None | 30 | Cannot estimate | 2.86 | 0.91 - 6.92 | 0.0352 | |||
| Unknown | 5 | Cannot estimate | 3.79 | 0.45 - 14.17 | 0.1018 | |||
| Diagnosis year | ||||||||
| 1975 - 1984 | 157 | Cannot estimate | 1.75 | 0.85 - 3.59 | 0.1112 | Variable not used in multivariate analysis | ||
| 1985 - 1994 | 264 | Cannot estimate | 1.66 | 0.87 - 3.22 | 0.1248 | |||
| 1995 - 2004 | 356 | Cannot estimate | 1.44 | 0.78 - 2.72 | 0.2512 | |||
| 2005 - 2016a | 477 | Cannot estimate | Reference | |||||