Figures
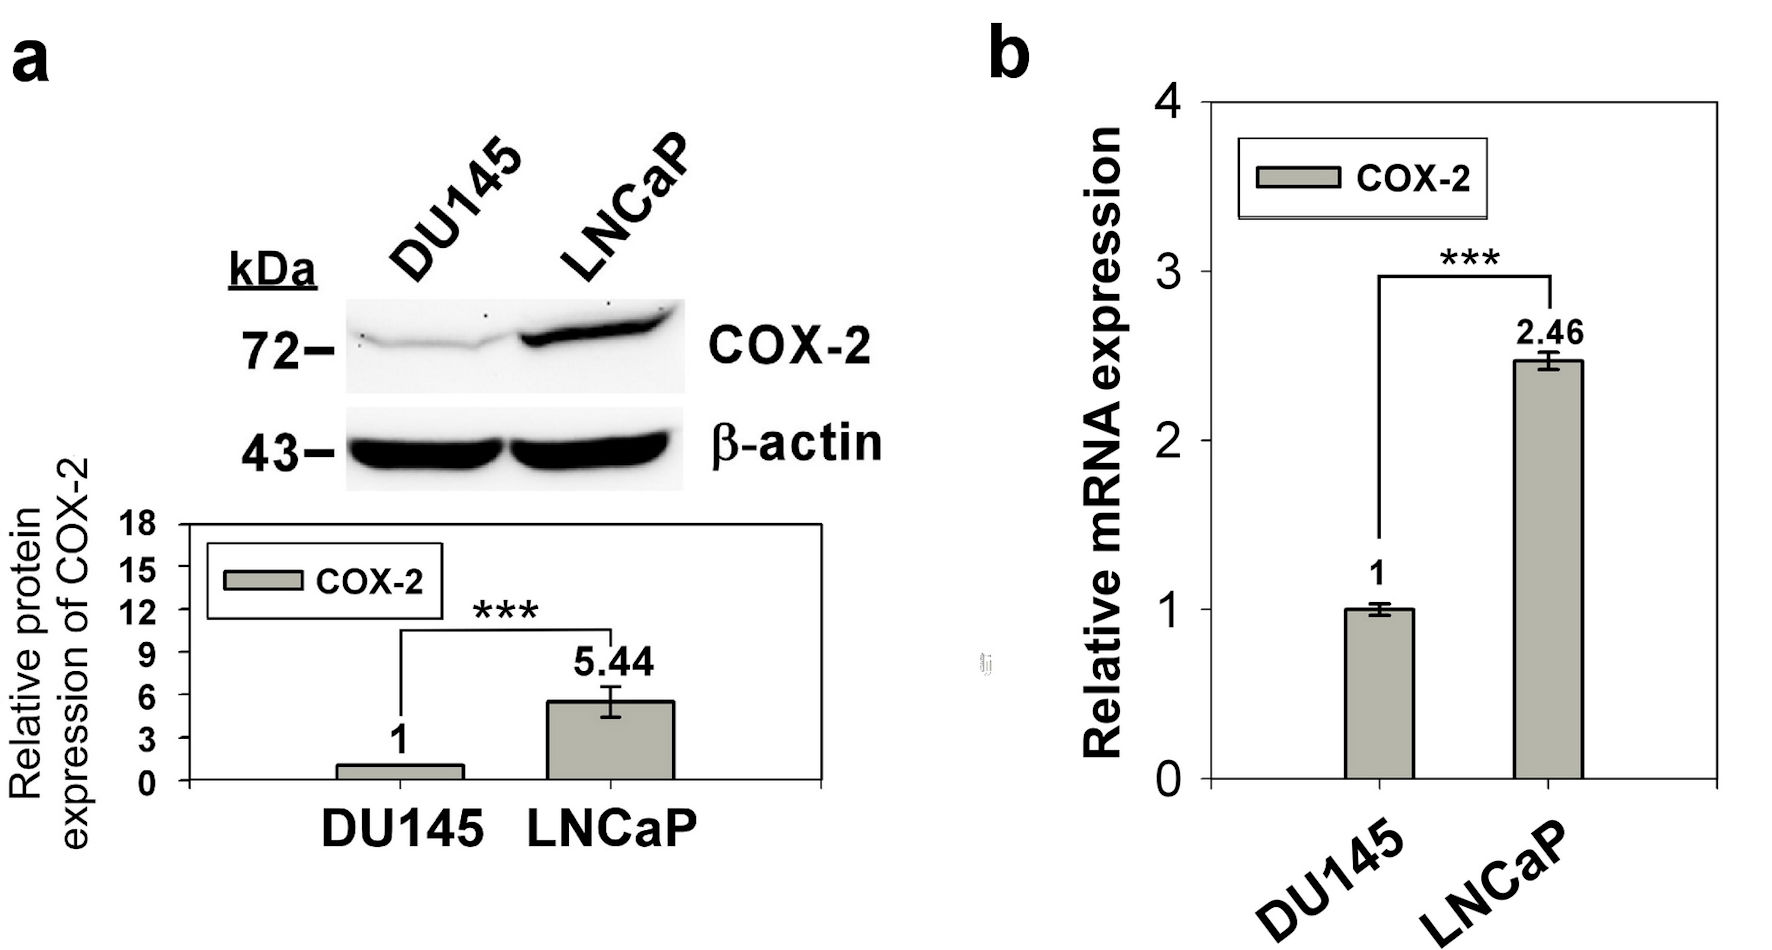
Figure 1. Expression of COX-2 in prostate normal/cancer cell lines. The protein expression of in DU145 and LNCaP cell was detect by western blotting (a) and the transcript expression was detected by qRT-PCR (b). ImageJ (version 1.53k) was used to quantify the density of bands in western blotting. The numbers under the bands indicate the relative expression, which normalized by the expression of β-actin. Experiments were performed in triplicate and repeated three times with similar results. All P values were determined by a two-tailed unpaired Student’s t-test (*P < 0.05; **P < 0.01; ***P < 0.001). COX-2: clooxygenase-2; qRT-PCR: quantitative reverse transcription polymerase chain reaction.
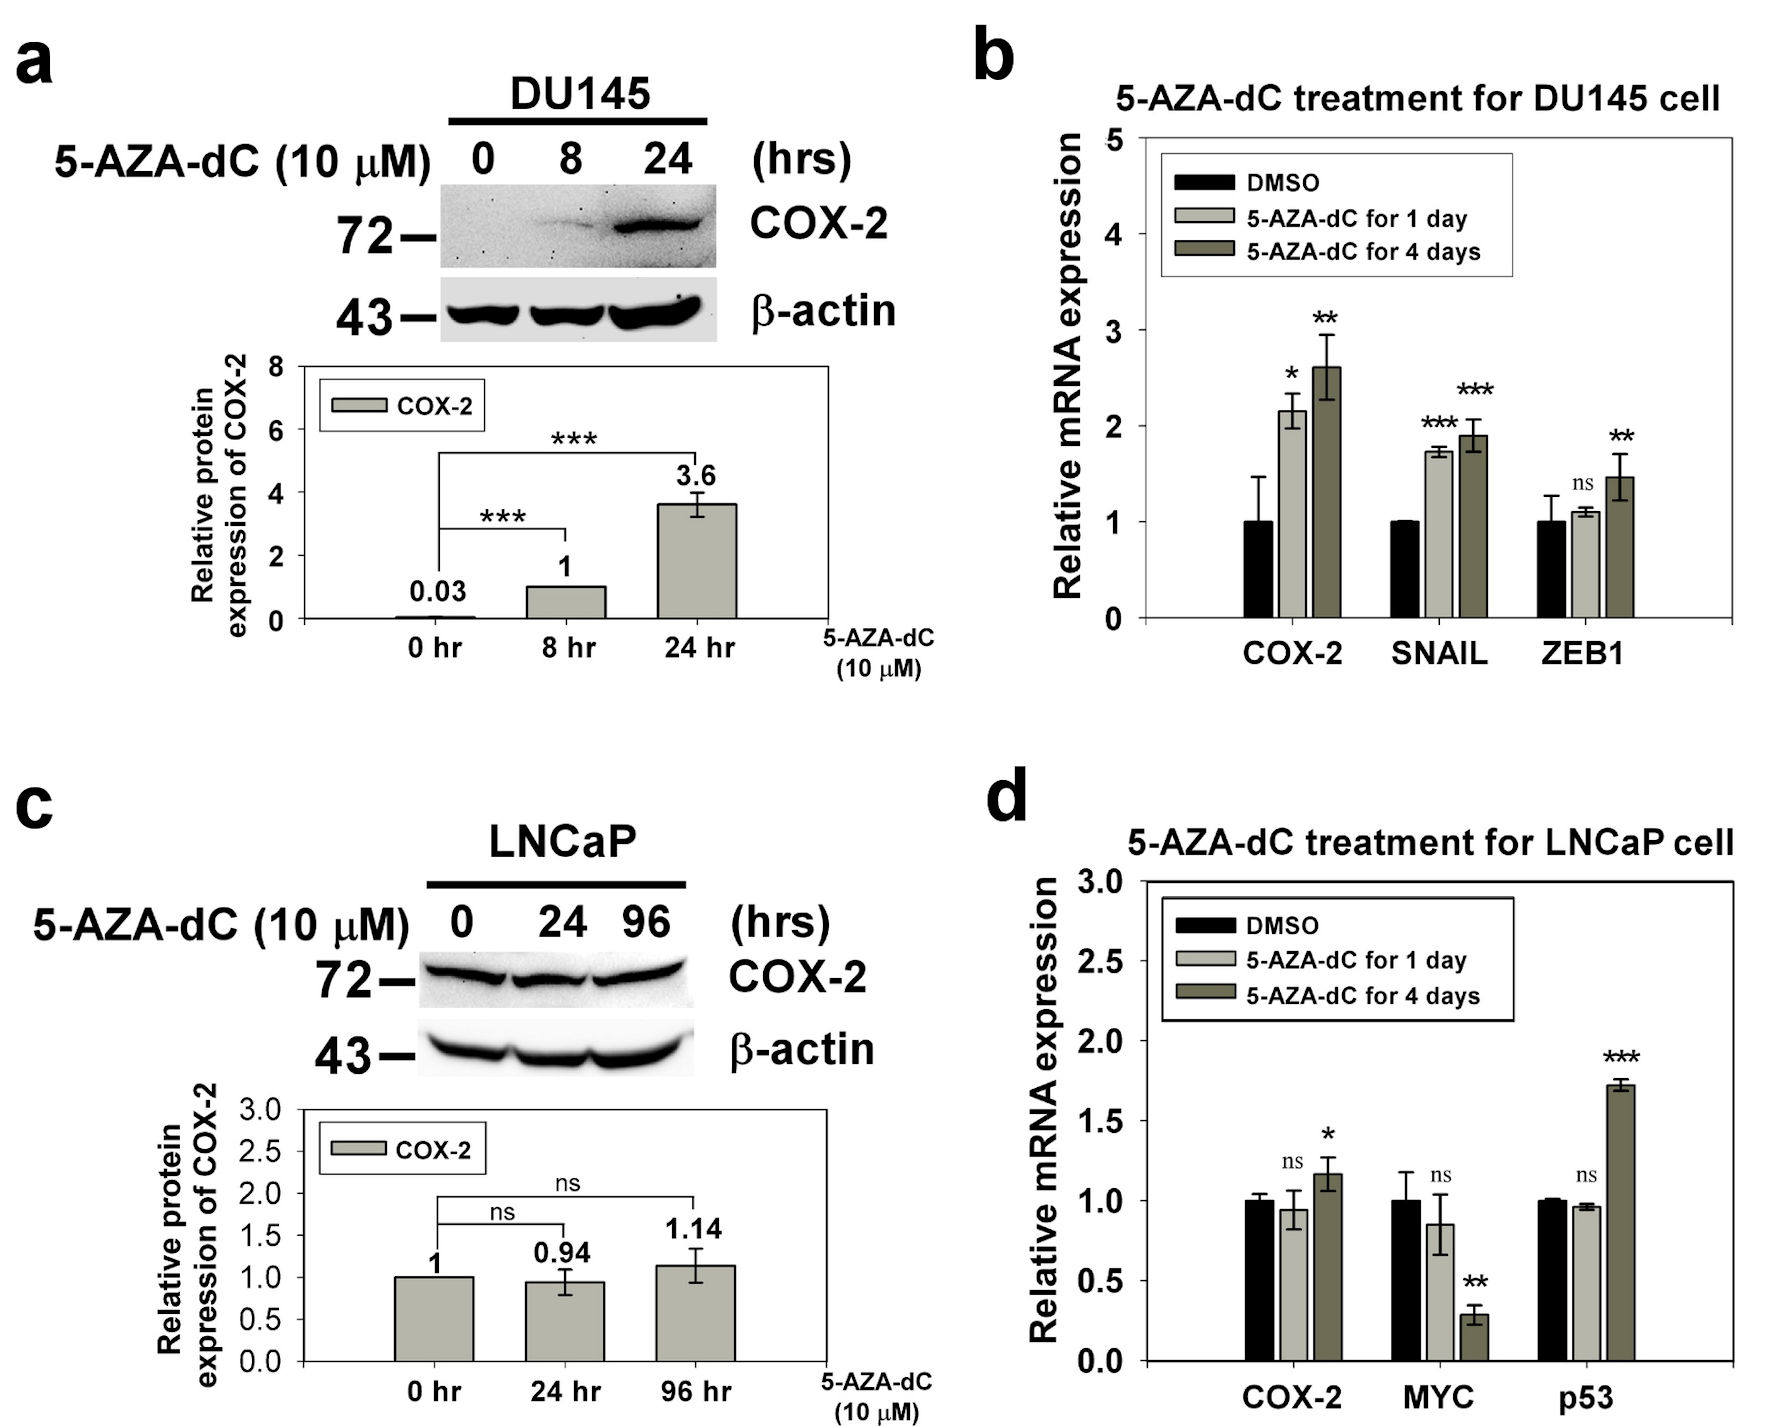
Figure 2. The expression of COX-2 in the DU145 and LNCaP cell with 5-AZA-dC treatment. DU145 and LNCaP cell were treated with 10 µM 5-AZA-dC for 1 and 4 days. The expression of COX-2 in treated cells were detected by western blotting (a, c) and qRT-PCR (b, d). SNAIL and ZEB1 were positive control of 5-AZA-dC treatment in DU145 cell. p53 and MYC were positive control and negative control of 5-AZA-dC treatment in LNCaP cell, respectively. ImageJ (version 1.53k) was used to quantify the density of bands in western blotting. The numbers under the bands indicate the relative expression, which was normalized by the expression of β-actin. Experiments were performed in triplicate and repeated three times with similar results. All P values were determined by a two-tailed unpaired Student’s t-test (*P < 0.05; **P < 0.01; ***P < 0.001). COX-2: clooxygenase-2; qRT-PCR: quantitative reverse transcription polymerase chain reaction; 5-AZA-dC: 5-aza-2′-deoxycytidine; DMSO: dimethylsulfoxide.
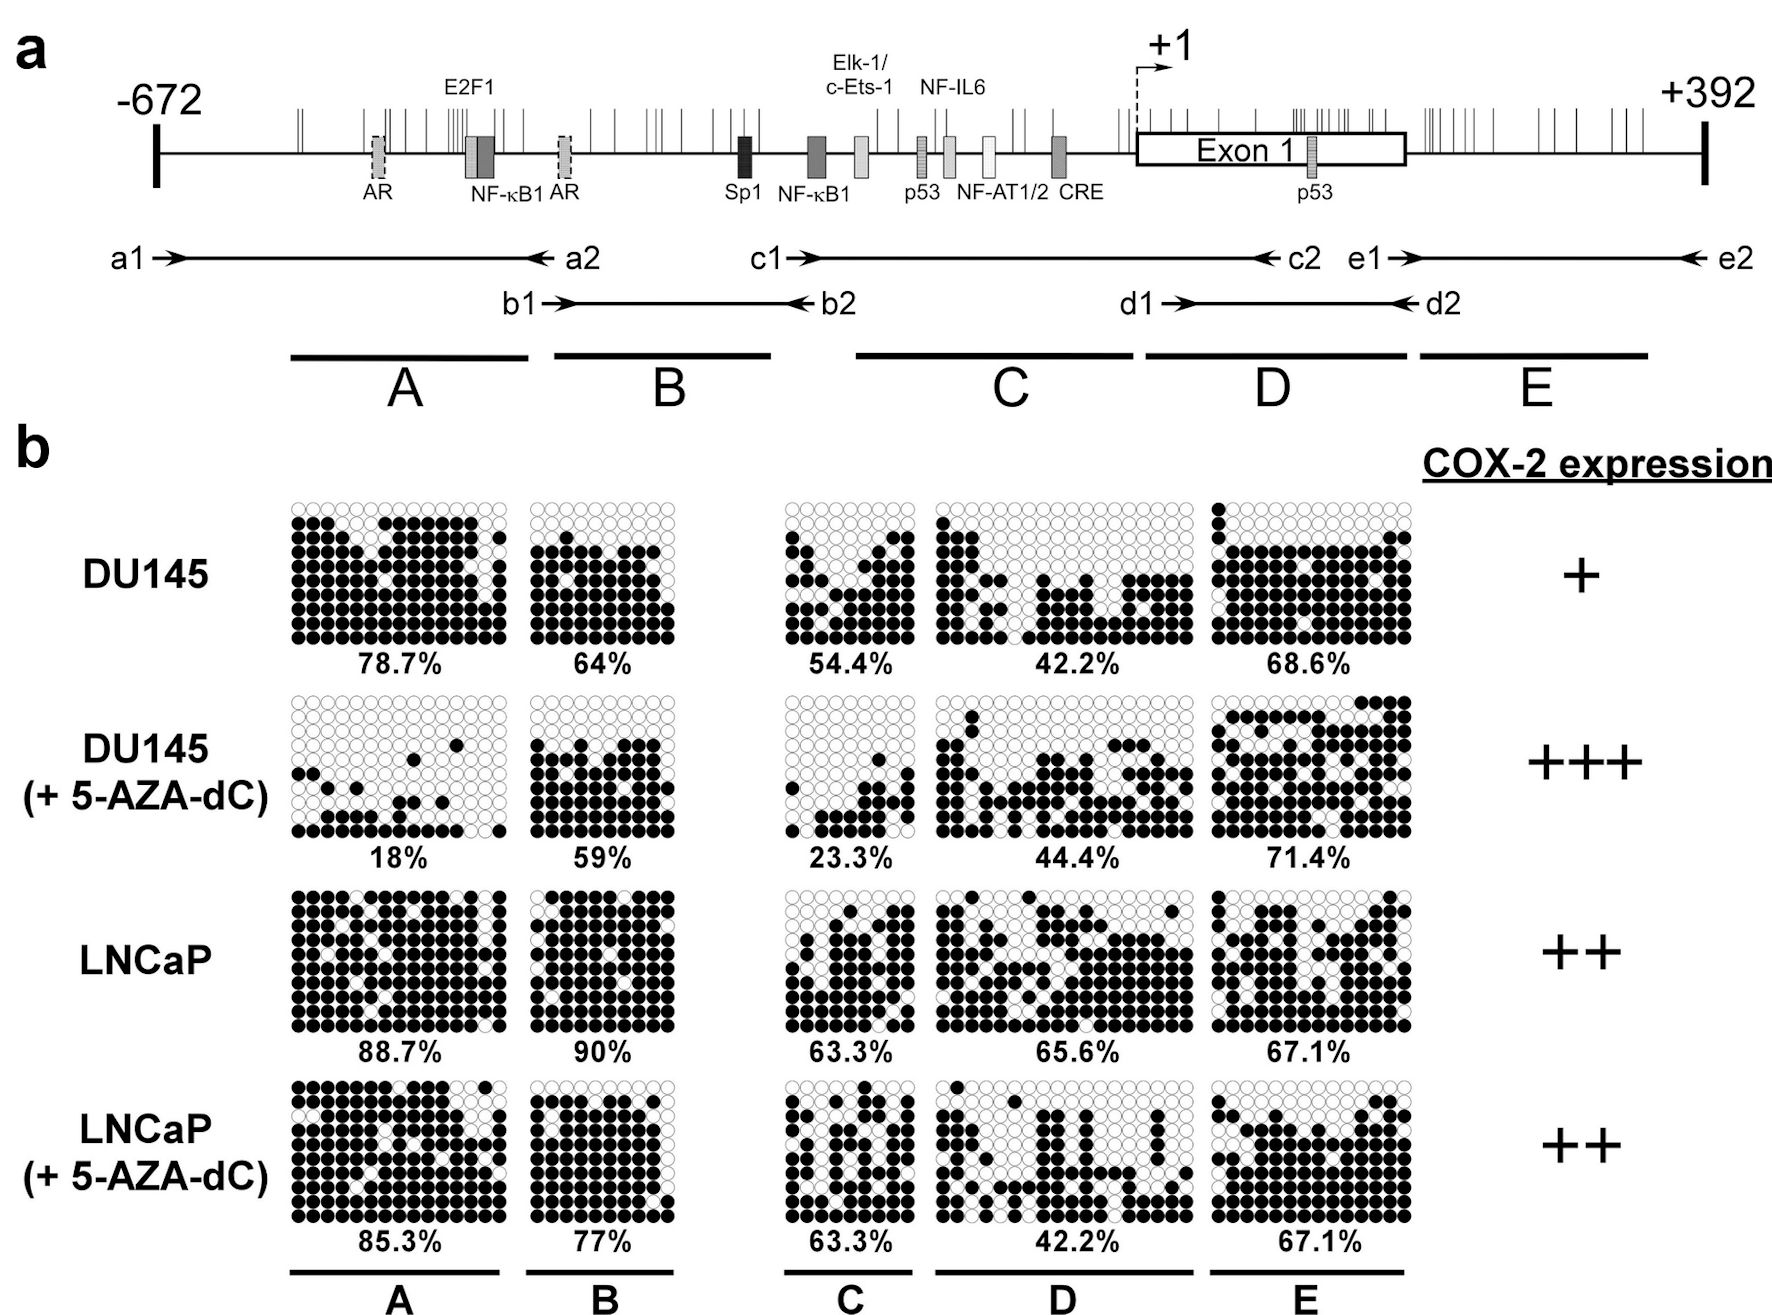
Figure 3. The methylation status of CpG islands at COX-2 promoter (-672 to +392) in prostate cancer cells. Schematic representation of the CpG islands (a). Horizontal bars indicate the location of CpG sites. CpG island was divided into five regions (A - E) defined by the specific primer sets used for PCR amplification (Table 2). The approximate locations and directions of the primers for each region are indicated by arrows denoted according to the segments to be amplified. The methylated sites of DU145 and LNCaP cell were detected by bisulfite sequencing (b). Each row of circles represents a single plasmid cloned and sequenced from PCR products generated from amplification of bisulfite-treated DNA. ○: unmethylated cytosines; •: methylated cytosines. The percentage of methylation rate is indicated below. COX-2: clooxygenase-2; PCR: polymerase chain reaction; 5-AZA-dC: 5-aza-2′-deoxycytidine.
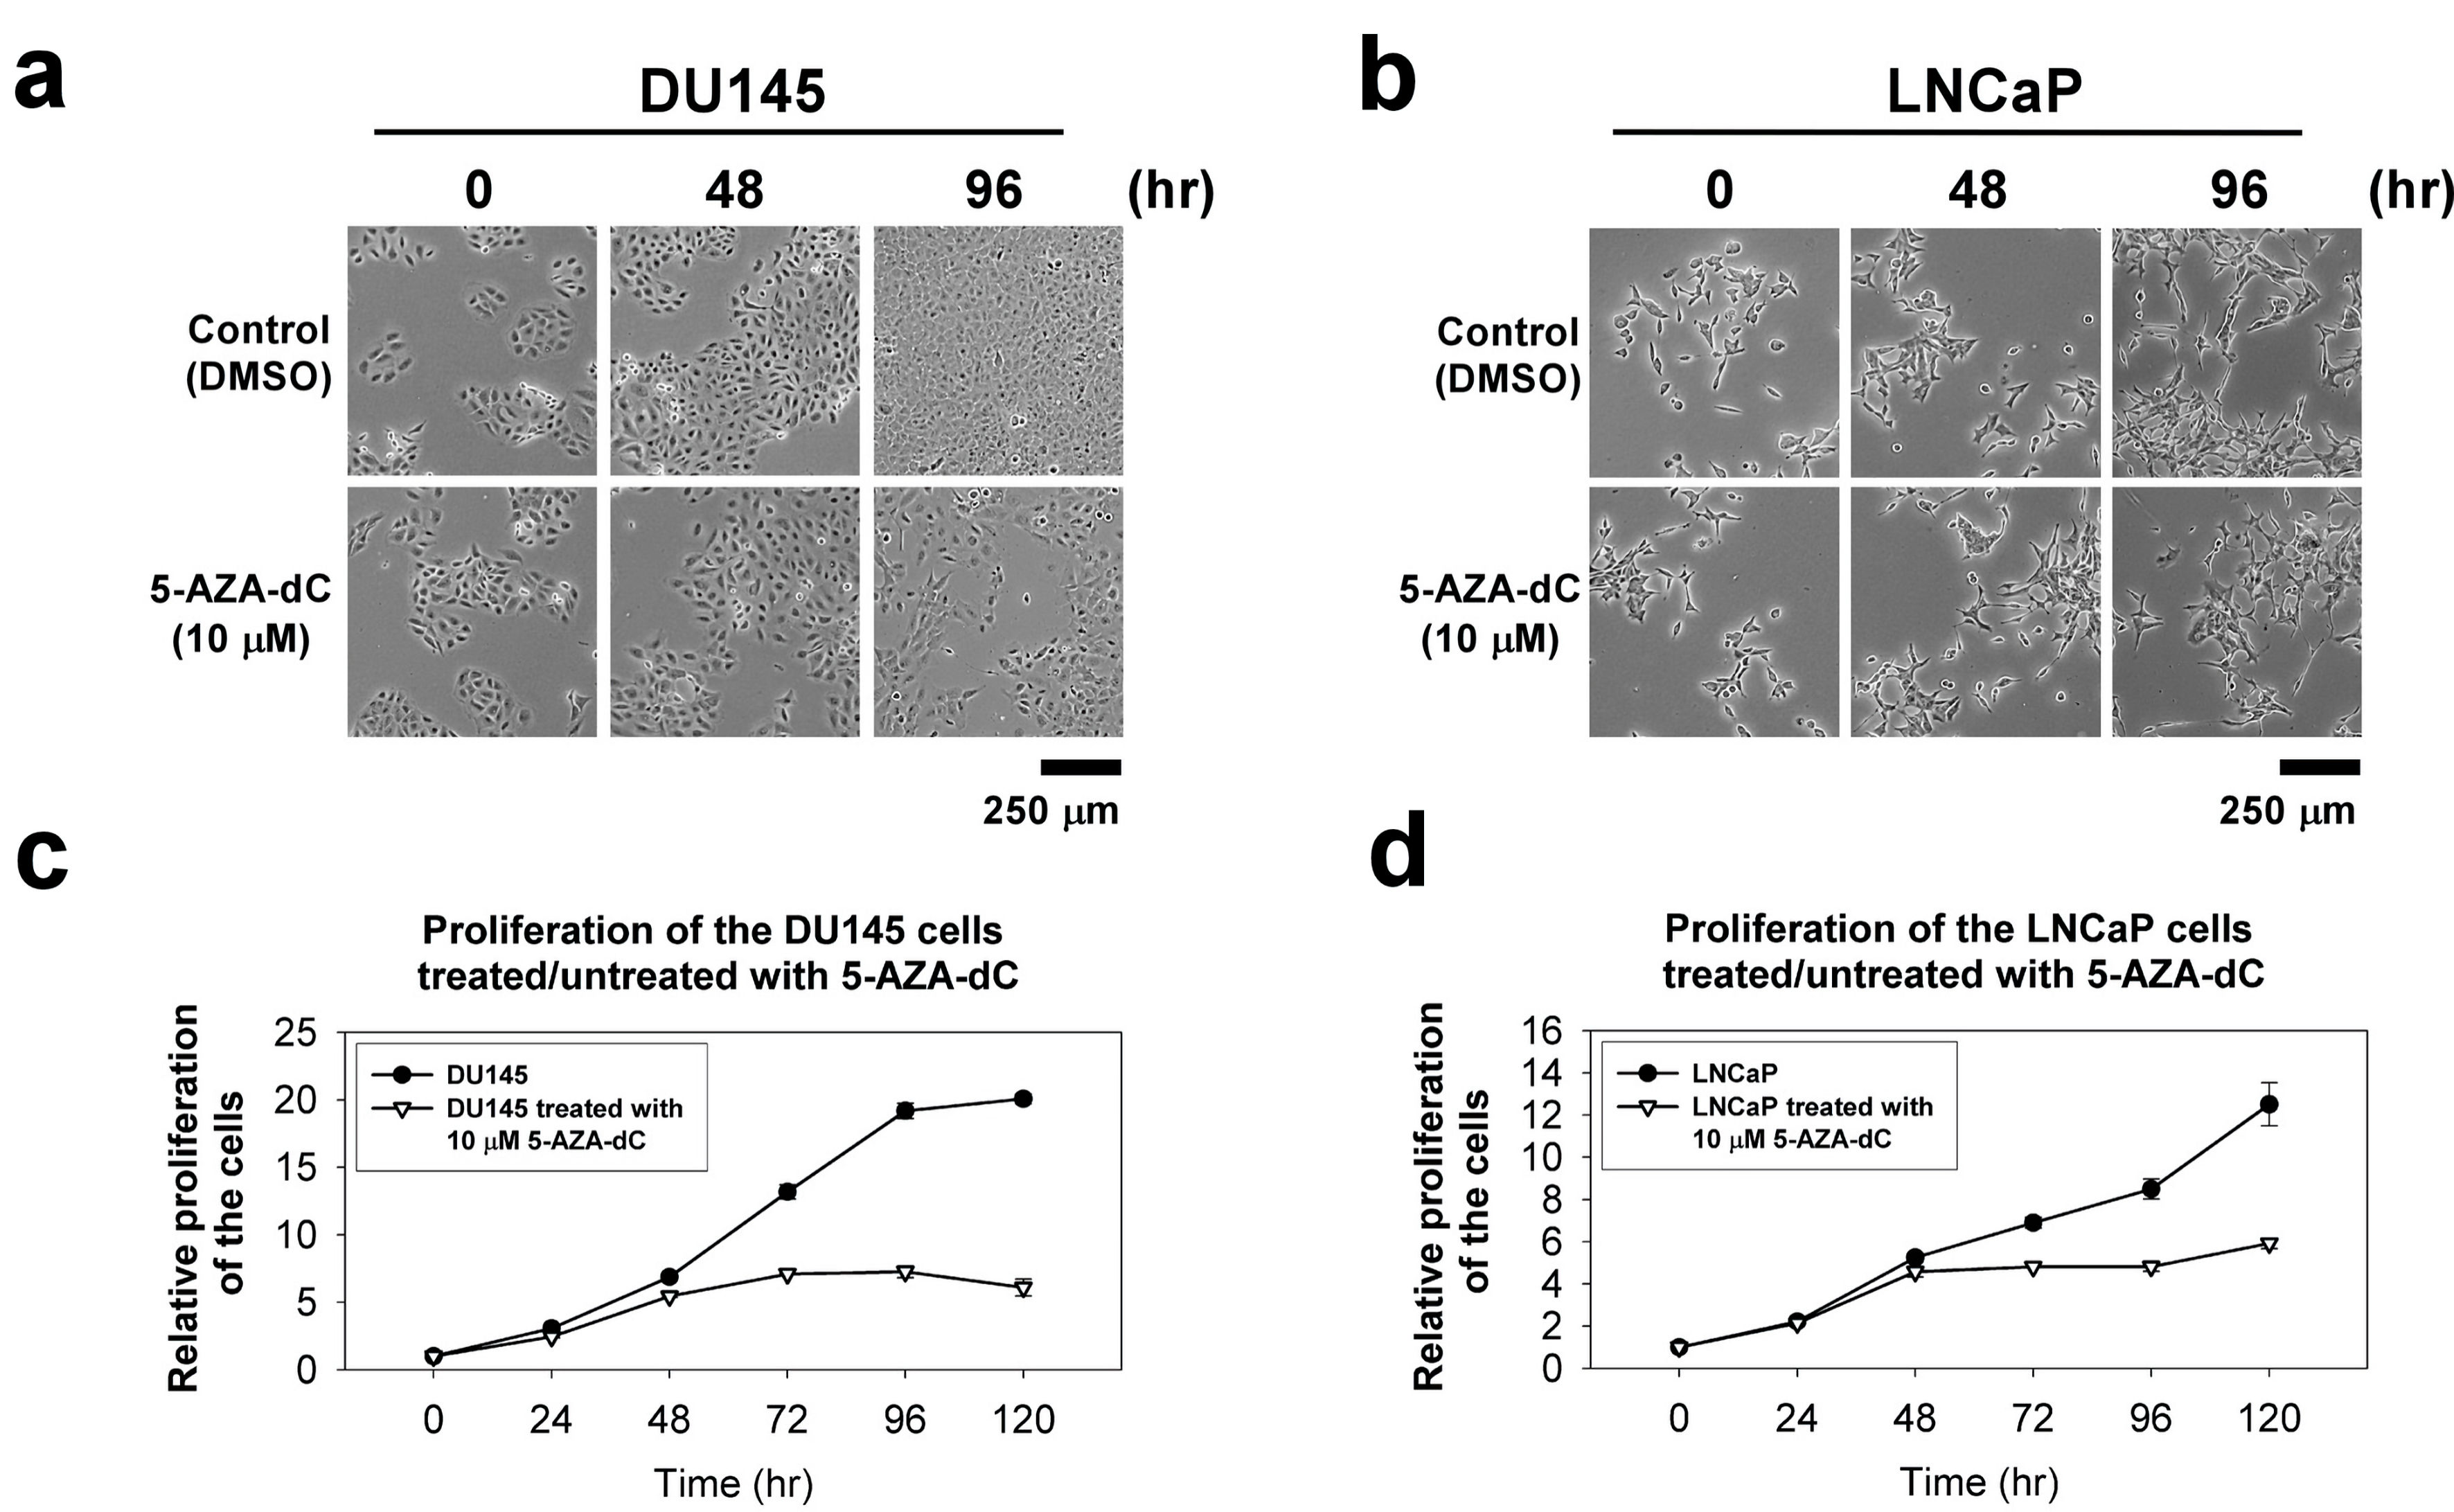
Figure 4. The cellular morphology and cell proliferation of DU145 and LNCaP cells treated/untreated with 10 µM 5-AZA-dC. Cells (1 × 10³ cells) were seeded into a well of a standard 96-well plate and grown for 120 h in normal serum medium with/without 10 µM 5-AZA-dC. The cellular morphology of the cells was showed at indicated time point (a and b). The proliferation of the cells was measured by CCK-8 for 120 h (c and d). The data were presented as the mean ± SD of three independent experiments. CCK-8: Cell Counting Kit-8; 5-AZA-dC: 5-aza-2′-deoxycytidine; SD: standard deviation.
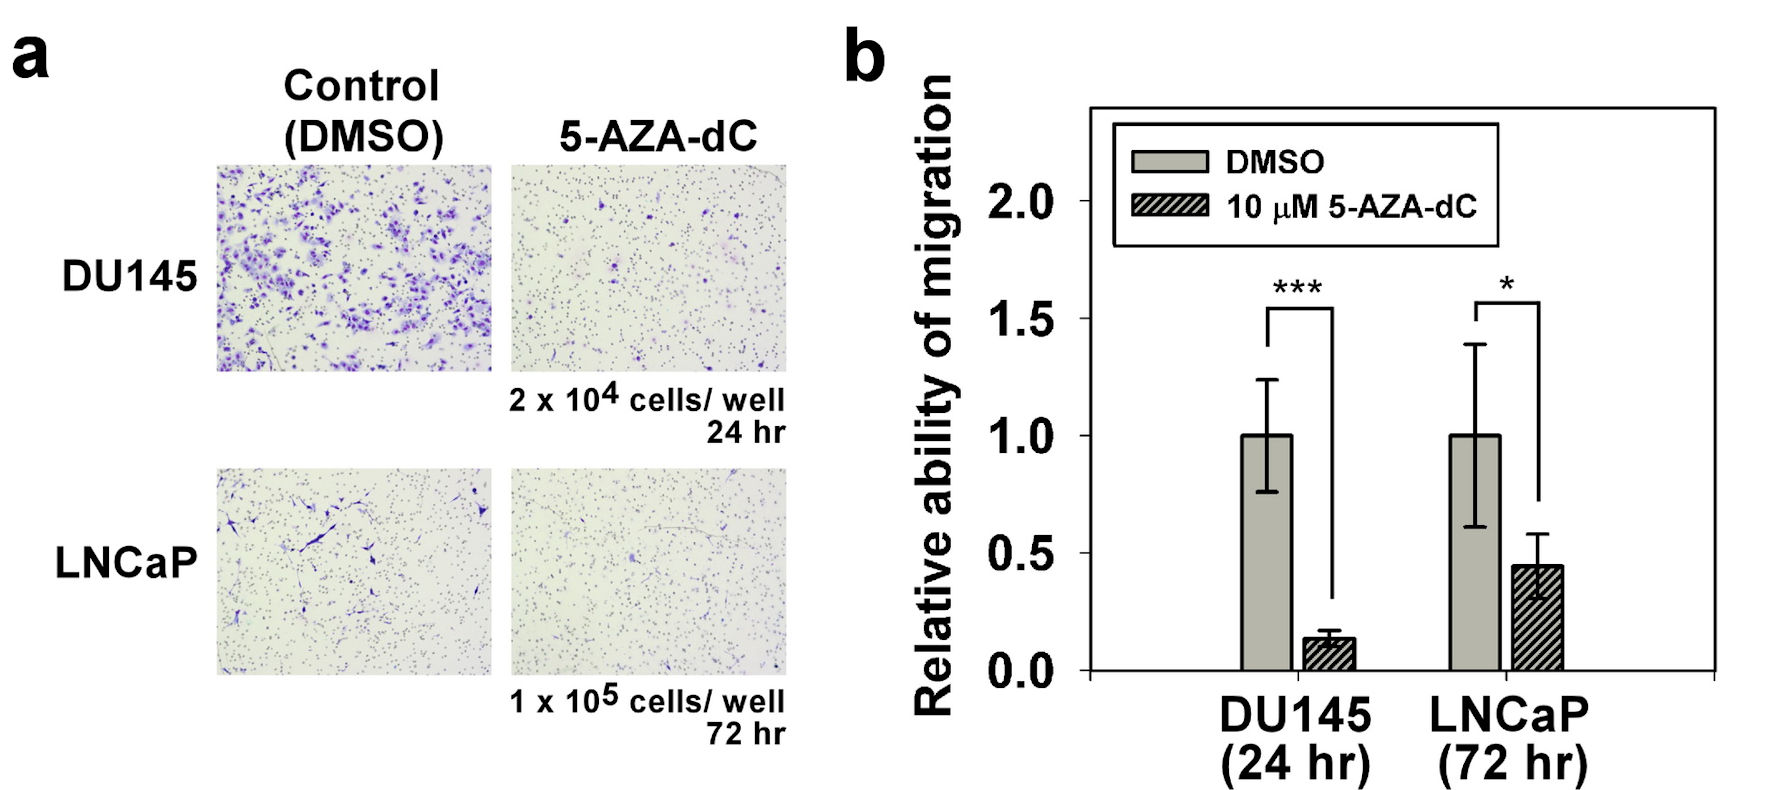
Figure 5. Migration assay of DU145 and LNCaP cells with/without 5-AZA-dC treatment. Transwell® assay was performed to assess the cell migration ability of DU145 and LNCaP cells with/without 10 µM 5-AZA-dC treatment. Cells were seeded into a transwell, and then cultured for indicated time point. Migrated cells were visualized by Giemsa staining. All P values were determined by a two-tailed unpaired Student’s t-test (*P < 0.05; **P < 0.01; ***P < 0.001). 5-AZA-dC: 5-aza-2′-deoxycytidine; DMSO: dimethylsulfoxide.
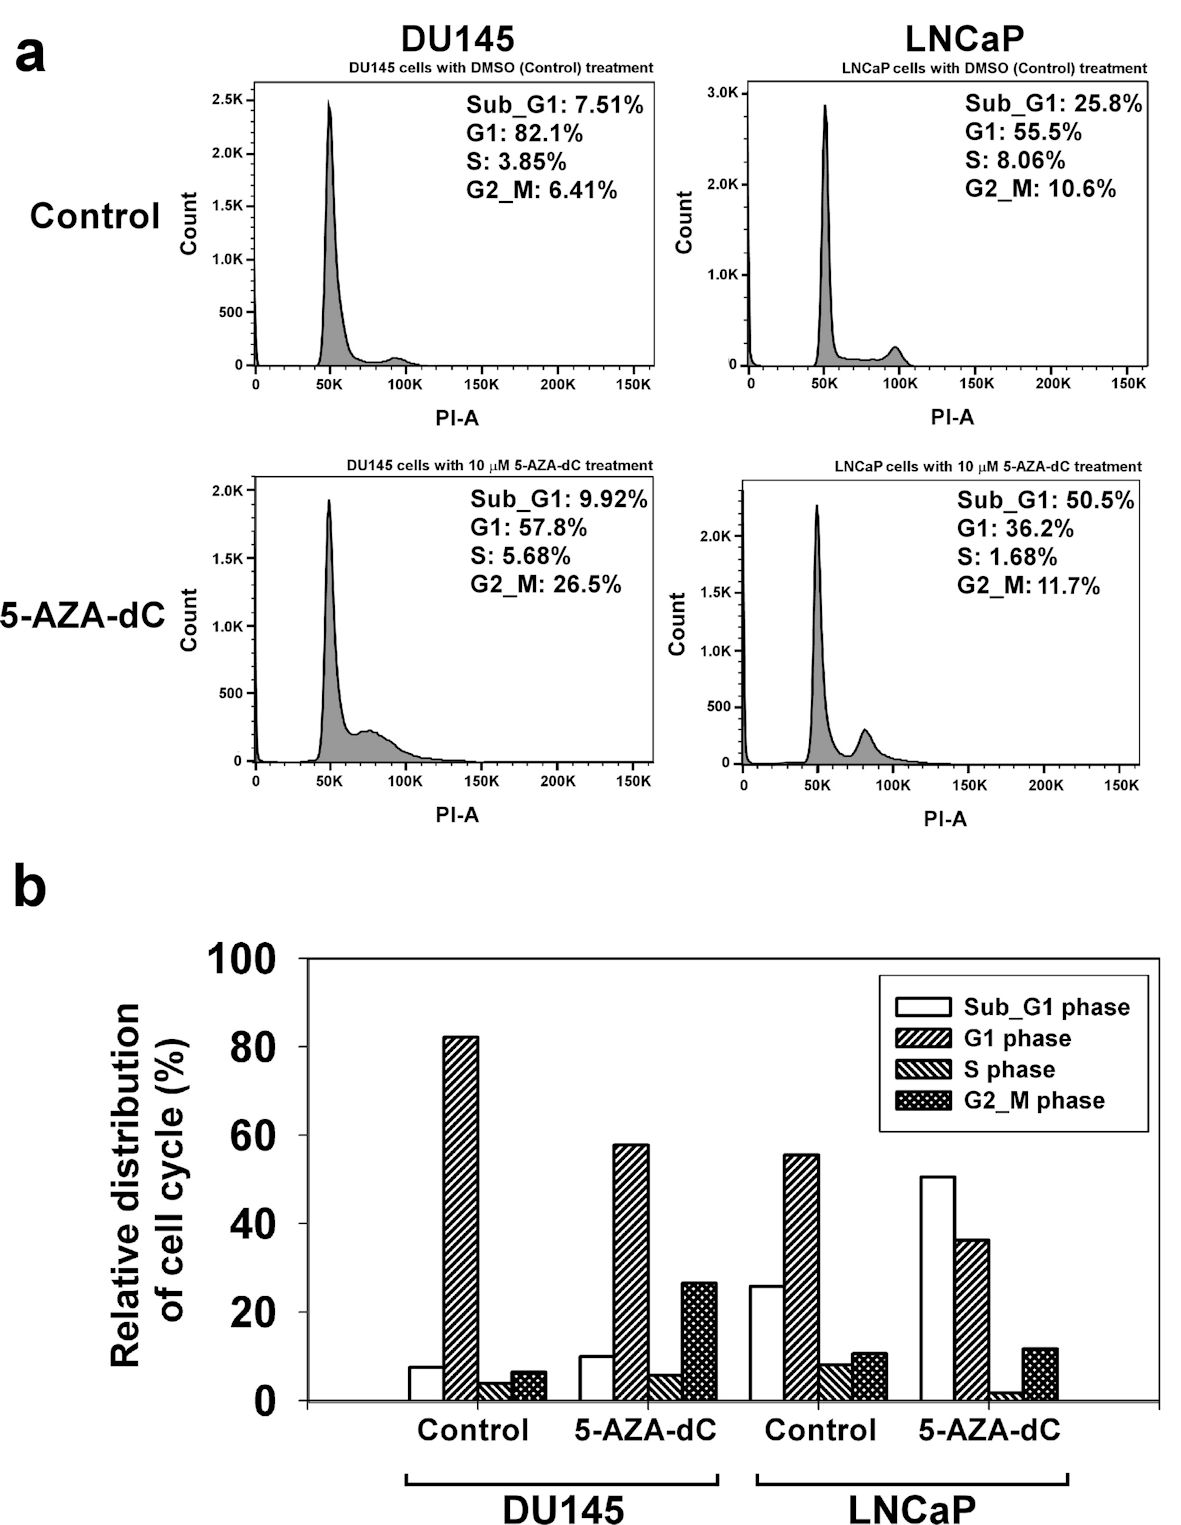
Figure 6. 5-AZA-dC affected the cell cycle process in DU145 and LNCaP cells. DU145 and LNCaP cells were treated with 10 µM 5-AZA-dC for 72 h. The cells were harvested, and the cell cycle status was analyzed by flow cytometry assay (a). The distribution of cell cycle in DU145 and LNCaP cells was summarized (b). 5-AZA-dC: 5-aza-2′-deoxycytidine; DMSO: dimethylsulfoxide.
Tables
Table 1. The Sequences of Primers Used in This Study for qRT-PCR
| Gene | Primer sequence 5′→3′ |
|---|
| COX-2: clooxygenase-2; qRT-PCR: quantitative reverse transcription polymerase chain reaction. |
| COX-2 | Forward: GTTGGA GCACCATTCTCCTTG |
| Reverse: AGCCCTTCACGTTATTGCAGA |
| Snail | Forward: TGCCCTCAAGATGCACATCCGA |
| Reverse: GGGACAGGAGAAGGGCTTCTC |
| Zeb1 | Forward: GGCATACACCTACTCAACTACGG |
| Reverse: TGGGCGGTGTAGAATCAGAGTC |
| p53 | Forward: CCTCAGCATCTTATCCGAGTGG |
| Reverse: TGGATGGTGGTACAGTCAGAGC |
| Myc | Forward: CCTGGTGCTCCATGAGGAGAC |
| Reverse: CAGACTCTGACCTTTTGCCAGG |
| β-actin | Forward: CACCATTGGCAATGAGCGGTTC |
| Reverse: AGGTCTTTGCGGATGTCCACGT |
Table 2. The Sequences of Primers Used in Bisulfite Sequencing
| Region | Primer sequence 5′→3′ |
|---|
| COX-2: clooxygenase-2. |
| COX2-A | A1: TGTATATTGAAGGTAGTTATTTTAT |
| A2: AAACACTTAACTTCCTCTCCAA |
| COX2-B | B1: TTGGAGAGGAAGTTAAGTGTTT |
| B2: ATCCCCACTCTCCTATCTAAT |
| COX2-C | C1: ATTAGATAGGAGAGTGGGGAT |
| C2: TCTAAAAAC(A/G)TCTAACTATAAAACT |
| COX2-D | D1: AAGTGAG(C/T)GTTAGGAGTA(C/T)GTT |
| D2: ACCAAATACTCACCTATATAACT |
| COX2-E | E1: AGTTATATAGGTGAGTATTTGG(C/T) |
| E2: CTAACTCATAATAATCAATACTTAT |