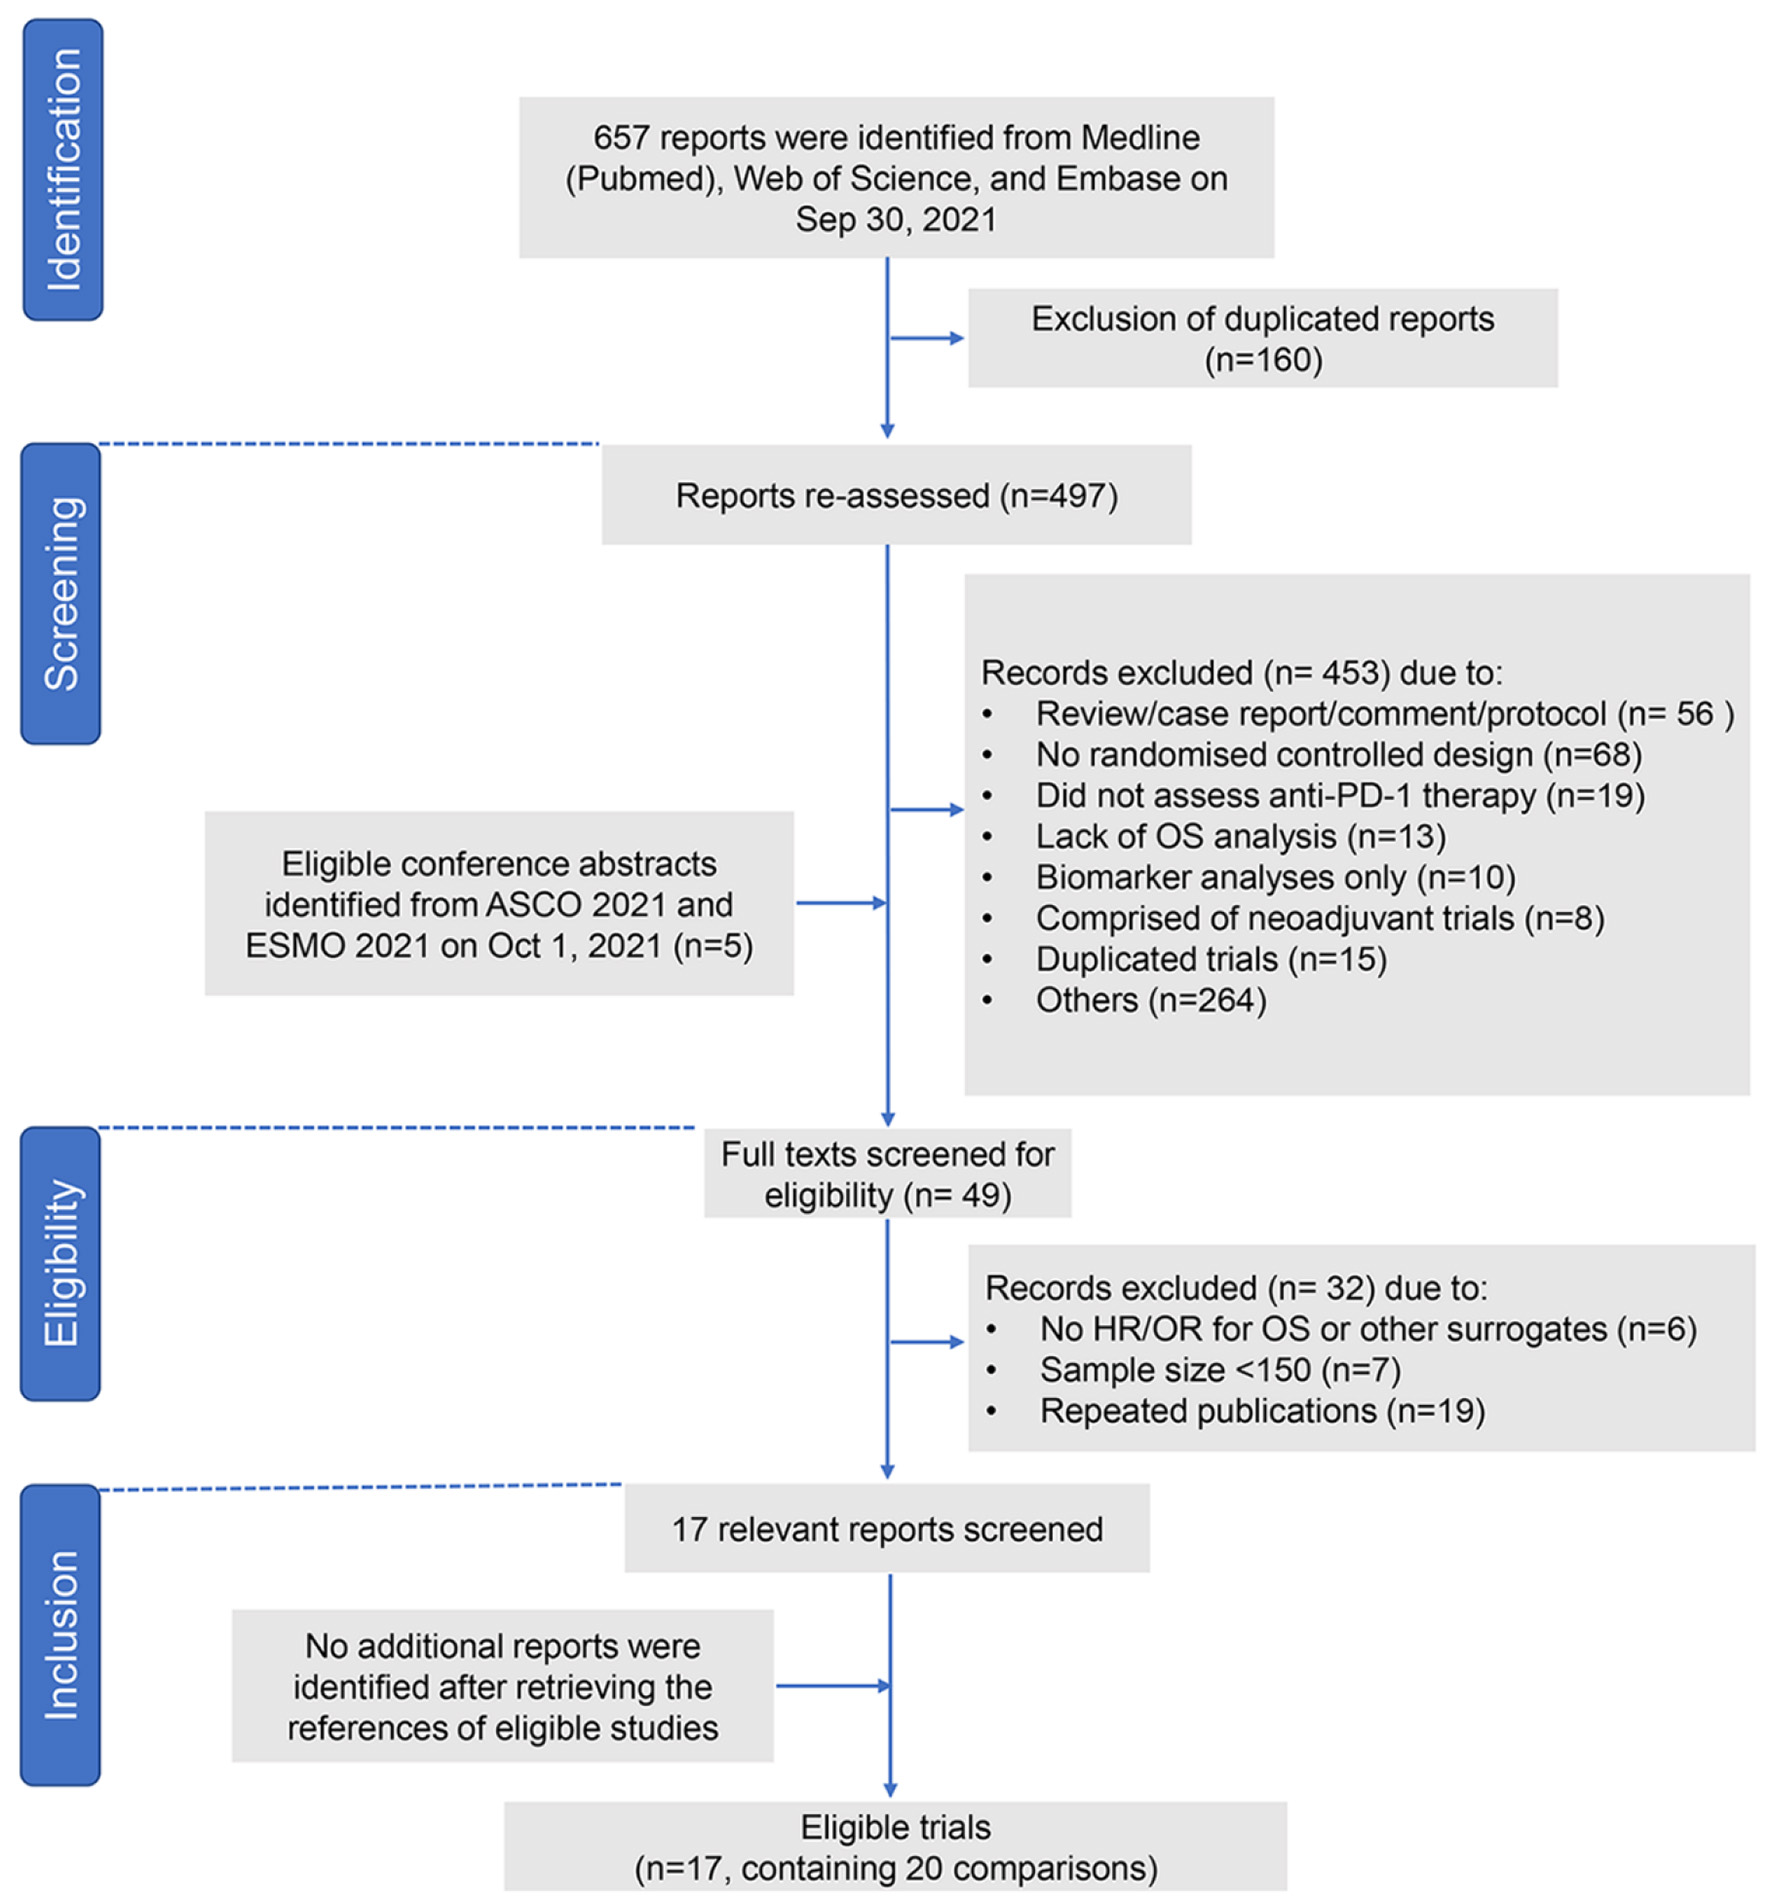
Figure 1. Study flow chart. PD-1: programmed death-1; ASCO: American Society of Clinical Oncology; ESMO: European Society for Medical Oncology; OR: odds ratio; HR: hazard ratio; OS: overall survival.
| World Journal of Oncology, ISSN 1920-4531 print, 1920-454X online, Open Access |
| Article copyright, the authors; Journal compilation copyright, World J Oncol and Elmer Press Inc |
| Journal website https://www.wjon.org |
Original Article
Volume 13, Number 3, June 2022, pages 126-135
Surrogate Endpoints for Overall Survival in Immune-Oncology Trials of Advanced Gastro-Esophageal Carcinoma
Figures
Tables
| Studies | Population | Line of treatments | Study phase | Primary endpoint | Treatment arms | N | DCR (%) | ORR (%) | OS | PFS | ||
|---|---|---|---|---|---|---|---|---|---|---|---|---|
| Median | HR | Median | HR | |||||||||
| *Patients with CPS ≥ 10 were included. **Patients with CPS ≥ 5 were included. ***All randomly assigned patients were included. ****Patients with CPS ≥ 1 were included. *****Patients with CPS ≥ 1 were included. G: gastric; EGJ: esophagogastric junction; ESCA: esophageal carcinoma; Nivo: nivolumab; Ipi: ipilimumab; NIVO3: nivolumab 3 mg/kg; NIVO1 + IPI3: nivolumab 1 mg/kg plus ipilimumab 3 mg/kg; NIVO3 + IPI1: NIVO3 plus ipilimumab 1 mg/kg; NR: not reported; CPS: combined positive score; TPS: tumor positive score; ORR: objective response rate; DCR: disease control rate; OS: overall survival; PFS: progression-free survival; HR: hazard ratio. | ||||||||||||
| ATTRACTION-2 [12] | G/EGJ carcinoma | ≥ 3 | 3 | OS | Nivo; placebo | 330; 163 | 40; 25 | 11; 0 | 5.26; 4.14 | 0.63 (0.51 - 0.78) | 1.61; 1.45 | 0.60 (0.49 - 0.75) |
| JAVELIN Gastric 300 [32] | G/EGJ carcinoma | ≥ 2 | 3 | OS | Avelumab; chemotherapy | 185; 186 | 22.2; 44.1 | 2.2; 4.3 | 4.6; 5.0 | 1.1 (0.90 - 1.40) | 1.4; 2.7 | 1.73 (1.40 - 2.20) |
| KEYNOTE-061 [33] | G/EGJ carcinoma | 2 | 3 | OS; PFS | Pembrolizumab; paclitaxel | 196; 199 | 59.5; 29.5 | 16; 14 | 9.1; 8.3 | 0.82 (0.66 - 1.03) | 1.5; 4.1 | 1.27 (1.03 - 1.57) |
| ATTRACTION-3 [13] | ESCA | 2 | 3 | OS | Nivo; chemotherapy | 210; 209 | 37; 66 | 19; 22 | 10.9; 8.4 | 0.77 (0.62 - 0.96) | 1.7; 3.4 | 1.08 (0.87 - 1.34) |
| ATTRACTION-4 [34] | G/EGJ carcinoma | 1 | 3 | OS; PFS | Nivo + chemotherapy; placebo + chemotherapy | 362; 362 | 71.8; 68.5 | 57.5; 47.8 | 17.45; 17.15 | 0.90 (0.75 - 1.08) | 10.45; 8.34 | 0.68 (0.51 - 0.90) |
| ESCORT [14] | ESCA | 2 | 3 | OS | Camrelizumab; chemotherapy | 228; 220 | 44.7; 34.5 | 20.2; 6.4 | 8.3; 6.2 | 0.71 (0.57 - 0.87) | 1.9; 1.9 | 0.69 (0.56 - 0.86) |
| KEYNOTE-590 [18] | ESCA | 1 | 3 | OS; PFS | Pembrolizumab + chemotherapy; placebo + chemotherapy | 373; 376 | 79.3; 75.6 | 45; 29.3 | 12.4; 9.8 | 0.73 (0.62 - 0.86) | 6.3; 5.8 | 0.65 (0.55 - 0.76) |
| KEYNOTE-181 [15]* | ESCA | 2 | 3 | OS (CPS ≥ 10) | Pembrolizumab; chemotherapy | 107; 115 | 49.5; 47.0 | 21.5; 6.1 | 9.3; 6.7 | 0.69 (0.52 - 0.93) | 2.6; 3.0 | 0.73 (0.54-0.97) |
| CheckMate 649 [16, 36]** | G/EGJ carcinoma | 1 | 3 | OS; PFS (CPS ≥ 5) | Nivo + chemotherapy; chemotherapy; Nivo + ipi; chemotherapy | 473; 482; 234; 239 | 88; 79; 54; 83 | 60; 45; 27; 47 | 14.4; 11.1; 11.2; 11.6 | 0.71 (0.59 - 0.86); 0.89 (0.71 - 1.10) | 7.7; 6.0; 2.8; 6.3 | 0.68 (0.56 - 0.81); 1.42 (1.14 - 1.76) |
| JAVELIN Gastric 100 [37]*** | G/EGJ carcinoma | 1 | 3 | OS (all patients or TPS ≥ 1) | Avelumab; chemotherapy | 249; 250 | 50.2; 61.2 | 13.3; 14.4 | 10.4; 10.9 | 0.91 (0.74 - 1.11) | 3.2; 4.4 | 1.04 (0.85 - 1.28) |
| KEYNOTE-062 [35]**** | Gastric carcinoma | 1 | 3 | OS; PFS (CPS ≥ 1 or ≥ 10) | Pembrolizumab + chemotherapy; pembrolizumab; chemotherapy | 257; 256; 250 | 78; 42; 79 | 49; 15; 37 | 13.9; 10.6; 11.1 | 0.85 (0.70 - 1.03); 0.91 (0.74 - 1.10) | 6.9; 2.0; 6.4 | 0.84 (0.70 - 1.02); 1.66 (1.37 - 1.51) |
| RATIONALE 302 [38] | ESCA | 2 | 3 | OS | Tislelizumab; chemotherapy | 256; 256 | 47; 41.8 | 20.4; 9.8 | 8.6; 6.3 | 0.70 (0.57 - 0.85) | 1.6; 2.1 | 0.83 (0.67 - 1.01) |
| CheckMate 648 [31]***** | ESCA | 1 | 3 | OS; PFS (CPS ≥ 1) | Nivo + chemotherapy; Nivo + ipi; chemotherapy | 158; 158; 157 | 78; 63; 66 | 53; 35; 20 | 15.4; 13.7; 9.1 | 0.54 (0.37 - 0.80); 0.64 (0.46 - 0.90) | 6.9; 4.0; 4.4 | 0.65 (0.46 - 0.92); 1.02 (0.73 - 1.43) |
| ESCORT-1st [17] | ESCA | 1 | 3 | OS; PFS | Camrelizumab + chemotherapy; chemotherapy | 298; 298 | 91.3; 88.9 | 72.1; 62.1 | 15.3; 12.0 | 0.70 (0.56 - 0.88) | 6.9; 5.6 | 0.56 (0.46 - 0.68) |
| ORIENT-15 [39]*** | ESCA | 1 | 3 | OS (CPS ≥ 10 and all patients) | Sintilimab + chemotherapy; chemotherapy | 327; 332 | NR | 66.1; 45.5 | 16.7; 12.5 | 0.63 (0.51 - 0.78) | 7.2; 5.7 | 0.56 (0.46 - 0.68) |
| ORIENT-16 [40]*** | G/EGJ carcinoma | 1 | 3 | OS (CPS ≥ 5 and all patients) | Sintilimab + chemotherapy; chemotherapy | 327; 323 | NR | 58.2; 48.4 | 15.2; 12.3 | 0.76 (0.63 - 0.94) | 7.1; 5.7 | 0.64 (0.53 - 0.77) |
| JUPITER-06 [41] | ESCA | 1 | 3 | OS; PFS | Toripalimab + chemotherapy; chemotherapy | 257; 257 | NR | NR | 17.0; 11.0 | 0.58 (0.43 - 0.78) | 5.7; 5.5 | 0.58 (0.46 - 0.74) |
| Subgroup analysis | No. of comparisons | Weighted correlation coefficients, R (95% CI) | P value |
|---|---|---|---|
| G: gastric; EGJ: esophagogastric junction; ESCA: esophageal carcinoma; CI: confidence interval. | |||
| Tumor type | |||
| ESCA [13-15, 17, 18, 31, 38, 39, 41] | 10 | 0.47 (0.00 - 0.99) | 0.174 |
| G/EGJ cancer [12, 16, 32-37, 40] | 10 | 0.71 (0.22 - 0.99) | 0.021 |
| Trials line | |||
| First-line [16-18, 31, 34-37, 39-41] | 13 | 0.57 (0.08 - 0.99) | 0.043 |
| ≥ 2 lines [12-15, 32, 33, 38] | 7 | 0.96 (0.72 - 0.99) | < 0.001 |
| Treatment strategy | |||
| Monotherapy [12-15, 32, 33, 35, 37, 38] | 9 | 0.89 (0.56 - 0.99) | 0.001 |
| Combinational therapy [16-18, 31, 34-36, 39-41] | 11 | 0.41 (0.00 - 0.99) | 0.215 |
| Median follow-up | |||
| ≥ 10 months [13, 16-18, 31, 32, 34-37, 39, 40] | 14 | 0.71 (0.31 - 0.99) | 0.005 |
| < 10 months [12, 14, 15, 33, 38, 41] | 6 | 0.91 (0.51 - 0.99) | 0.011 |