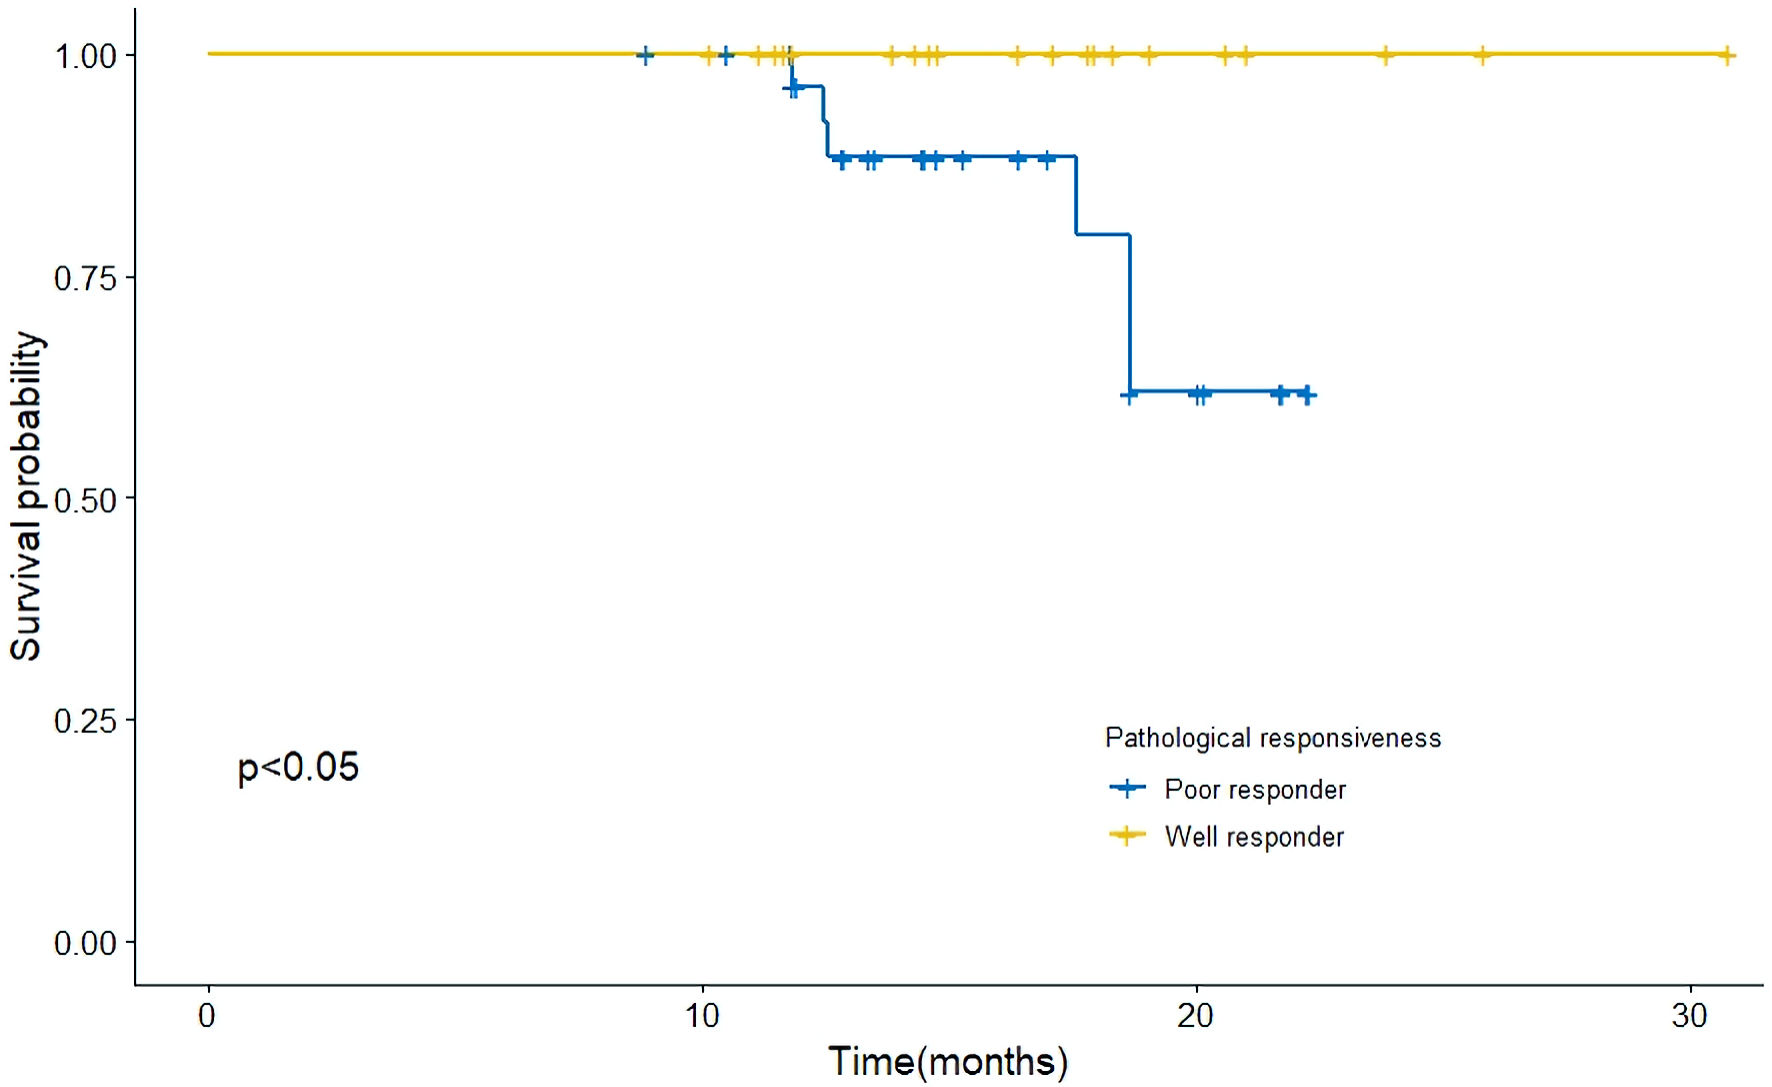
Figure 1. Flowchart of patient eligibility for inclusion. Of the 83 patients receiving neoadjuvant immunochemotherapy, 71 patients were evaluated at least once via radiological imaging. Eventually, a total of 51 patients underwent surgery. Based on the response of primary tumor and lymph nodes, patients were categorized into different groups. ESCC: esophageal squamous cell carcinoma.
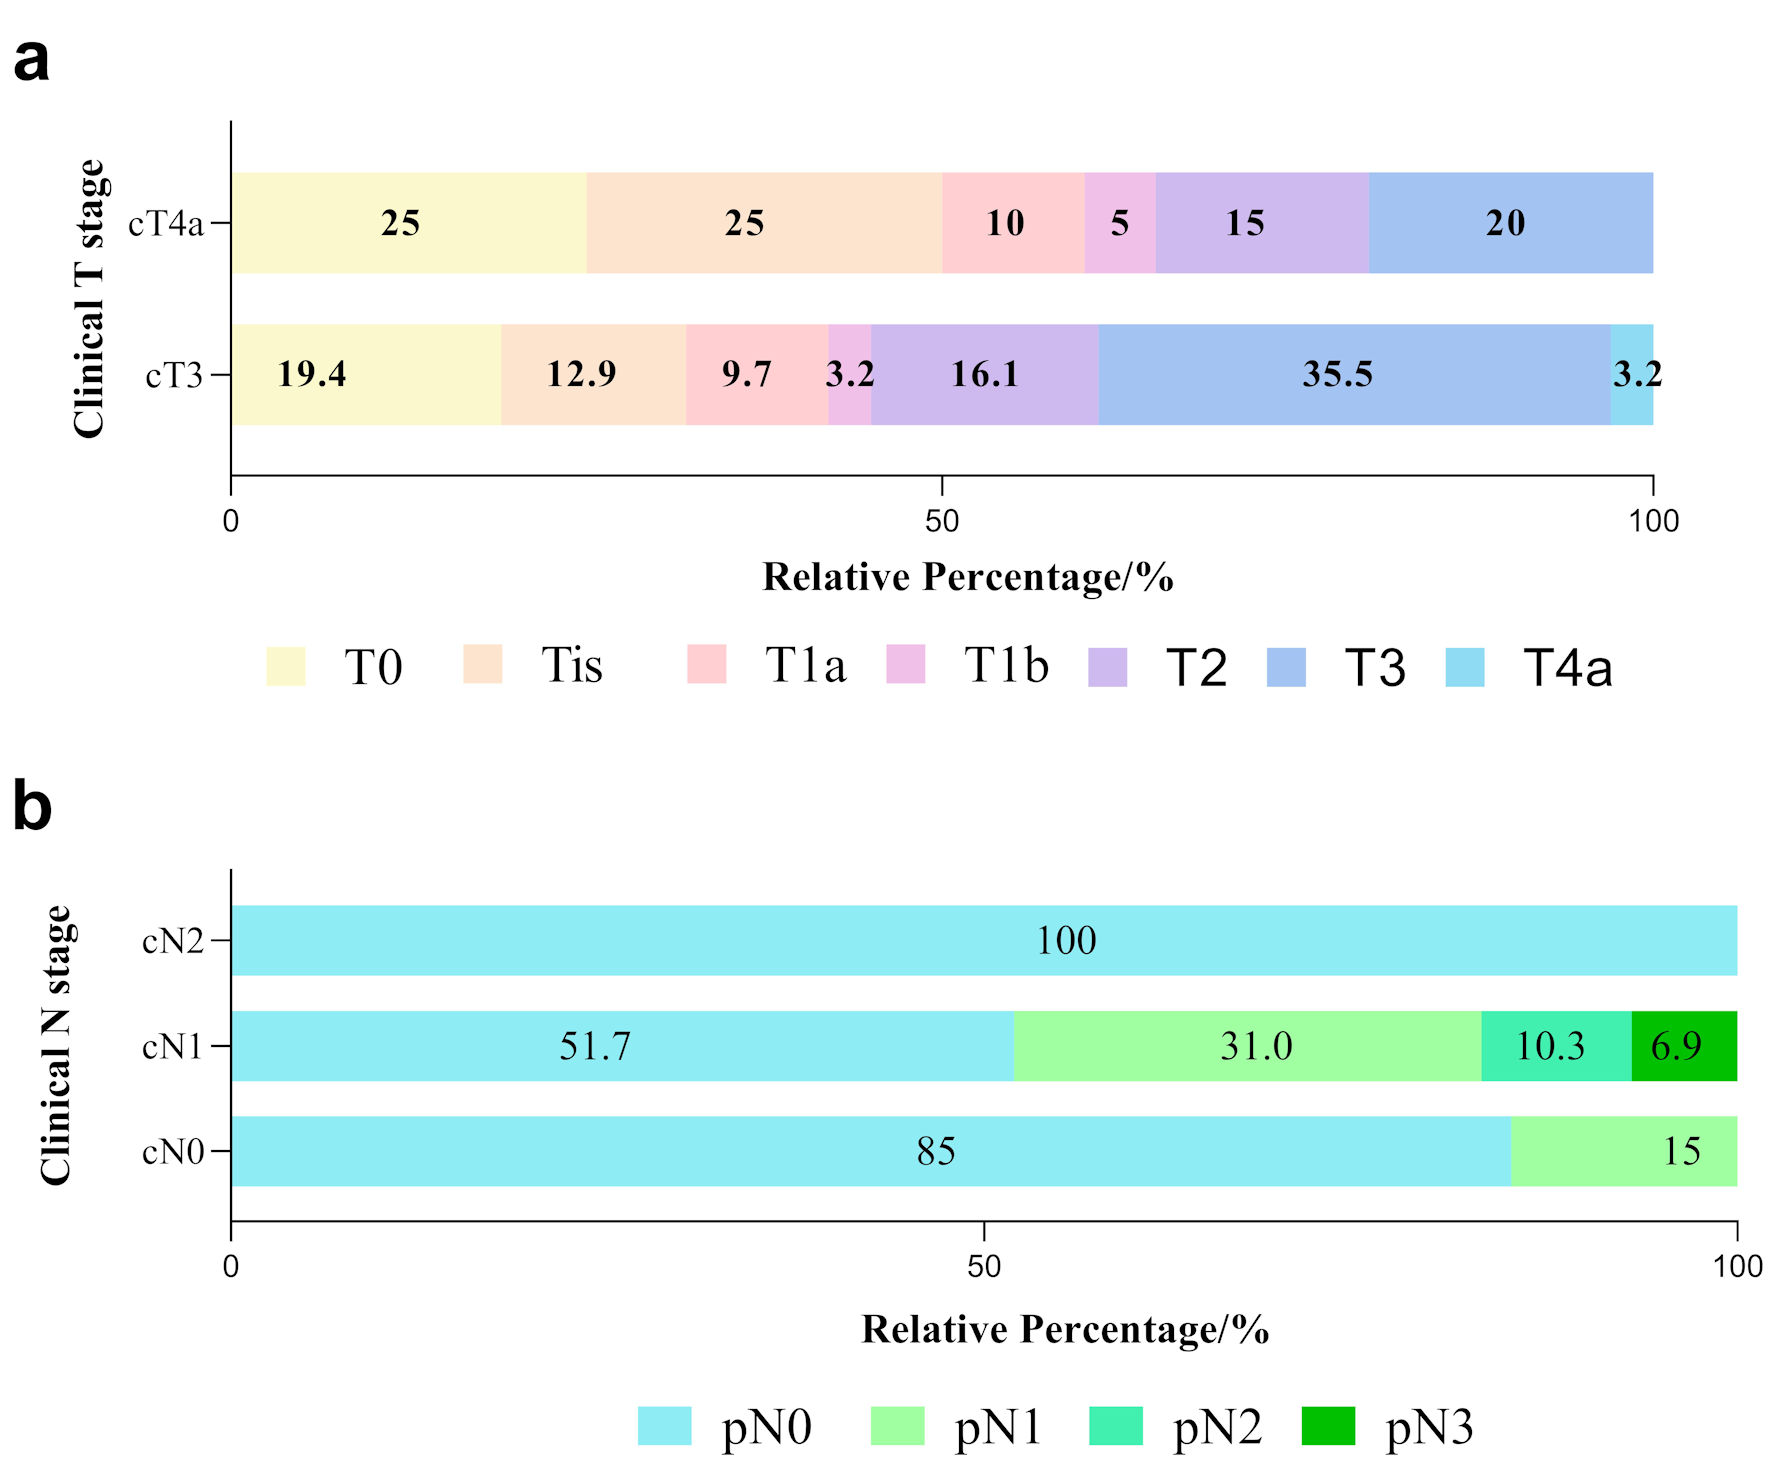
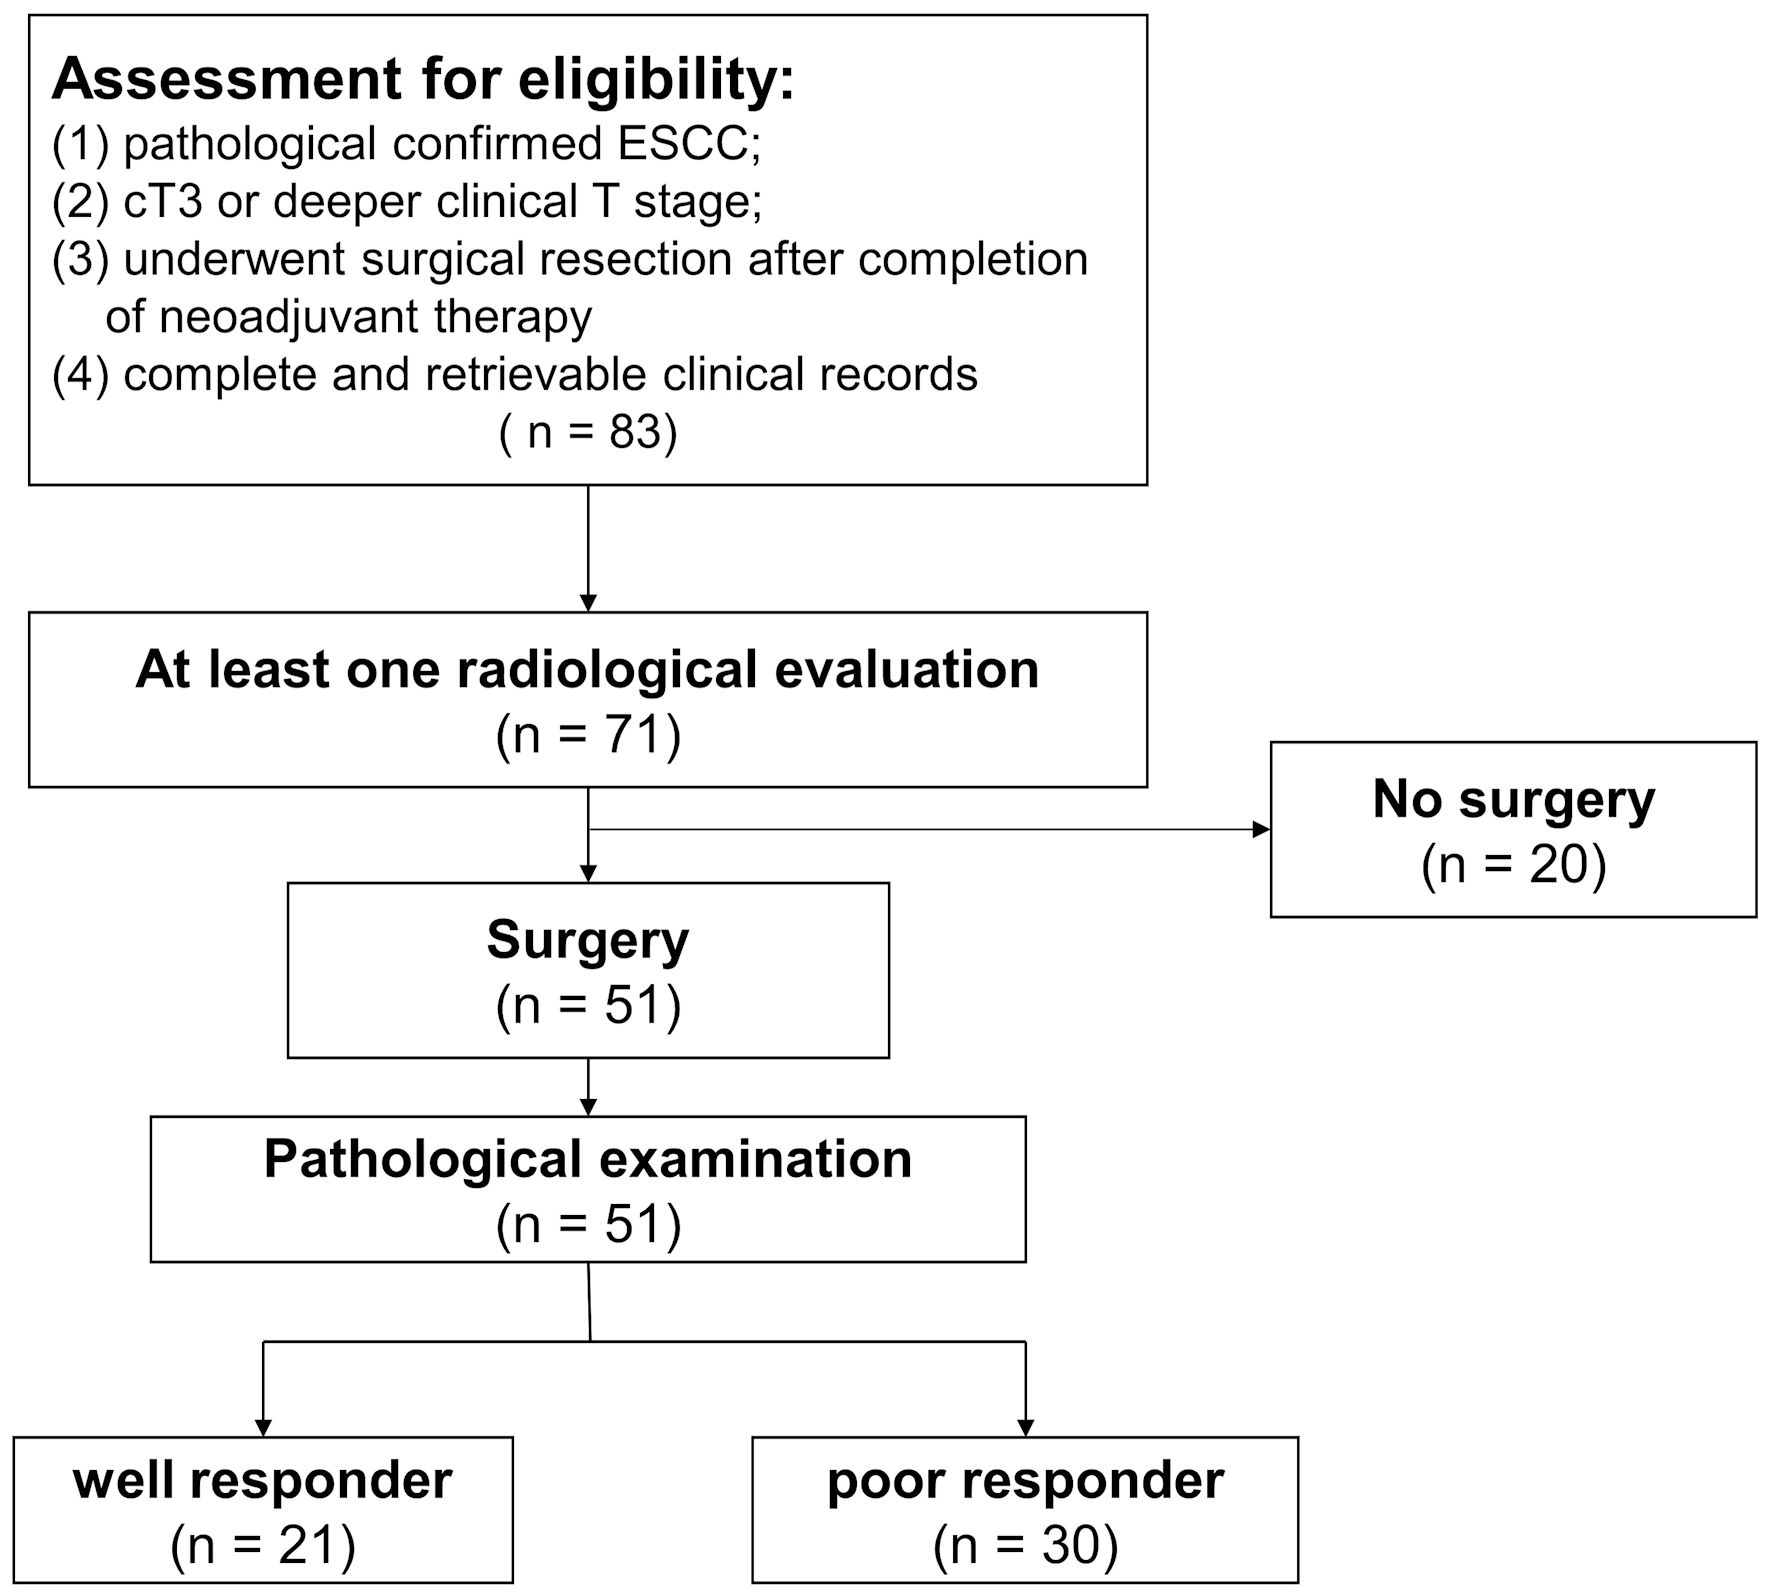
Figure 2. Tumor and nodal responses in ESCC patients with various clinical stages. (a) Differences in pathological T stage between cT3 and cT4a patients. Various color blocks represent depths of tumor invasion. (b) Differences in pathological lymph node response (represented by different color blocks) among cN0, cN1 and cN2 groups after neoadjuvant immunochemotherapy. ESCC: esophageal squamous cell carcinoma.
Figure 3. Multivariate regression analysis for pretreatment predictors associated with combined tumor and nodal responses. Variables with P values ≤ 0.1 in the univariate analysis were included in this step. The forest plot showed that treatment cycles and pretreatment platelet counts were independent predictors for combined TN responses. Pre-N:L: pretreatment neutrophil to lymphocyte ratio; Pre-platelets: pretreatment platelet count; BMI: body mass index.