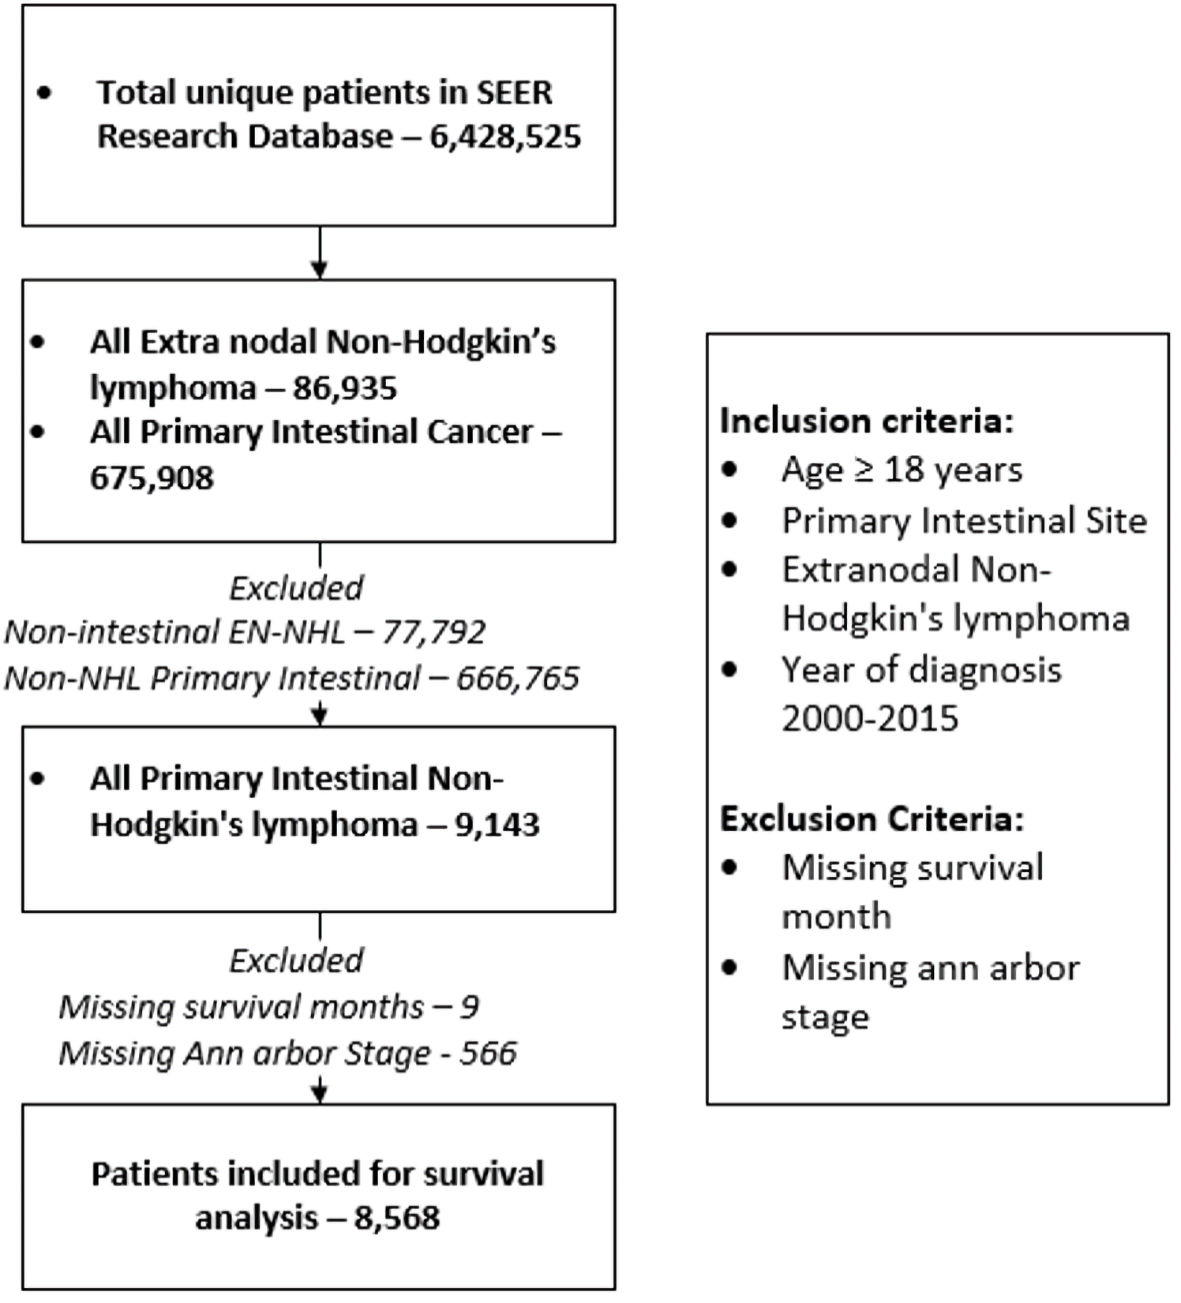
Figure 1. Description of patient selection and exclusion for the study. Patient listed in SEER 18 registries were included in the study. SEER: Surveillance, Epidemiology, and End Results; EN-NHL: extranodal non-Hodgkin lymphoma.
| World Journal of Oncology, ISSN 1920-4531 print, 1920-454X online, Open Access |
| Article copyright, the authors; Journal compilation copyright, World J Oncol and Elmer Press Inc |
| Journal website https://www.wjon.org |
Original Article
Volume 13, Number 4, August 2022, pages 159-171
Epidemiology and Determinants of Survival for Primary Intestinal Non-Hodgkin Lymphoma: A Population-Based Study
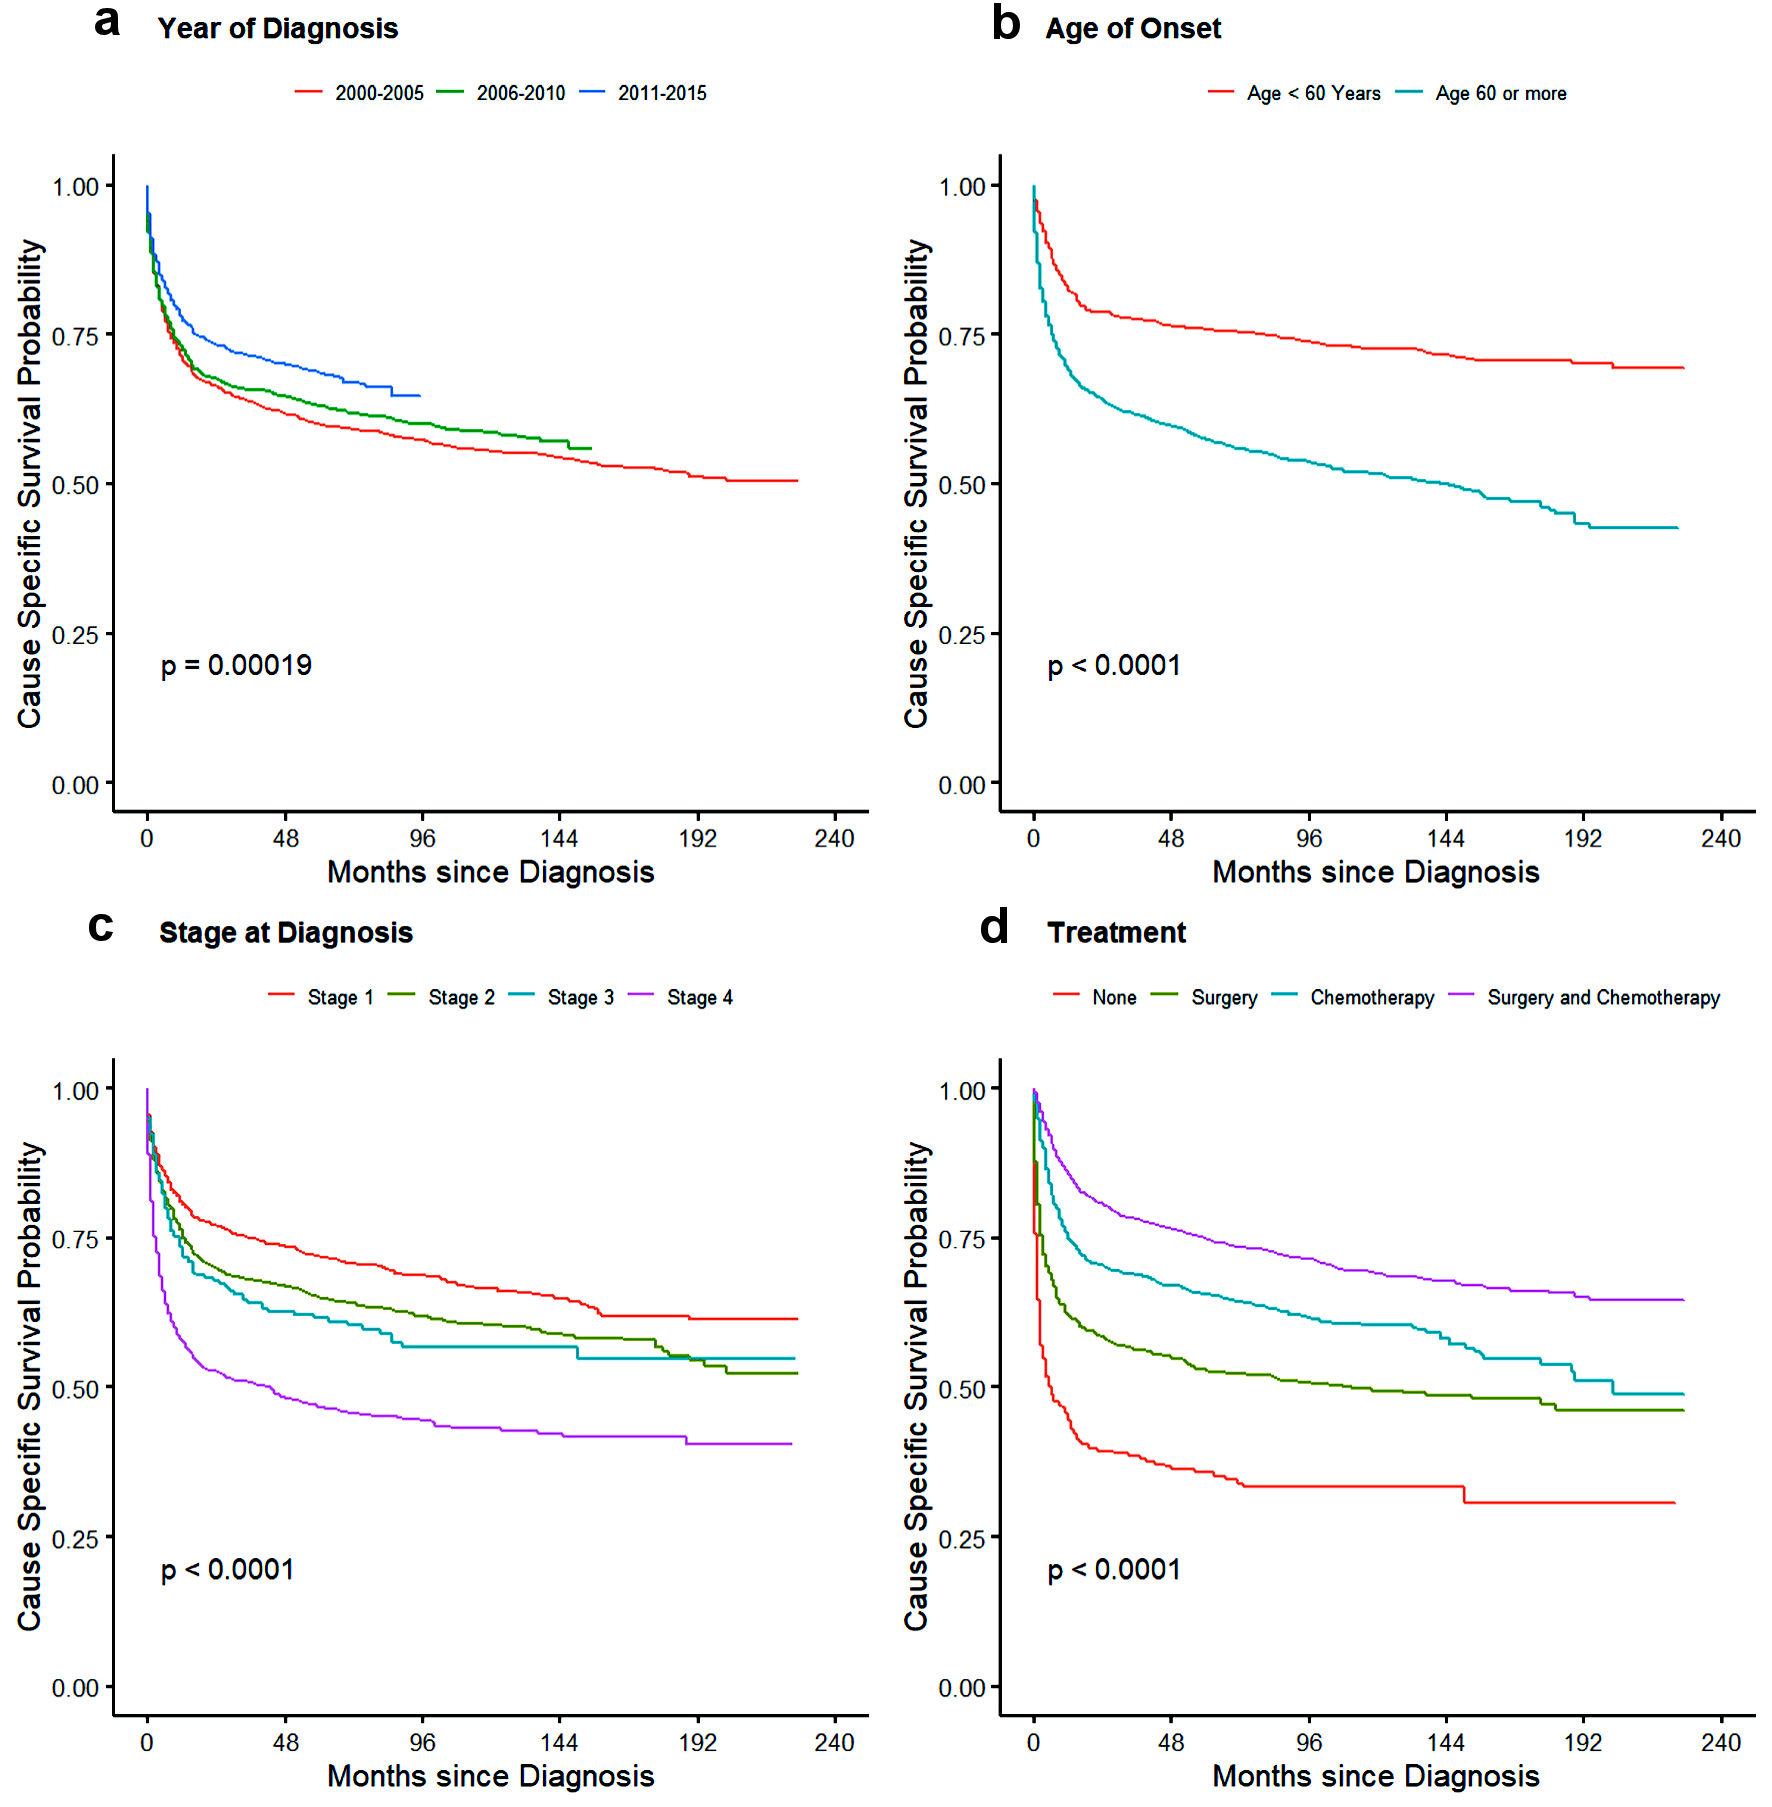
Figures
Tables
| Age-adjusted incidence (per 100,000 population) | Rate ratio | P value | |
|---|---|---|---|
| aArranged in descending order of age-adjusted incidence rate. PI-NHL: primary intestinal non-Hodgkin lymphoma. | |||
| Study population (age ≥ 18, year 2000 - 2015) | 0.914 (0.896 - 0.934) | - | - |
| Sexa | |||
| Male | 1.24 (1.207 - 1.274) | Reference | - |
| Female | 0.651 (0.629 - 0.673) | 0.5246 (0.5026 - 0.5475) | 0.00 |
| Ethnicitya | |||
| Non-Hispanic White | 0.954 | Reference | - |
| Non-Hispanic Asia-Pacific Islanders | 0.923 (0.859 - 0.991) | 0.9677 (0.8964 - 1.0433) | 0.40 |
| Hispanic | 0.873 (0.818 - 0.932) | 0.9156 (0.8533 - 0.9812) | 0.01 |
| Non-Hispanic American Indian | 0.662 (0.47 - 0.904) | 0.6946 (0.4921 - 0.9491) | 0.02 |
| Non-Hispanic Black | 0.589 (0.540 - 0.641) | 0.6175 (0.5644 - 0.6743) | 0.00 |
| Characteristics | N (% or range) |
|---|---|
| IQR: interquartile range; DLBCL: diffuse large B-cell lymphoma; NOS: not otherwise specified; PI-NHL: primary intestinal non-Hodgkin lymphoma; MALToma: mucosa-associated lymphoid tissue lymphoma. | |
| Total | 8,568 |
| Median age in years (IQR) | 66.5 (55 - 77) |
| < 60 years | 2,933 (34.23) |
| ≥ 60 years | 5,635 (65.77) |
| Sex | |
| Female | 3,352 (39.12) |
| Male | 5,216 (60.88) |
| Ethnicity | |
| Non-Hispanic White | 6,240 (72.83) |
| Non-Hispanic Black | 533 (6.22) |
| Hispanic | 967 (11.29) |
| Others | 828 (9.66) |
| Staging | |
| Stage 1 | 4,013 (46.84) |
| Stage 2 | 2,329 (27.18) |
| Stage 3 | 456 (5.32) |
| Stage 4 | 1,770 (20.66) |
| Site | |
| Small intestine | 4,696 (54.81) |
| Large intestine | 3,872 (45.19) |
| Histology | |
| Follicular lymphoma | 1,563 (18.24) |
| MALToma | 1,160 (13.54) |
| DLBCL | 3,835 (44.76) |
| Mantle cell lymphoma | 447 (5.22) |
| Burkitt lymphoma | 344 (4.01) |
| Other B-cell lymphoma | 232 (2.71) |
| T-Cell non-Hodgkin lymphoma | 392 (4.58) |
| Non-Hodgkin lymphoma, NOS | 595 (6.94) |
| Treatment | |
| Chemotherapy only | 2,018 (23.55) |
| Surgery only | 2,446 (28.55) |
| Surgery and chemotherapy | 2,506 (29.25) |
| None | 1,598 (18.65) |
| Year of diagnosis | |
| 2000 - 2005 | 2,911 (33.98) |
| 2006 - 2010 | 2,815 (32.85) |
| 2011 - 2015 | 2,842 (33.17) |
| Histological subtype of NHL | Total | Small intestine | Large intestine |
|---|---|---|---|
| NHL: non-Hodgkin lymphoma; DLBCL: diffuse large B-cell lymphoma; MALToma: mucosa-associated lymphoid tissue lymphoma; NOS: not otherwise specified. | |||
| Follicular lymphoma | 1,563 (18.24) | 1,185 (25.23) | 378 (9.76) |
| MALToma | 1,160 (13.54) | 443 (9.43) | 717 (18.52) |
| DLBCL | 3,835 (44.76) | 2,138 (45.53) | 1,697 (43.83) |
| Mantle cell lymphoma | 447 (5.22) | 82 (1.75) | 365 (9.43) |
| Burkitt lymphoma | 344 (4.01) | 166 (3.53) | 178 (4.60) |
| Other B-cell lymphoma | 232 (2.71) | 80 (1.70) | 152 (3.93) |
| T-cell non-Hodgkin lymphoma | 392 (4.58) | 305 (6.49) | 87 (2.25) |
| Non-Hodgkin lymphoma, NOS | 595 (6.94) | 297 (6.32) | 298 (7.70) |
| Cause-specific survival (95% CI) | Overall survival (95% CI) | |
|---|---|---|
| PI-NHL: primary intestinal non-Hodgkin lymphoma; CI: confidence interval. | ||
| 1-year survival | 0.80 (0.796 - 0.813) | 0.76 (0.749 - 0.767) |
| 5-year survival | 0.71 (0.706 - 0.725) | 0.61 (0.600 - 0.621) |
| 10-year survival | 0.66 (0.654 - 0.677) | 0.48 (0.469 - 0.493) |
| Variable | Cause-specific survival HR (95% CI) | P value | Overall survival HR (95% CI) | P value |
|---|---|---|---|---|
| HR: hazard ratio; NHL: non-Hodgkin lymphoma; DLBCL: diffuse large B-cell lymphoma; MALToma: mucosa-associated lymphoid tissue lymphoma; NOS: not otherwise specified; PI-NHL: primary intestinal non-Hodgkin lymphoma; CI: confidence interval. | ||||
| Year of diagnosis | ||||
| 2000 - 2005 | Reference | Reference | ||
| 2006 - 2010 | 0.87 (0.80 - 0.96) | 0.004 | 0.88 (0.82 - 0.95) | < 0.001 |
| 2011 - 2015 | 0.72 (0.65 - 0.80) | < 0.001 | 0.78 (0.72 - 0.84) | < 0.001 |
| Age | ||||
| < 60 years | Reference | Reference | ||
| ≥ 60 years | 2.13 (1.94 - 2.34) | < 0.001 | 2.87 (2.65 - 3.10) | < 0.001 |
| Sex | ||||
| Female | Reference | Reference | ||
| Male | 1.14 (1.05 - 1.23) | 0.006 | 1.17 (1.10 - 1.24) | < 0.001 |
| Stage | ||||
| Stage 1 | Reference | Reference | ||
| Stage 2 | 1.54 (1.40 - 1.71) | < 0.001 | 1.26 (1.17 - 1.36) | < 0.001 |
| Stage 3 | 1.88 (1.59 - 2.22) | < 0.001 | 1.45 (1.27 - 1.66) | < 0.001 |
| Stage 4 | 2.56 (2.31 - 2.83) | < 0.001 | 1.93 (1.79 - 2.09) | < 0.001 |
| Histology | ||||
| DLBCL | Reference | Reference | ||
| Follicular lymphoma | 0.19 (0.16 - 0.23) | < 0.001 | 0.29 (0.26 - 0.32) | < 0.001 |
| MALToma | 0.21 (0.17 - 0.25) | < 0.001 | 0.37 (0.33 - 0.41) | < 0.001 |
| Mantle cell lymphoma | 0.60 (0.51 - 0.70) | < 0.001 | 0.59 (0.52 - 0.67) | < 0.001 |
| Other B-cell lymphoma | 0.61 (0.49 - 0.77) | < 0.001 | 0.68 (0.58 - 0.81) | < 0.001 |
| NHL, NOS | 0.76 (0.66 - 0.89) | < 0.001 | 0.83 (0.74 - 0.93) | 0.001 |
| Burkitt lymphoma | 1.36 (1.13 - 1.64) | 0.001 | 1.17 (1.00 - 1.38) | 0.052 |
| T-Cell non-Hodgkin lymphoma | 3.04 (2.67 - 3.46) | < 0.001 | 2.56 (2.28 - 2.88) | < 0.001 |
| Treatment | ||||
| None | Reference | Reference | ||
| Surgery | 0.82 (0.73 - 0.93) | 0.008 | 0.96 (0.88 - 1.05) | 0.395 |
| Chemotherapy | 0.52 (0.46 - 0.60) | < 0.001 | 0.59 (0.53 - 0.65) | < 0.001 |
| Chemotherapy and surgery | 0.39 (0.34 - 0.44) | < 0.001 | 0.45 (0.40 - 0.49) | < 0.001 |
| Year of diagnosis | 2000 - 2005 | 2006 - 2010 | 2011 - 2015 |
|---|---|---|---|
| OS: overall survival; CSS: cause-specific survival. | |||
| 1-year OS probability | 0.72 (0.71 - 0.74) | 0.77 (0.75 - 0.78) | 0.78 (0.77 - 0.80) |
| 3-year OS probability | 0.63 (0.61 - 0.68) | 0.68 (0.67 - 0.70) | 0.71 (0.69 - 0.72) |
| 1-year CSS probability | 0.77 (0.76 - 0.79) | 0.81 (0.79 - 0.82) | 0.83 (0.82 - 0.85) |
| 3-year CSS probability | 0.71 (0.69 - 0.72) | 0.75 (0.74 - 0.77) | 0.79 (0.77 - 0.80) |
| Variable | Number of patients | Cause-specific survival (95% CI) | P value | Overall survival (95% CI) | P value |
|---|---|---|---|---|---|
| PI-DLBCL: primary intestinal diffuse large B-cell lymphoma; CI: confidence interval. | |||||
| Year of diagnosis | |||||
| 2000 - 2005 | 1,387 (36.17) | Reference | Reference | ||
| 2006 - 2010 | 1,243 (32.41) | 0.96 (0.85 - 1.08) | 0.505 | 0.95 (0.86 - 1.05) | 0.318 |
| 2011 - 2015 | 1,205 (31.42) | 0.72(0.63 - 0.82) | < 0.001 | 0.79 (0.71 - 0.88) | < 0.001 |
| Age | |||||
| < 60 years | 1,232 (32.13) | Reference | Reference | ||
| ≥ 60 years | 2,603 (67.87) | 1.92 (1.69 - 2.18) | < 0.001 | 2.51 (2.26 - 2.78) | < 0.001 |
| Stage | |||||
| Stage 1 | 1,519 (39.61) | Reference | Reference | ||
| Stage 2 | 1,245 (32.46) | 1.48 (1.30 - 1.69) | < 0.001 | 1.20 (1.08 - 1.32) | < 0.001 |
| Stage 3 | 248 (6.47) | 1.66 (1.33 - 2.07) | < 0.001 | 1.27 (1.06 - 1.52) | < 0.001 |
| Stage 4 | 823 (21.46) | 2.69 (2.35 - 3.08) | < 0.001 | 2.01 (1.81 - 2.24) | < 0.001 |
| Treatment | |||||
| None | 355 (9.26) | Reference | Reference | ||
| Surgery | 970 (25.29) | 0.52 (0.44 - 0.62) | < 0.001 | 0.60 (0.53 - 0.69) | < 0.001 |
| Chemotherapy | 1,008 (26.28) | 0.33 (0.28 - 0.39) | < 0.001 | 0.36 (0.31 - 0.42) | < 0.001 |
| Chemotherapy and surgery | 1,502 (39.17) | 0.22 (0.19 - 0.26) | < 0.001 | 0.26 (0.23 - 0.30) | < 0.001 |