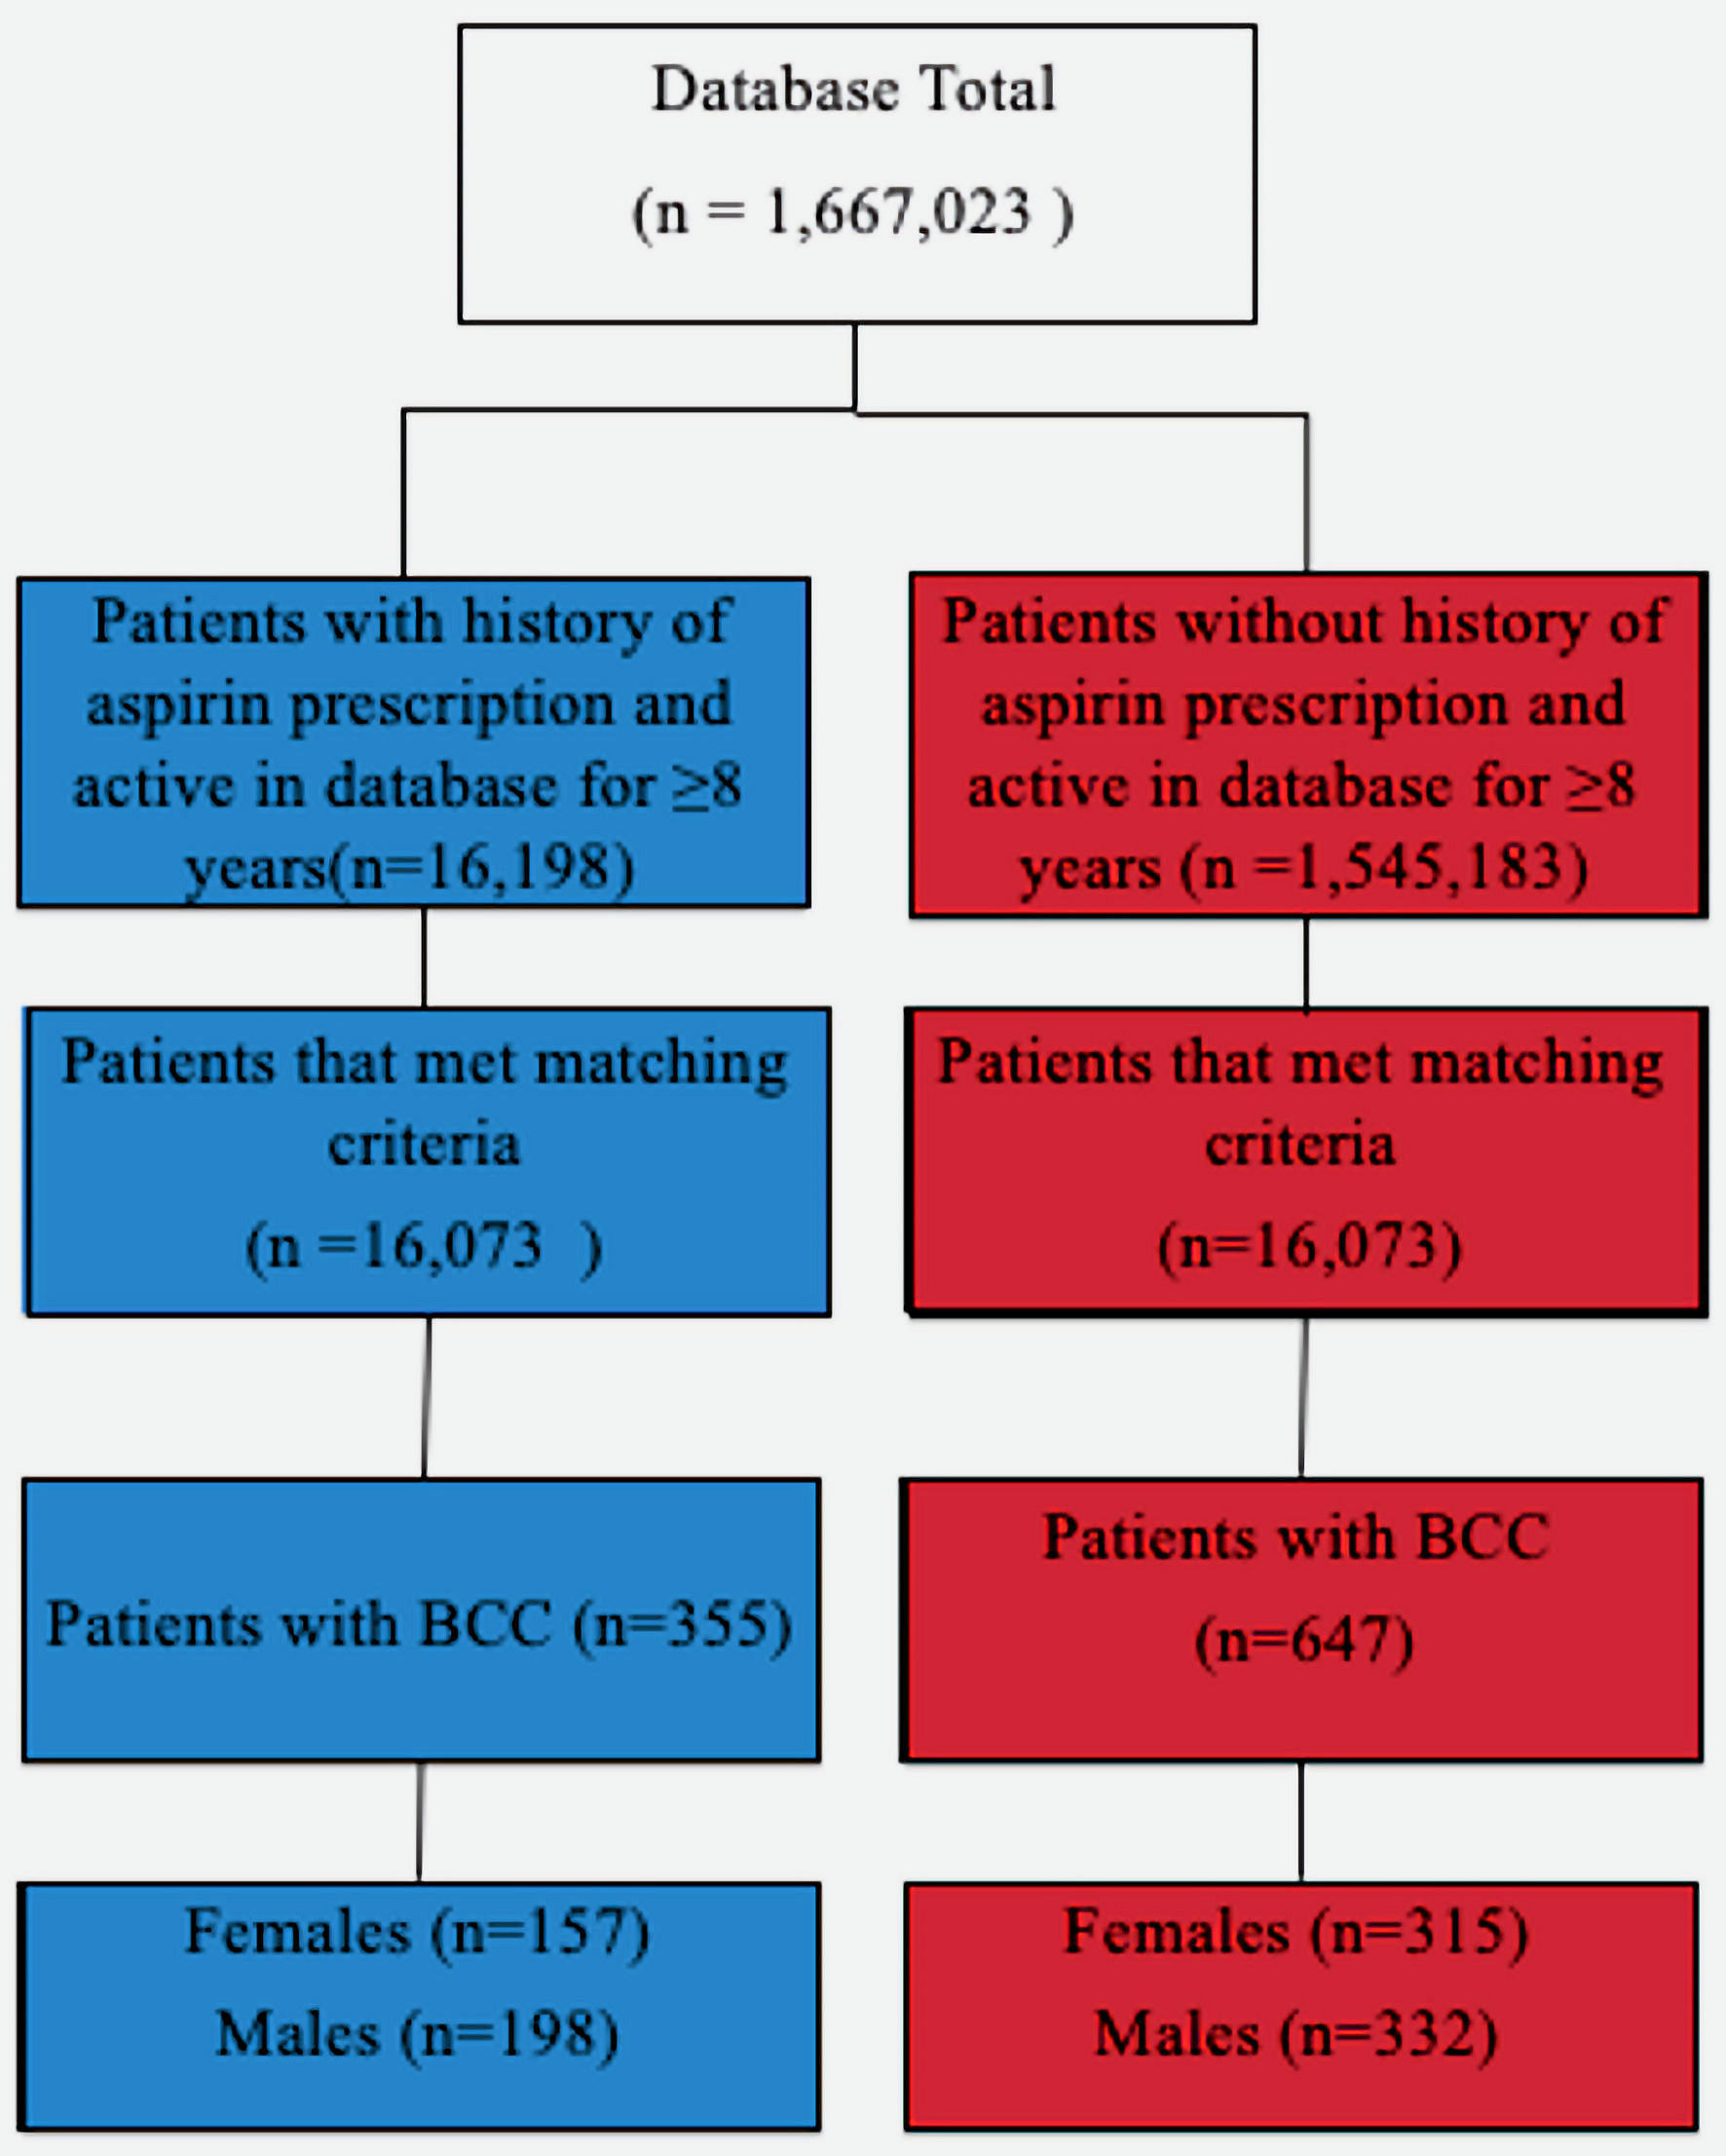
Figure 1. Diagram depicting the grouping of patients based on various criteria. BCC: basal cell carcinoma.
| World Journal of Oncology, ISSN 1920-4531 print, 1920-454X online, Open Access |
| Article copyright, the authors; Journal compilation copyright, World J Oncol and Elmer Press Inc |
| Journal website https://www.wjon.org |
Original Article
Volume 13, Number 6, December 2022, pages 343-349
The Association Between Aspirin and Basal Cell Carcinoma: A Clinical and Financial Analysis
Figures
Tables
| Study | Site | Region of residence known | Healthcare costs | Aspirin only | BCC only | > 1 US state | Self-reported |
|---|---|---|---|---|---|---|---|
| BCC: basal cell carcinoma. | |||||||
| Torti et al, 2011 [16] | Yes | Yes | No | No | No | No | Yes |
| Cahoon et al, 2012 [17] | Unclear | Yes | No | No | No | Yes | Yes |
| Clouser et al, 2009 [18] | No | Yes | No | No | No | No | Yes |
| Jeter et al, 2012 [10] | No | Yes | No | No | No | Yes | Yes |
| Johannesdottir et al, 2012 [19] | Yes | Yes | No | No | No | No | No |
| Ma et al, 2020 [20] | No | Yes | No | No | No | Yes | Partial |
| Muranushi et al, 2016 [21] | No | Partial | No | No | No | Yes | Partial |
| Passarelli et al, 2018 [22] | Yes | Yes | No | No | No | Yes | Yes |
| Reinau et al, 2015 [23] | No | Yes | No | No | No | No | No |
| Zhu et al, 2015 [24] | No | Yes | No | Yes | No | Yes | Partial |
| Frankel et al, 2022 | Yes | Yes | Yes | Yes | Yes | Yes | No |
| Term | Description |
|---|---|
| Total paid | The sum of all reimbursements for claims captured by query represented in total, and for each set of criteria including: code, age, region, state, service location, year, and quarter. |
| Average paid/claim | The total reimbursement divided by the number of non-zero records represented in total, and for each set of criteria, including: code, age, region, state, service location, year, and quarter. |
| Average paid/event | The total reimbursement divided by the number of non-zero records represented in total and for each set of criteria including: code, age, region, state, service location, year, and quarter. |
| Average paid/patient | The total reimbursement divided by the number patients represented in total and for each set of criteria including: code, age, region, state, service location, year, and quarter. |
| Average length of stay | The average complete number of days reported per inpatient visit represented in total and for each set of criteria including: code, age, region, state, service location, year, and quarter. |