World Journal of Oncology, ISSN 1920-4531 print, 1920-454X online, Open Access
Article copyright, the authors; Journal compilation copyright, World J Oncol and Elmer Press Inc
Journal website https://www.wjon.org

Original Article

Volume 14, Number 2, April 2023, pages 135-144


Improving Gastrointestinal Cancer Care by Enhanced Recovery Protocol Implementation

Figures

Figure 1.
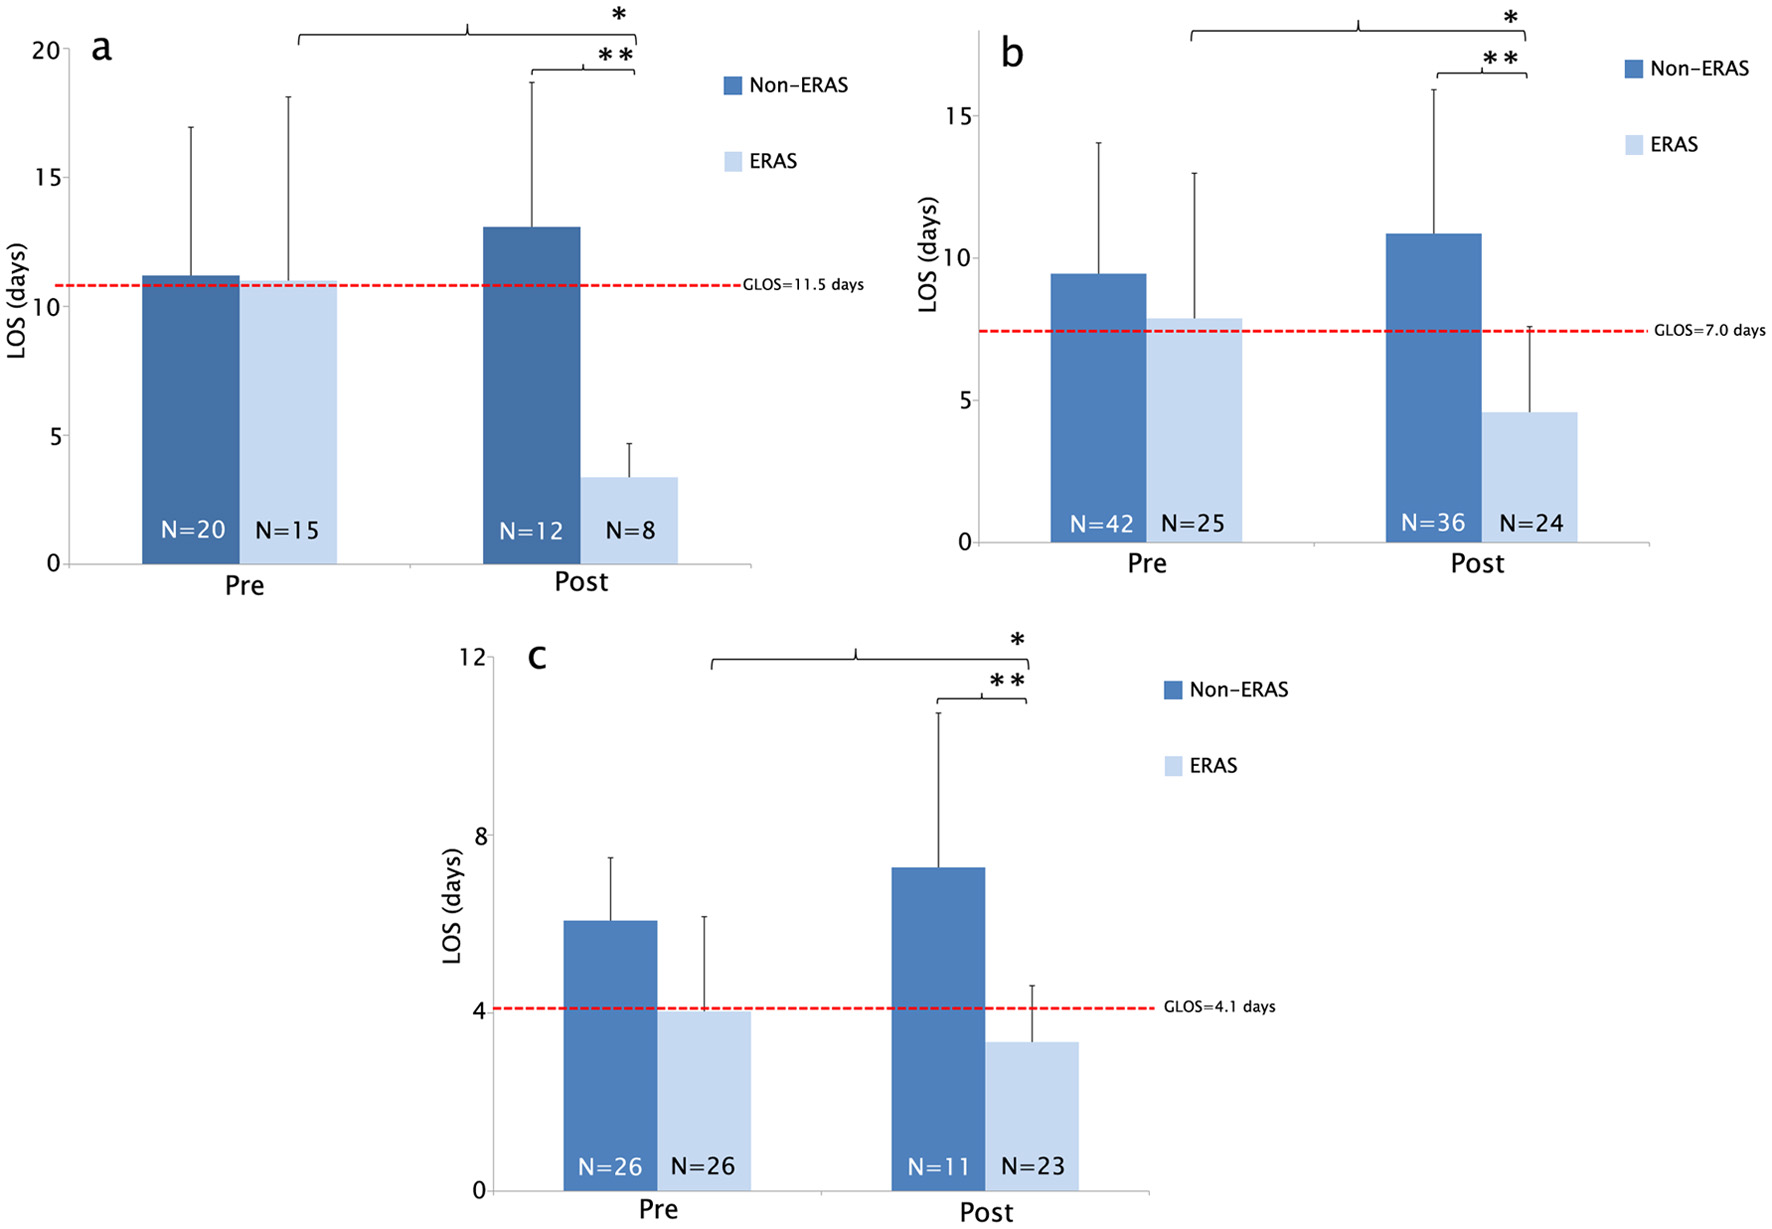
Figure 1. (a) Average LOS was significantly reduced in the ERP participating group DRG 329 at HCH. LOS significantly improved among ERP participating surgeons when compared before and after ERP implementation (*Reduction in LOS (days) 11.0 vs. 3.375, *P = 0.001). LOS significantly improved in patients undergoing ERP compared to patients undergoing non-ERP (**Reduction in LOS (days) 13.0833 vs. 3.375 (**P = 6.99 × 10⁻⁵)). (b) Average LOS was significantly reduced in the ERP participating group DRG 330 at HCH. LOS significantly improved among ERP participating surgeons when compared to before and after ERP implementation (*Reduction in LOS (days) 7.88 vs. 4.58 (*P = 0.008)). LOS significantly improved in patients undergoing ERP compared to patients undergoing non-ERP (**Reduction in LOS (days) 10.861 vs. 4.583 (**P = 1.31 × 10⁻⁷)). (c) Average LOS was significantly reduced in ERP participating group DRG 331 at HCH. LOS significantly improved among ERP participating surgeons when compared before and after ERP implementation (*Reduction in LOS (days) 4.03 vs. 3.34 (*P = 0.1689)). LOS significantly improved in patients undergoing ERP compared to patients undergoing non-ERP (**Reduction in LOS (days) 7.272 vs. 3.34 (**P = 0.004)). ERP: enhanced recovery protocol; DRG: diagnostic-related group; LOS: length of stay; HCH: Holy Cross Hospital.
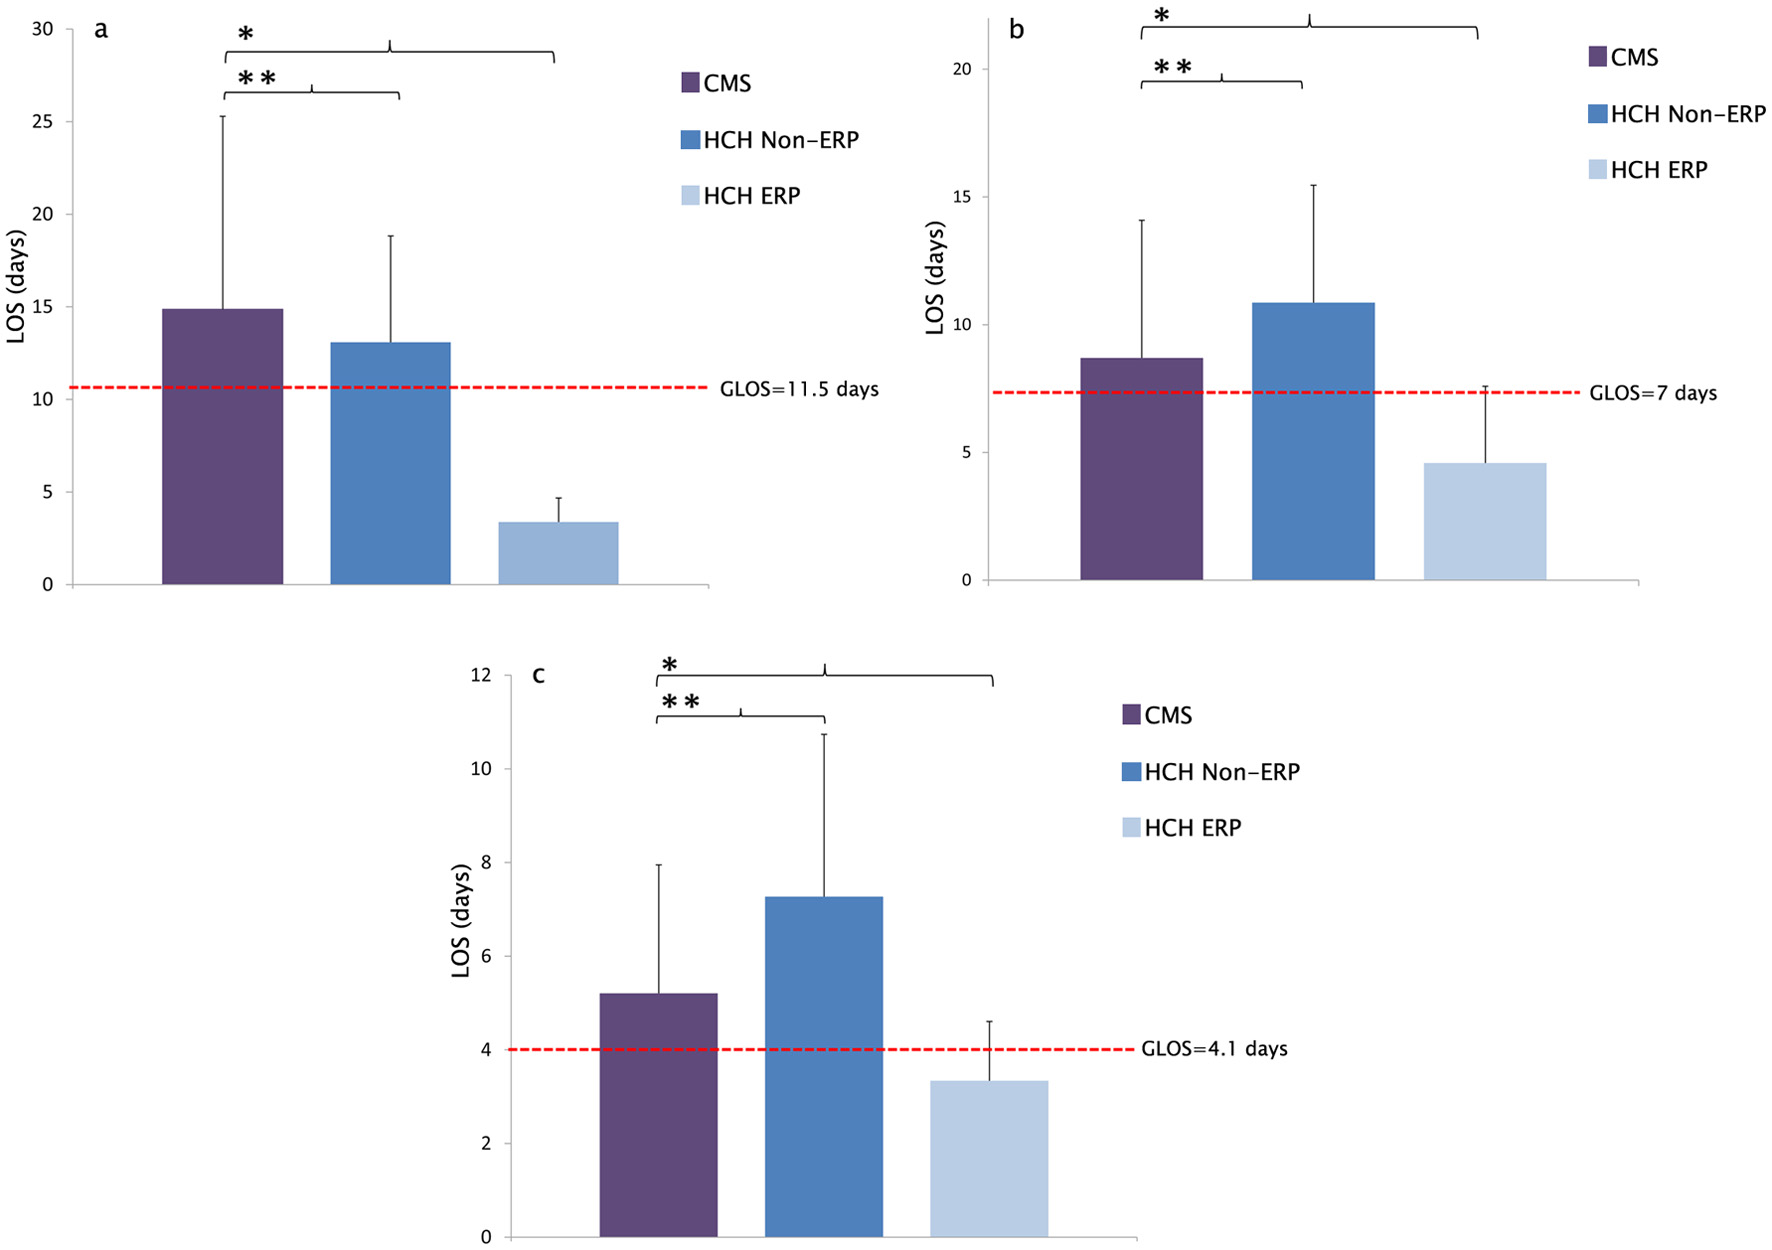
Figure 2.
Figure 2. (a) CMS average LOS distribution for DRG 329 (2007 - 2012) compared with HCH. LOS significantly improved in patients undergoing ERP compared to CMS LOS (*Reduction in LOS (days) 14.870 vs. 3.375 (*P = 5.76 × 10⁻⁹). There was no significant difference in LOS between non-ERP and CMS (**Reduction in LOS (days) 14.87 vs. 13.083 (**P = 0.324)). (b) CMS average LOS distribution for DRG 330 (2007 - 2012) compared with HCH. LOS significantly improved in patients undergoing ERP compared to CMS LOS (*Reduction in LOS (days) 8.73 vs. 4.58 (*P = 2.03 × 10⁻⁶). There was no significant difference in LOS between non-ERP and CMS (**Difference in LOS (days) 8.73 vs. 10.861 (**P = 0.01)). (c) CMS average LOS distribution for DRG-331 (2007 - 2012) compared with HCH. LOS significantly improved in patients undergoing ERP compared to CMS LOS (*Reduction in LOS (days) 5.2 vs. 3.34 (*P = 0.002)). There was no significant difference in LOS between non-ERP and CMS (**Difference in LOS (days) 5.2 vs. 7.27 (**P = 0.045)). ERP: enhanced recovery protocol; DRG: diagnostic-related group; LOS: length of stay; HCH: Holy Cross Hospital.
Figure 3.
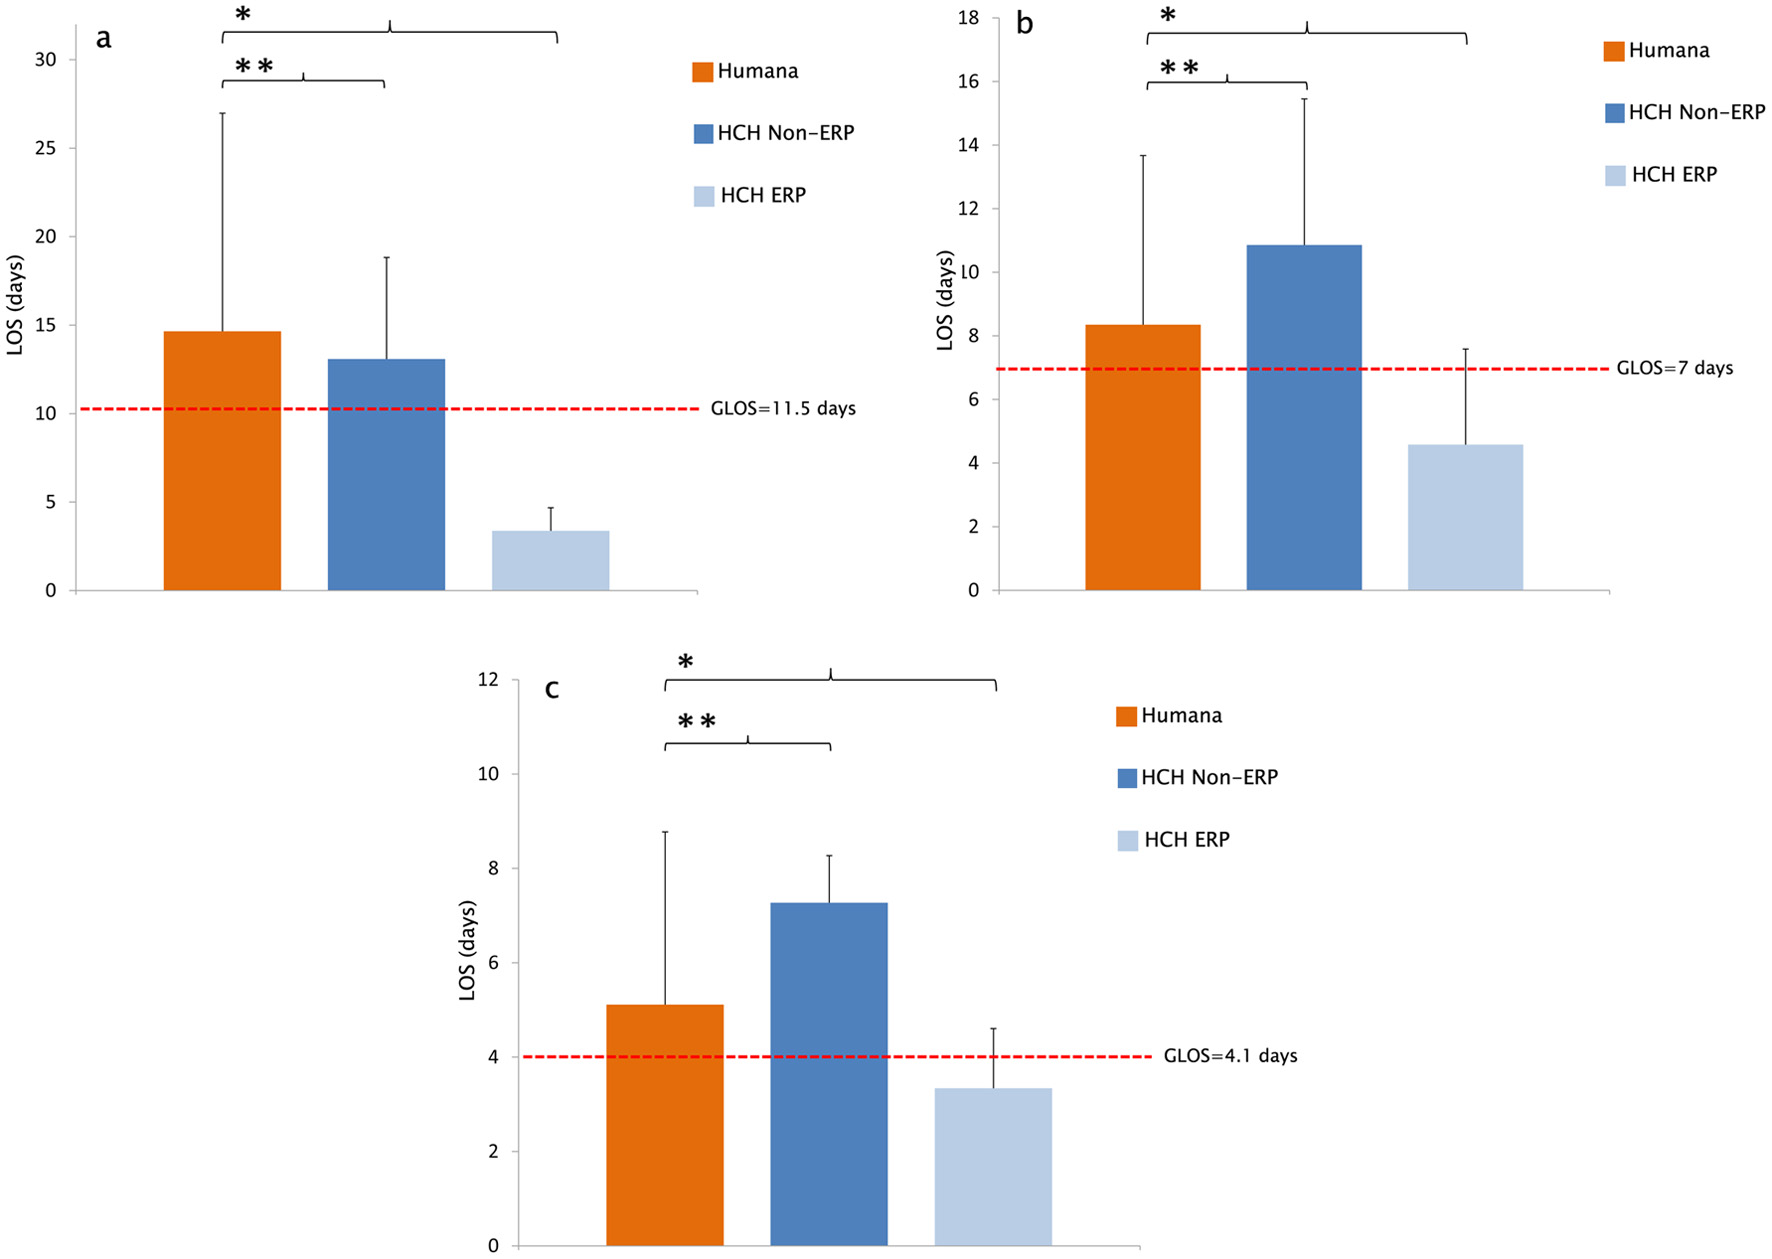
Figure 3. (a) Humana average LOS distribution for DRG 329 (2007 - 2015) compared with HCH. LOS significantly improved in patients undergoing ERP compared to Humana LOS (*Reduction in LOS (days) 14.65 vs. 3.375 (*P = 1.28 × 10⁻¹⁰)). There was no significant difference in LOS between non-ERP and Humana (**Reduction in LOS (days) 14.87 vs. 13.08 (**P = 0.354)). (b) Humana average LOS distribution for DRG 330 (2007 - 2015) compared with HCH. LOS significantly improved in patients undergoing ERP compared to Humana LOS (*Reduction in LOS (days) 8.35 vs. 4.58 (*P = 2.89 × 10⁻⁵)). There was no significant difference in LOS between non-ERP and Humana (**Difference in LOS (days) 8.35 vs. 10.86 (**P = 0.354)). (c) Humana average LOS distribution for DRG 331 (2007 - 2015) compared with HCH. LOS significantly improved in patients undergoing ERP compared to Humana LOS (*Reduction in LOS (days) 5.11 vs. 3.34 (*P = 0.0001)). There was no significant difference in LOS between non-ERP and Humana (**Difference in LOS (days) 5.11 vs. 7.27 (**P = 0.354)). ERP: enhanced recovery protocol; DRG: diagnostic-related group; LOS: length of stay; HCH: Holy Cross Hospital.
Figure 4.
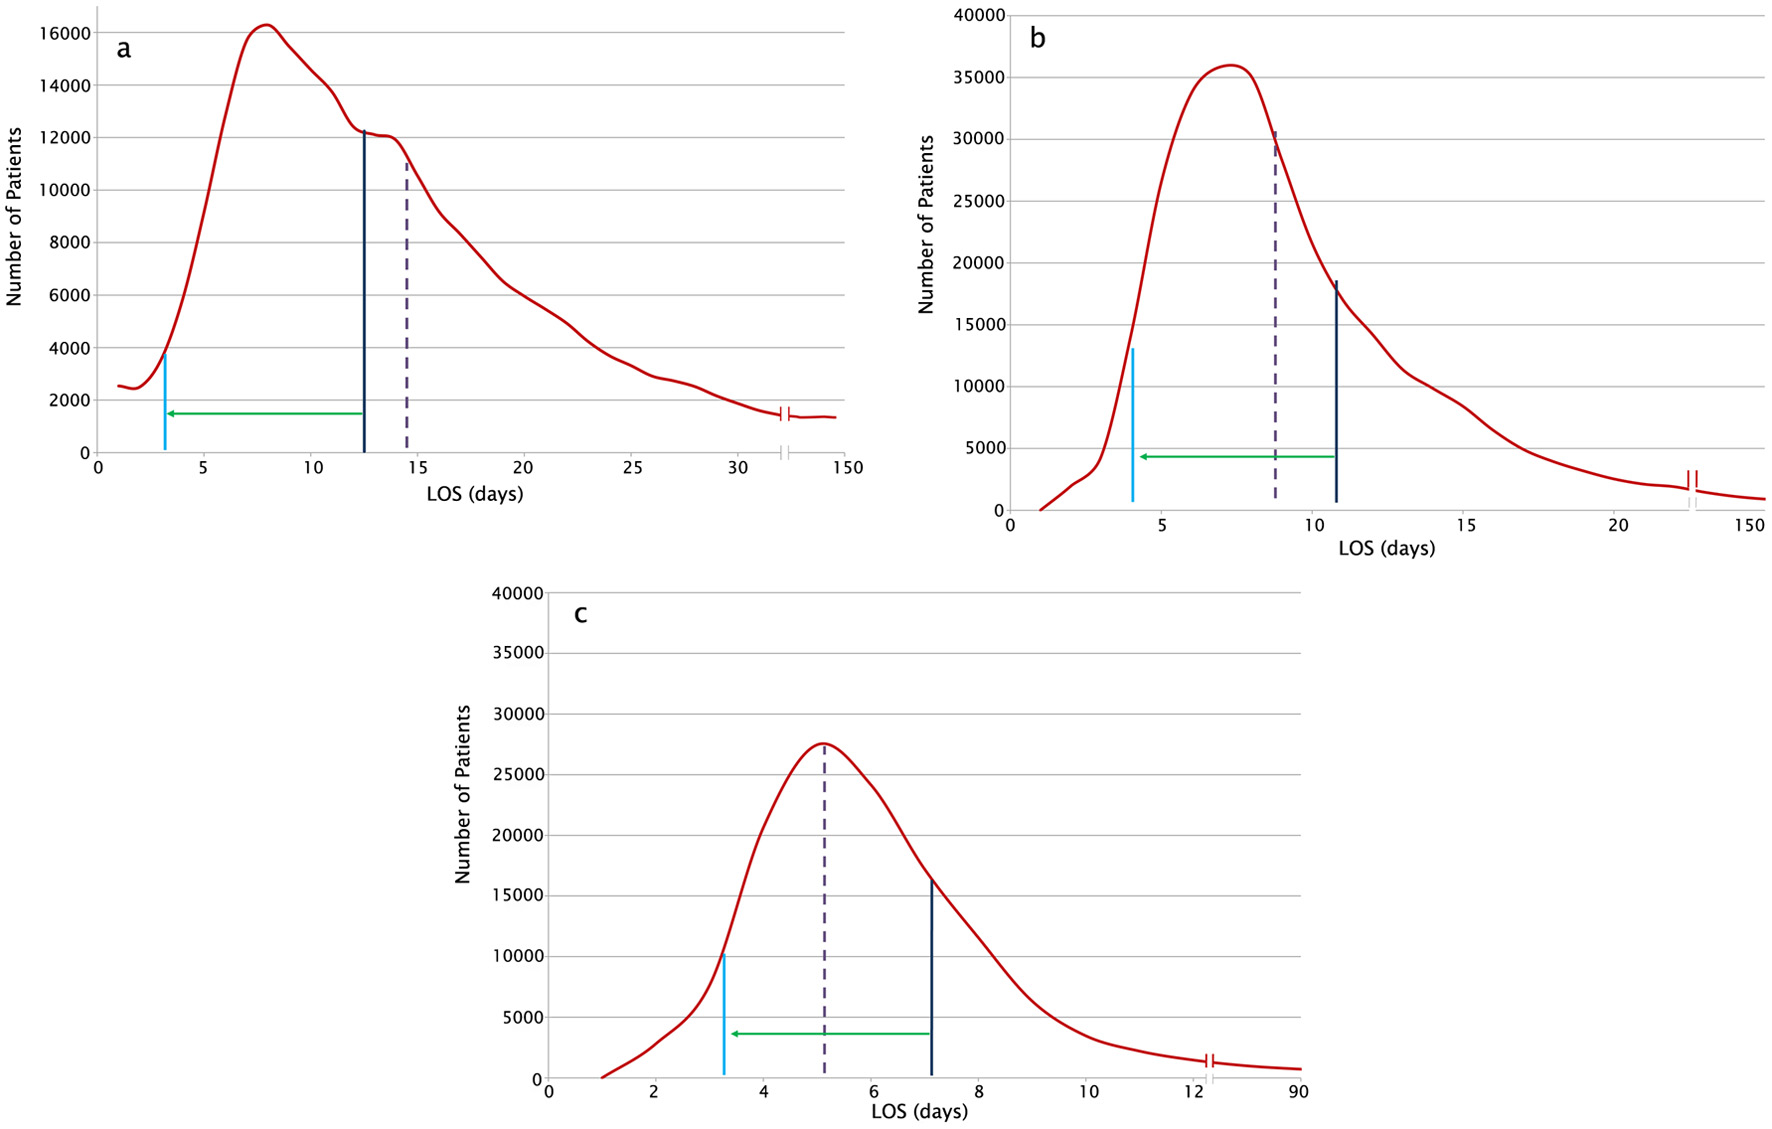
Figure 4. (a) The curve plots the distribution of LOS for DRG 329 at all hospitals in the CMS database. HCH non-ERP LOS is represented by the dark blue line. HCH ERP LOS is represented by the light blue line. CMS LOS is represented by the dashed purple line. The green arrow demonstrates the migration along the distribution curve, bringing HCH into the left skew after implementation of ERP. Reduction in LOS (days) 14.870 vs. 3.375 (P = 5.76 × 10⁻⁹). (b) The curve plots the distribution of LOS for DRG 330 at all hospitals in the CMS database. HCH non-ERP LOS is represented by the dark blue line. HCH ERP LOS is represented by the light blue line. CMS LOS is represented by the dashed purple line. The green arrow demonstrates the migration along the distribution curve, bringing HCH into the left skew after implementation of ERP. Reduction in LOS (days) 8.73 vs. 4.583 (P = 2.039 × 10⁻⁶). (c) The curve plots the distribution of LOS for DRG 331 at all hospitals in the CMS database. HCH non-ERP LOS is represented by the dark blue line. HCH ERP LOS is represented by the light blue line. CMS LOS is represented by the dashed purple line. The green arrow demonstrates the migration along the distribution curve, bringing HCH into the left skew after implementation of ERP. Reduction in LOS (days) 5.20 vs. 3.348 (P = 0.002). ERP: enhanced recovery protocol; DRG: diagnostic-related group; LOS: length of stay; HCH: Holy Cross Hospital.
Figure 5.
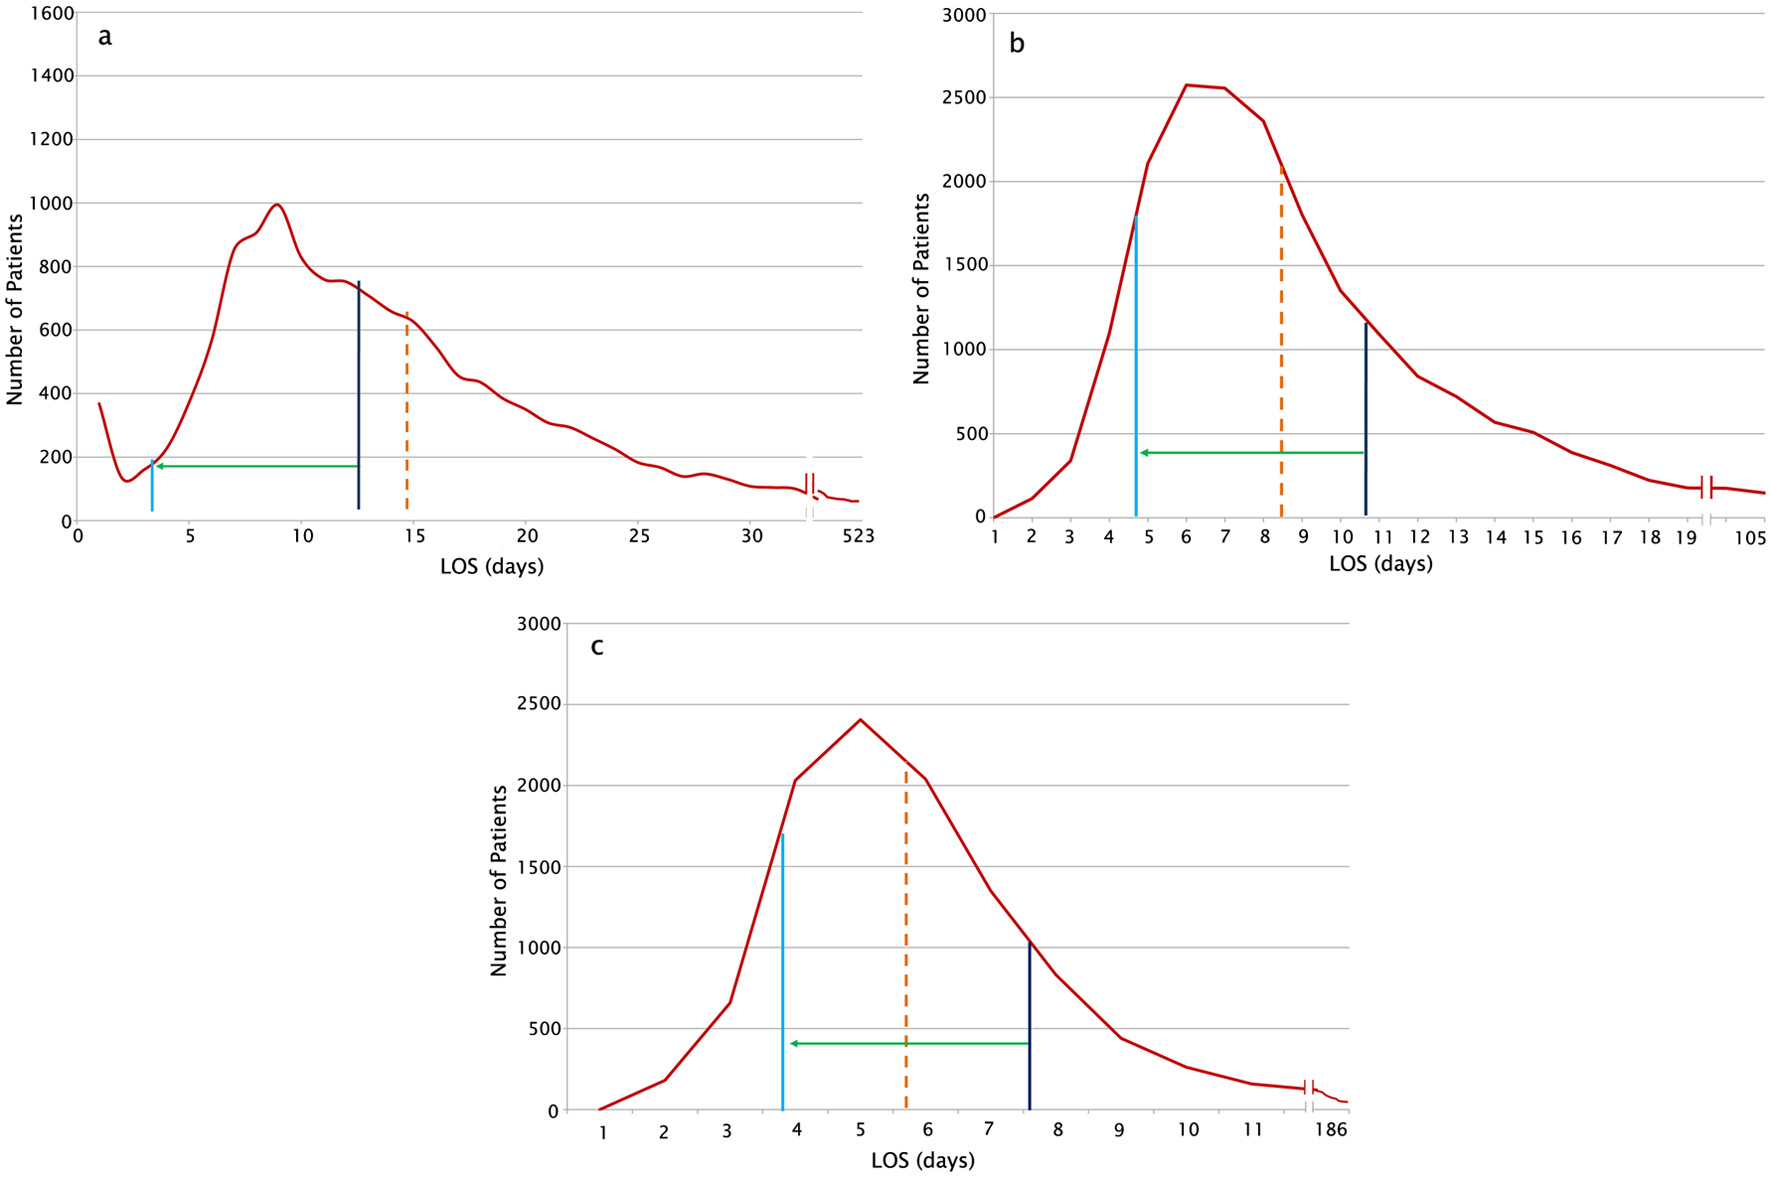
Figure 5. (a) The curve plots the distribution of LOS for DRG 329 at all hospitals in the Humana database. HCH non-ERP LOS is represented by the dark blue line. HCH ERP LOS is represented by the light blue line. Humana LOS is represented by the dashed orange line. The green arrow demonstrates the migration along the distribution curve, bringing HCH into the left skew after implementation of ERP. Reduction in LOS (days) 14.65 vs. 3.37 (P = 1.28 × 10⁻¹⁰). (b) The curve plots the distribution of LOS for DRG 330 at all hospitals in the Humana database. HCH non-ERP LOS is represented by the dark blue line. HCH ERP LOS is represented by the light blue line. Humana LOS is represented by the dashed orange line. The green arrow demonstrates the migration along the distribution curve, bringing HCH into the left skew after implementation of ERP. Reduction in LOS (days) 8.35 vs. 4.58 (P = 2.89 × 10⁻⁵). (c) The curve plots the distribution of LOS for DRG 331 at all hospitals in the Humana database. HCH non-ERP LOS is represented by the dark blue line. HCH ERP LOS is represented by the light blue line. Humana LOS is represented by the dashed orange line. The green arrow demonstrates the migration along the distribution curve, bringing HCH into the left skew after implementation of ERP. Reduction in LOS (days) 8.35 vs. 4.58 (P = 2.89 × 10⁻⁵). ERP: enhanced recovery protocol; DRG: diagnostic-related group; LOS: length of stay; HCH: Holy Cross Hospital.

Tables

Table 1. Preoperative, Intraoperative, and Postoperative Care Protocols for the Patients Undergoing ERP and not Undergoing ERP
 
ERPNon-ERP
ERP: enhanced recovery protocol; DVT: deep vein thrombosis; NGT: nasogastric tube; IV: intravenous.
Perioperative
  Counseling and educationPatient provided counseling, booklet, and YouTube video on recovery program. Pre-habilitation initiated.At discretion of surgeon
  Fluids and fastingFluid carbohydrate loading until 2 h before surgery. No solids foods after midnight.No fluids or solid food allowed after midnight before surgery.
  Bowel preparationMinimal bowel preparationAt discretion of surgeon
  ProphylaxisDVT, infection, and hypothermia prophylaxis as per guidelinesDVT, infection, and hypothermia prophylaxis as per guidelines
Intraoperative
  AnalgesiaMultimodal analgesia with no or short-acting premedication, minimal sedation and narcotics, routine use of nerve blocks.At discretion of surgeon
  NGTSparing use of NGT, early removal postoperativelyRoutine use at discretion of surgeon
  Urinary catheterSparing use of Foley, early removal postoperativelyRoutine use at discretion of surgeon
  DrainSparing use of drain, early removal postoperativelyRoutine use at discretion of surgeon
  Surgical approachMinimally invasive: laparoscopic/roboticMinimally invasive: laparoscopic/robotic
  Intravenous fluidsAvoid salt and water overload, minimal administration, dependent on operationAt discretion of surgeon
  Hypothermia preventionActive warm air blanketActive warm air blanket
Postoperative
  AnalgesiaMultimodal with minimal opioidsAt discretion of surgeon
  MobilizationEarly and frequentAt discretion of surgeon
  NutritionEarly oral nutrition, gum chewingAt discretion of surgeon
  IV fluidsMinimal IV fluid hydrationAt discretion of surgeon


Table 2. DRG, 2007 - 2012, for Bowel Surgeries Which Were Utilized to Identify Cases for Chart Review
 
DRG codeDescription
DRG is a classification of patients by diagnosis or surgical procedure based on the premise that treatment of similar medical diagnoses generates similar costs. This system sometimes includes age and classifies into major diagnostic categories, each containing specific diseases, disorders or procedures, for the purpose of determining payment of hospitalization charges. This system of classification was developed as a collaborative project by Robert B. Fetter, PhD, of the Yale School of Management and John D. Thompson, MPH of the Yale School of Public Health. DRG: diagnostic-related group.
329Major bowel surgery with major complication or comorbidities
330Major bowel surgery with comorbid conditions
331Major bowel surgery without comorbid conditions