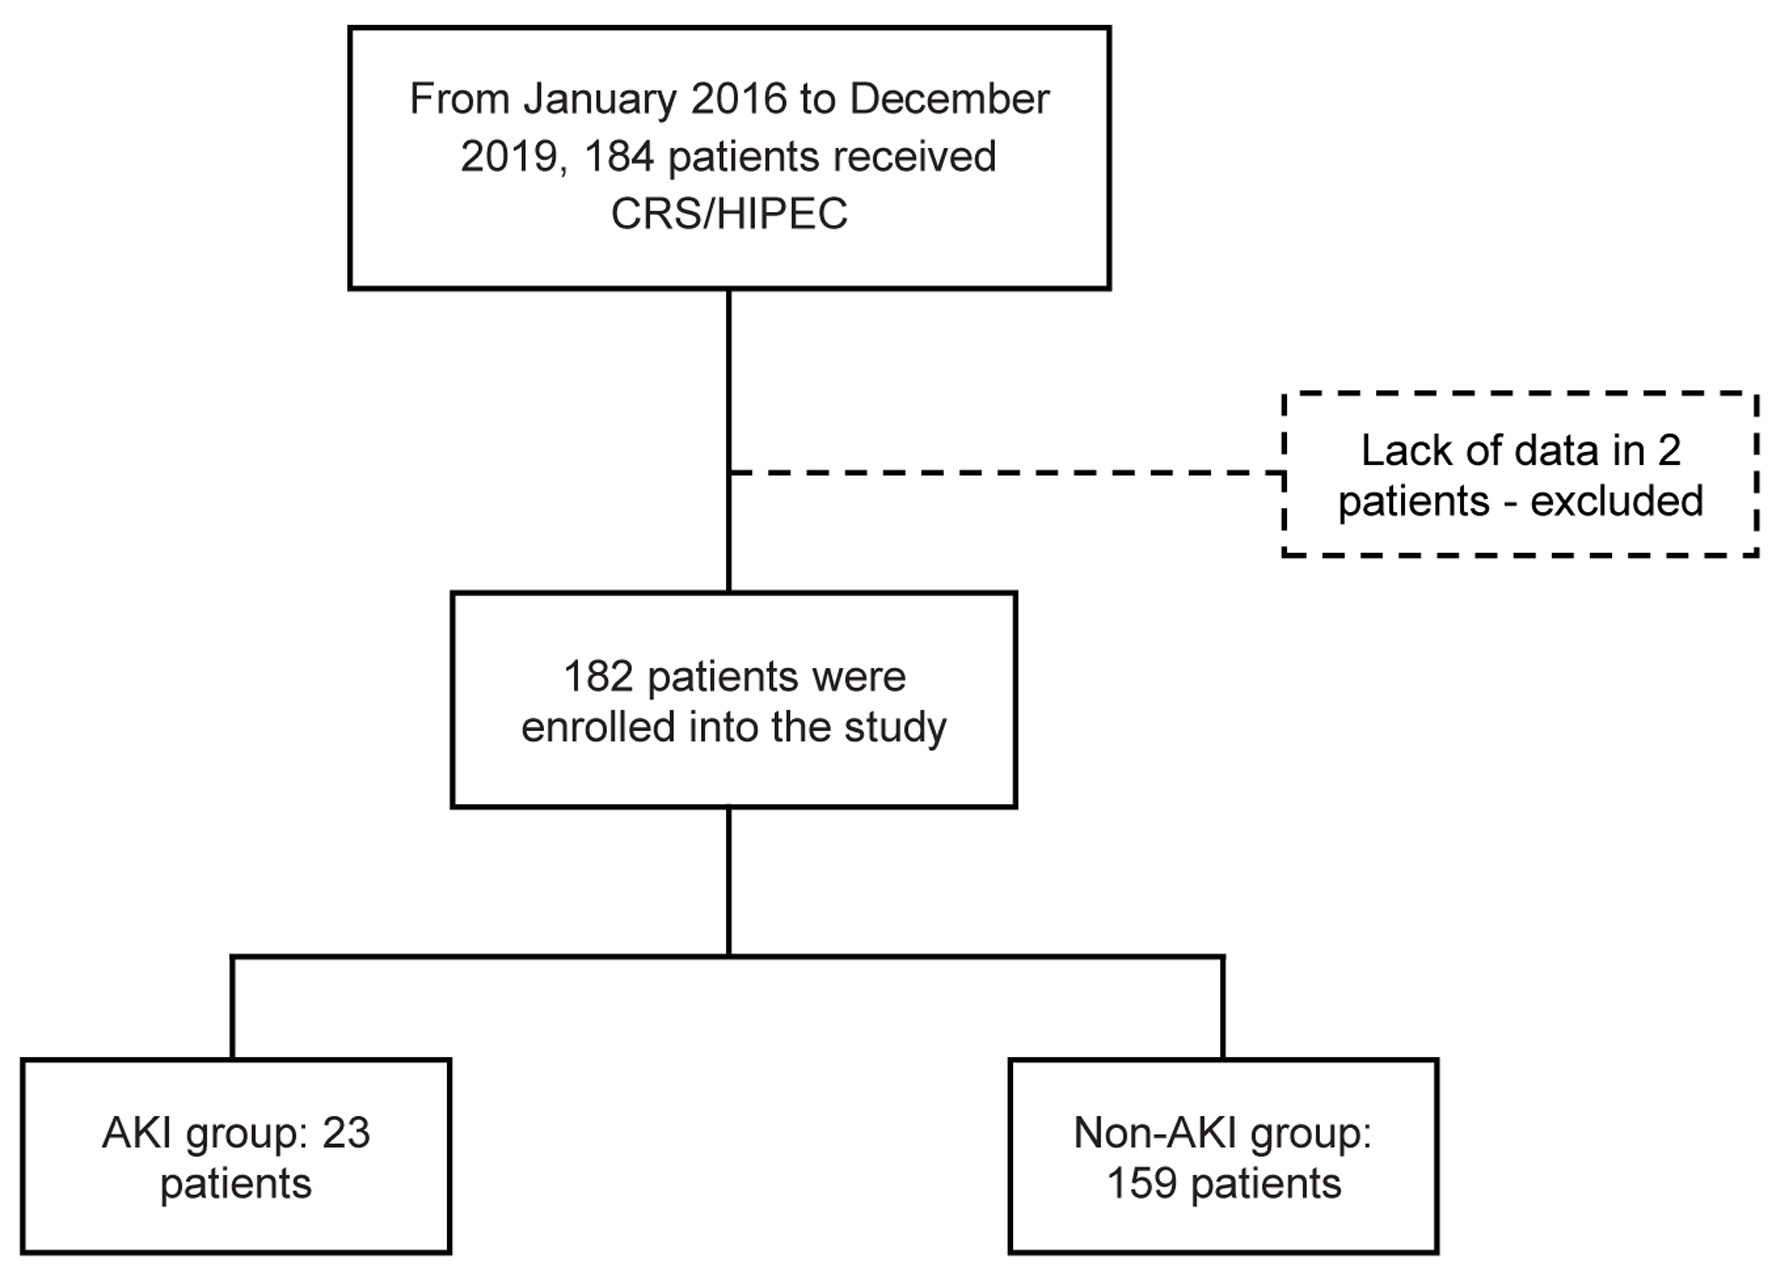
Figure 1. Flowchart of patient enrollment and study population. CRS/HIPEC: cytoreductive surgery with hyperthermic intraperitoneal chemotherapy.
| World Journal of Oncology, ISSN 1920-4531 print, 1920-454X online, Open Access |
| Article copyright, the authors; Journal compilation copyright, World J Oncol and Elmer Press Inc |
| Journal website https://www.wjon.org |
Original Article
Volume 13, Number 6, December 2022, pages 370-378
Acute Kidney Injury After Cytoreductive Surgery and Hyperthermic Intraperitoneal Chemotherapy in a Portuguese Population
Figure
Tables
| All (n = 182) | AKI (n = 23) | Non-AKI (n = 159) | P value | |
|---|---|---|---|---|
| Descriptive statistics are presented as mean ± SD, or number (percentage). P-value < 0.05 was considered to be statistically significant. AKI: acute kidney injury; BMI: body mass index; CC score: completeness of cytoreduction score; CKD: chronic kidney disease; DM: diabetes mellitus; ECOG-PS: Eastern Cooperative Oncology Group performance status; eGFR: estimated glomerular filtration rate; HF: heart failure; HIPEC: hyperthermic intraperitoneal chemotherapy; HTN: hypertension; ICU: intensive care unit; IQR: interquartile range; NSAID: non-steroidal anti-inflammatory drug; PCI: peritoneal cancer index; RAS: renin-angiotensin system; SD: standard deviation. | ||||
| Gender male (%) | 125 (68.7%) | 15 (65.2%) | 110 (69.2%) | 0.701 |
| Age (years) (mean ± SD) | 58.0 ± 12.1 | 60.3 ± 11.9 | 57.7 ± 12.2 | 0.333 |
| ECOG-PS, n (%) | ||||
| 0 | 151 (83.0%) | 18 (78.3%) | 133 (84.7%) | 0.432 |
| 1 | 29 (15.9%) | 5 (21.7%) | 24 (15.3%) | 0.432 |
| ≥ 2 | 0 (0%) | - | ||
| Unknown | 2 (1.1%) | 0 (0%) | 2 (1.3%) | - |
| BMI (mean ± SD) | 26.2 ± 5.6 | 26.7 ± 7.1 | 26.1 ± 5.2 | 0.643 |
| CKD history | 9 (4.9%) | 4 (17.4%) | 5 (3.1%) | 0.016 |
| Stage 1 | 0 (0%) | 0 (0%) | 0 (0%) | - |
| Stage 2 | 1 (11.1%) | 1 (4.3%) | 0 (0%) | 0.126 |
| Stage 3a | 5 (55.6%) | 3 (13.0%) | 2 (1.3%) | 0.015 |
| Stage 3b | 3 (33.3%) | 0 (0%) | 3 (1.9%) | 1.000 |
| Stage ≥ 4 | 0 (0%) | 0 (0%) | 0 (0%) | - |
| Baseline eGFR (CKD-EPI mL/min/1.73 m2) (mean ± SD) | 91.3 ± 23 | 81.0 ± 29.8 | 92.6 ± 21.6 | 0.084 |
| Cancer type | ||||
| Colorectal | 63 (34.6%) | 7 (30.4%) | 56 (35.4%) | 0.638 |
| Mucinous appendix | 43 (23.6%) | 1 (4.3%) | 42 (26.6%) | 0.018 |
| Ovary | 27 (14.8%) | 7 (30.4%) | 20 (12.7%) | 0.025 |
| Pseudomyxoma peritonei | 20 (11.0%) | 2 (8.7%) | 18 (11.4%) | 1.000 |
| Mesothelioma | 12 (6.6%) | 4 (17.4%) | 8 (5.1%) | 0.026 |
| Gastric | 12 (6.6%) | 2 (8.7%) | 10 (6.3%) | 0.670 |
| Others | 5 (2.7%) | 0 (0%) | 5 (3.1%) | 1.00 |
| Previous chemotherapy | 59 (32.4%) | 9 (39.1%) | 50 (31.4%) | 0.461 |
| Previous chemotherapy agent | ||||
| Platinum agent (%) | 33 (18.1%) | 6 (26.1%) | 27 (17.5%) | 0.326 |
| Non-platinum agent (%) | 21 (11.5%) | 3 (13.0%) | 18 (11.7%) | 0.851 |
| Unknown | 5 (2.7%) | 0 0% | 5 (3.1%) | 1.000 |
| Comorbidity | ||||
| None | 110 (60.4%) | 12 (52.2%) | 98 (61.6%) | 0.386 |
| DM | 25 (13.7%) | 6 (26.1%) | 19 (11.9%) | 0.066 |
| HTN | 67 (36.8%) | 10 (43.5%) | 57 (35.8%) | 0.478 |
| HF | 4 (2.2%) | 1 (4.3%) | 3 (1.9%) | 0.420 |
| PCI, mean ± SD | 14 ± 9.3 | 16.4 ± 8.9 | 13.6 ± 9.3 | 0.193 |
| CC (%) | ||||
| 0 | 137 (75.3%) | 17 (77.3%) | 120 (79.5%) | 0.812 |
| 1 | 24 (13.2%) | 2 (9.1%) | 22 (14.6%) | 0.743 |
| 2 | 11 (6.0%) | 2 (9.1%) | 9 (6.0%) | 0.574 |
| 3 | 1 (0.5%) | 1 (4.5%) | 0 (0%) | 0.127 |
| Unknown | 9 (4.9%) | 1 (4.3%) | 8 (5.0%) | 1.000 |
| Bleeding during procedure | ||||
| ≤ 200 mL | 116 (63.7%) | 14 (60.9%) | 102 (64.6%) | 0.731 |
| > 200 mL | 65 (35.7%) | 9 (39.1%) | 56 (35.4%) | 0.731 |
| Unknown | 1 (0.5%) | |||
| HIPEC regimen (%) | ||||
| Mitomycin | 139 (76.4%) | 12 (52.2%) | 127 (80.4%) | 0.003 |
| Cisplatin | 42 (23.1%) | 11 (47.8%) | 31 (19.6%) | 0.003 |
| Unknown | 1 (0.5%) | - | ||
| Crystalloids reposition during procedure (mL) (mean ± SD) | 3,946.4 ± 1,156.5 | 4,176.1 ± 913.0 | 3,912.7 ± 1,186.7 | 0.309 |
| Hospitalization (days) | ||||
| Mean ± SD | 14.2 ±10.1 | 22.1 ± 17.8 | 13.1 ± 7.9 | 0.025 |
| Average (IQR) | 11 (9 - 15) | 15 (11 - 28) | 11 (9 - 13) | 0.010 |
| ICU admission | 63 (34.6%) | 8 (34.8%) | 55 (34.6%) | 0.986 |
| ICU duration (days) | ||||
| Mean ± SD | 1.7 ± 1.05 | 2.6 ± 2.1 | 1.6 ± 0.8 | 0.195 |
| Average (IQR) | 1 (1 - 2) | 2.5 (1.0 - 4.5) | 1.0 (1.0 - 2.0) | 0.570 |
| Infection | 54 (32.4%) | 11 (47.8%) | 48 (30.2%) | 0.091 |
| Medications | ||||
| NSAIDs | 21 (11.5%) | 5 (21.7%) | 16 (10.1%) | 0.101 |
| RAS | 30 (16.5%) | 4 (17.4%) | 26 (16.4%) | 1.000 |
| Antibiotics | 58 (31.9%) | 12 (52.2%) | 46 (28.9%) | 0.025 |
| Electrolyte disorders | ||||
| Hypomagnesemia | 84 (46.2%) | 13 (65.0%) | 71 (55.5%) | 0.475 |
| Hypophosphatemia | 98 (53.8%) | 9 (39.1%) | 89 (57.4%) | 0.118 |
| Hypokalemia | 41 (22.5%) | 6 (26.1%) | 35 (22.6%) | 0.709 |
| Hypocalcemia | 22 (12.1%) | 3 (17.6%) | 19 (21.6%) | 1.000 |
| Hyponatremia | 26 (14.3%) | 6 (26.1%) | 20 (12.8%) | 0.091 |
| OR (95% CI) | P value | |
|---|---|---|
| P-value < 0.05 was considered to be statistically significant. AKI: acute kidney disease; CI: confidence interval; CKD-EPI: Chronic Kidney Disease Epidemiology Collaboration; DM: diabetes mellitus; eGFR: estimated glomerular filtration rate; HIPEC: hyperthermic intraperitoneal chemotherapy; ICU: intensive care unit; OR: odds ratio. | ||
| DM | 0.39 (0.14 - 1.09) | 0.074 |
| Previous CKD | 0.15 (0.38 - 0.62) | 0.009 |
| Baseline eGFR (CKD-EPI mL/min/1.73 m2) | 1.02 (1.00 - 1.04) | 0.029 |
| Antibiotics | 0.37 (0.15 - 0.91) | 0.029 |
| Days in ICU | 2.06 (1.11 - 3.82) | 0.022 |
| Hospitalization (duration) | 1.06 (0.02 - 0.11) | 0.010 |
| HIPEC protocol | ||
| Cisplatin | 3.76 (1.52 - 9.31) | 0.040 |
| OR (95% CI) | P value | |
|---|---|---|
| P-value < 0.05 was considered to be statistically significant. AKI: acute kidney disease; CI: confidence interval; CKD-EPI: Chronic Kidney Disease Epidemiology Collaboration; eGFR: estimated glomerular filtration rate; HIPEC: hyperthermic intraperitoneal chemotherapy; ICU: intensive care unit; OR: odds ratio. | ||
| eGFR previous HIPEC (CKD-EPI mL/min/1.73 m2) | 0.96 (0.94 - 0.98) | 0.037 |
| Days in ICU | 2.42 (1.07 - 5.45) | 0.033 |
| HIPEC protocol | ||
| Cisplatin | 12.21 (1.26 - 109.70) | 0.025 |
| Mitomycin | Ref | |