World Journal of Oncology, ISSN 1920-4531 print, 1920-454X online, Open Access
Article copyright, the authors; Journal compilation copyright, World J Oncol and Elmer Press Inc
Journal website https://www.wjon.org

Original Article

Volume 14, Number 1, February 2023, pages 75-83


High Body Mass Index Was Associated With Human Epidermal Growth Factor Receptor 2-Positivity, Histological Grade and Disease Progression Differently by Age

Figures

Figure 1.
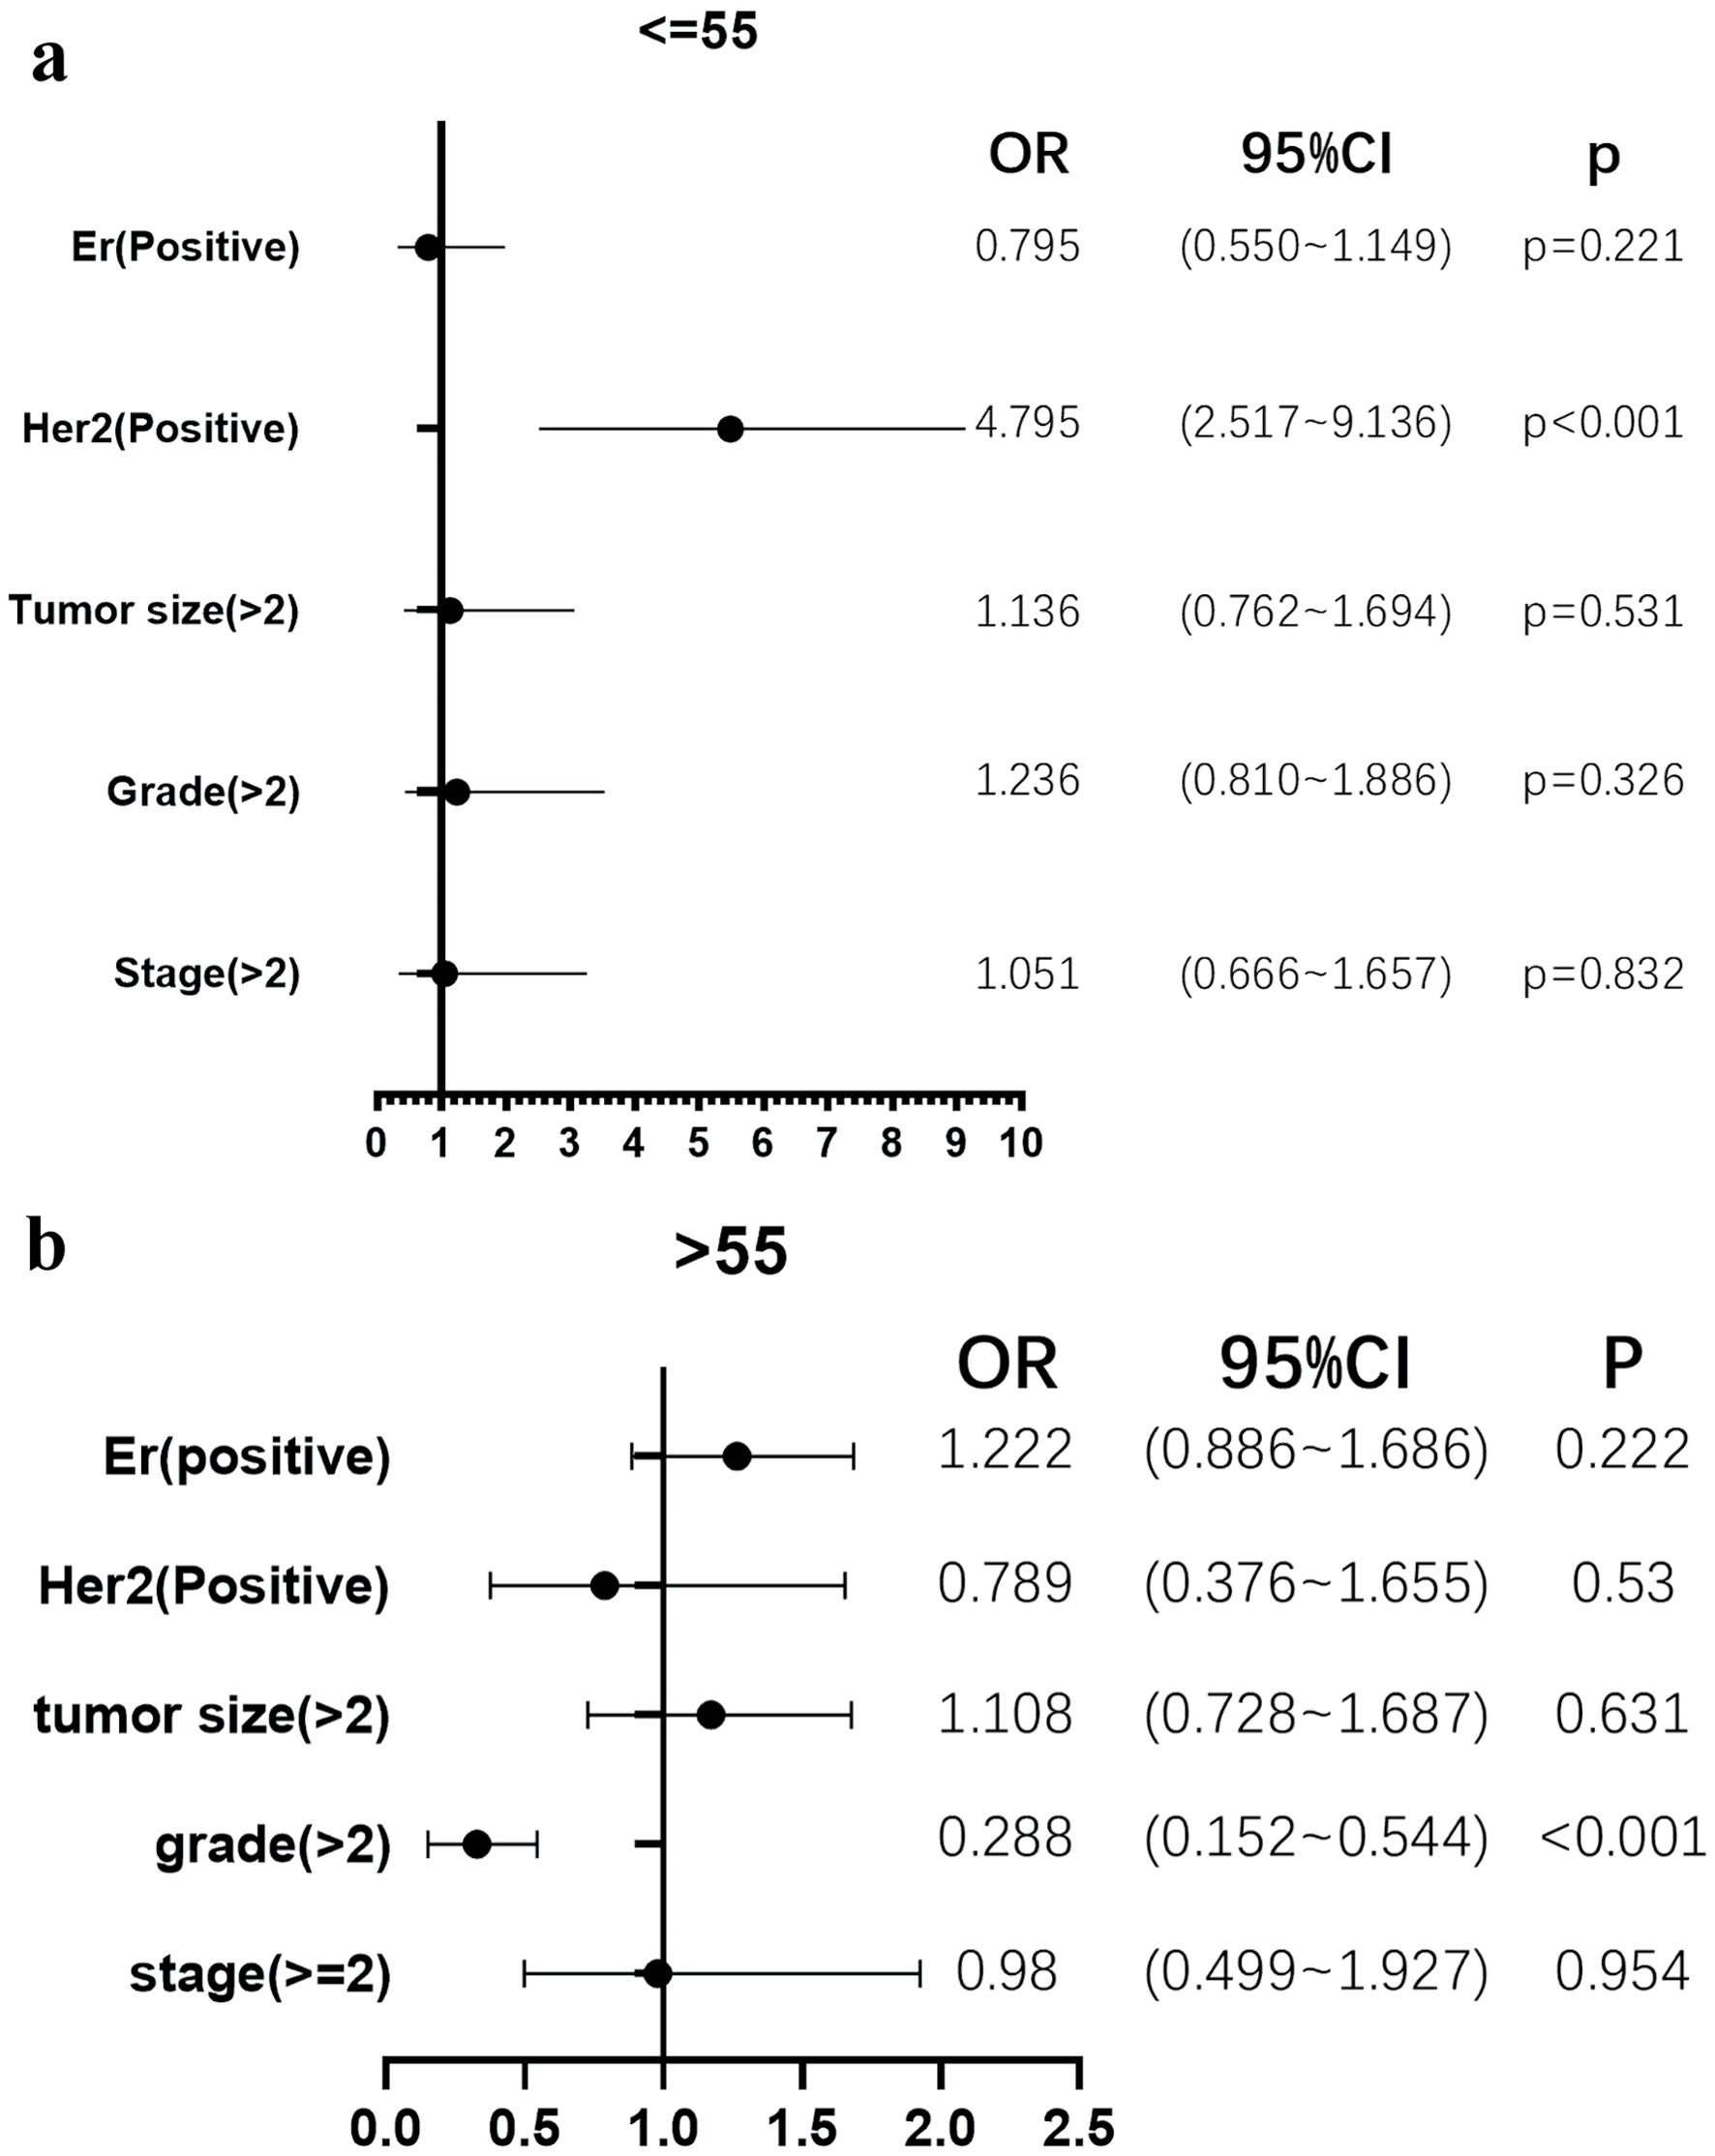
Figure 1. High body mass index (BMI) was associated with HER2 positivity in younger, but not in older patients, and was associated with lower histological grade in older, but not in younger patients. (a) The patient’s age group less than 55 years with high BMI are more likely to be HER2 positive (odds ratio (OR) = 4.795, 95% confidence interval (CI) = 2.517 - 9.136, P < 0.001) when compared to the breast cancer patients with normal weight. (b) Breast cancer patients older than 55 years were accompanied by high BMI, and they are more likely to have a tumor grade greater than 2 (OR = 0.288, 95% CI = 0.152 - 0.544, P < 0.001).
Figure 2.
Figure 2. (a, b) High body mass index (BMI) was associated with worse progression-free survival (PFS) in younger, but not in older patients. Breast cancer patients with high BMI are more likely to have “recurrence and distant recurrence” in a relatively short span of time (P = 0.0023) when compared to the normal BMI patients mainly among the breast cancer patients younger than 55 years (a); however, this difference was not observed in breast cancer patients older than 55 years (P = 0.4597) (b).

Tables

Table 1. Baseline Characteristics of Patient Demographics by BMI
 
CharacteristicsBMI (kg/m2)
18.5 - 24.9> 25.0
BMI: body mass index; ER: estrogen receptor; HER2: human epidermal growth factor receptor 2.
ER (positive)563600
ER (negative)171173
HER2 (positive)3290
HER2 (negative)133158
Tumor size (≤ 2)233190
Tumor size (> 2)171169
Grade (≤ 2)183197
Grade (> 2)10889
Stage (< 2)141123
Stage (≥ 2)10589


Table 2. Chi-Square Test Results Between Breast Cancer Patient Demographics by BMI and Age and Individuals Without Breast Cancer
 
Factors and levelsCancerControlχ2, P value
BMI: body mass index.
BMI (kg/m2)P = 0.350
  18.5 - 24.91,086680
  ≥ 25.01,421945
AgeP < 0.001
  ≤ 55894363
  > 551,186918


Table 3. Chi-Square Test for BMI Classification in the Patients With Breast Tumors at Different Ages
 
AgeVariablesCategoryBMI (kg/m2)χ2, P value
18.5 - 24.9≥ 25.0
BMI: body mass index; ER: estrogen receptor; HER2: human epidermal growth factor receptor 2.
≤ 55
ER0.221
Positive216176
Negative7981
HER2< 0.001
Positive1672
Negative6561
Tumor size0.531
≤ 214993
> 29673
Grade0.326
≤ 2127109
> 26670
Stage0.832
< 210168
≥ 28258
> 55
ER0.222
Positive347424
Negative9292
HER20.530
Positive1618
Negative6897
Tumor size0.631
≤ 28497
> 27596
Grade< 0.001
≤ 25688
> 24219
Stage0.954
< 24055
≥ 22331


Table 4. The Logistics Regression Analysis of BMI Classification of Tumor Patients at Different Ages
 
AgeVariablesCategoryBMI (kg/m2), OR (95% CI)
18.5 - 24.9≥ 25.0
BMI: body mass index; ER: estrogen receptor; HER2: human epidermal growth factor receptor 2; OR: odds ratio; CI: confidence interval.
≤ 55
ERPositive1.000 (referent)0.795 (0.550 - 1.149)
HER2Positive1.000 (referent)4.795 (2.517 - 9.136)
Tumor size> 21.000 (referent)1.136 (0.762 - 1.694)
Grade> 21.000 (referent)1.236 (0.810 - 1.886)
Stage≥ 21.000 (referent)1.051 (0.666 - 1.657)
> 55
ERPositive1.000 (referent)1.222 (0.886 - 1.686)
HER2Positive1.000 (referent)0.789 (0.376 - 1.655)
Tumor size> 21.000 (referent)1.108 (0.728 - 1.687)
Grade> 21.000 (referent)0.288 (0.152 - 0.544)
Stage≥ 21.000 (referent)0.980 (0.499 - 1.927)