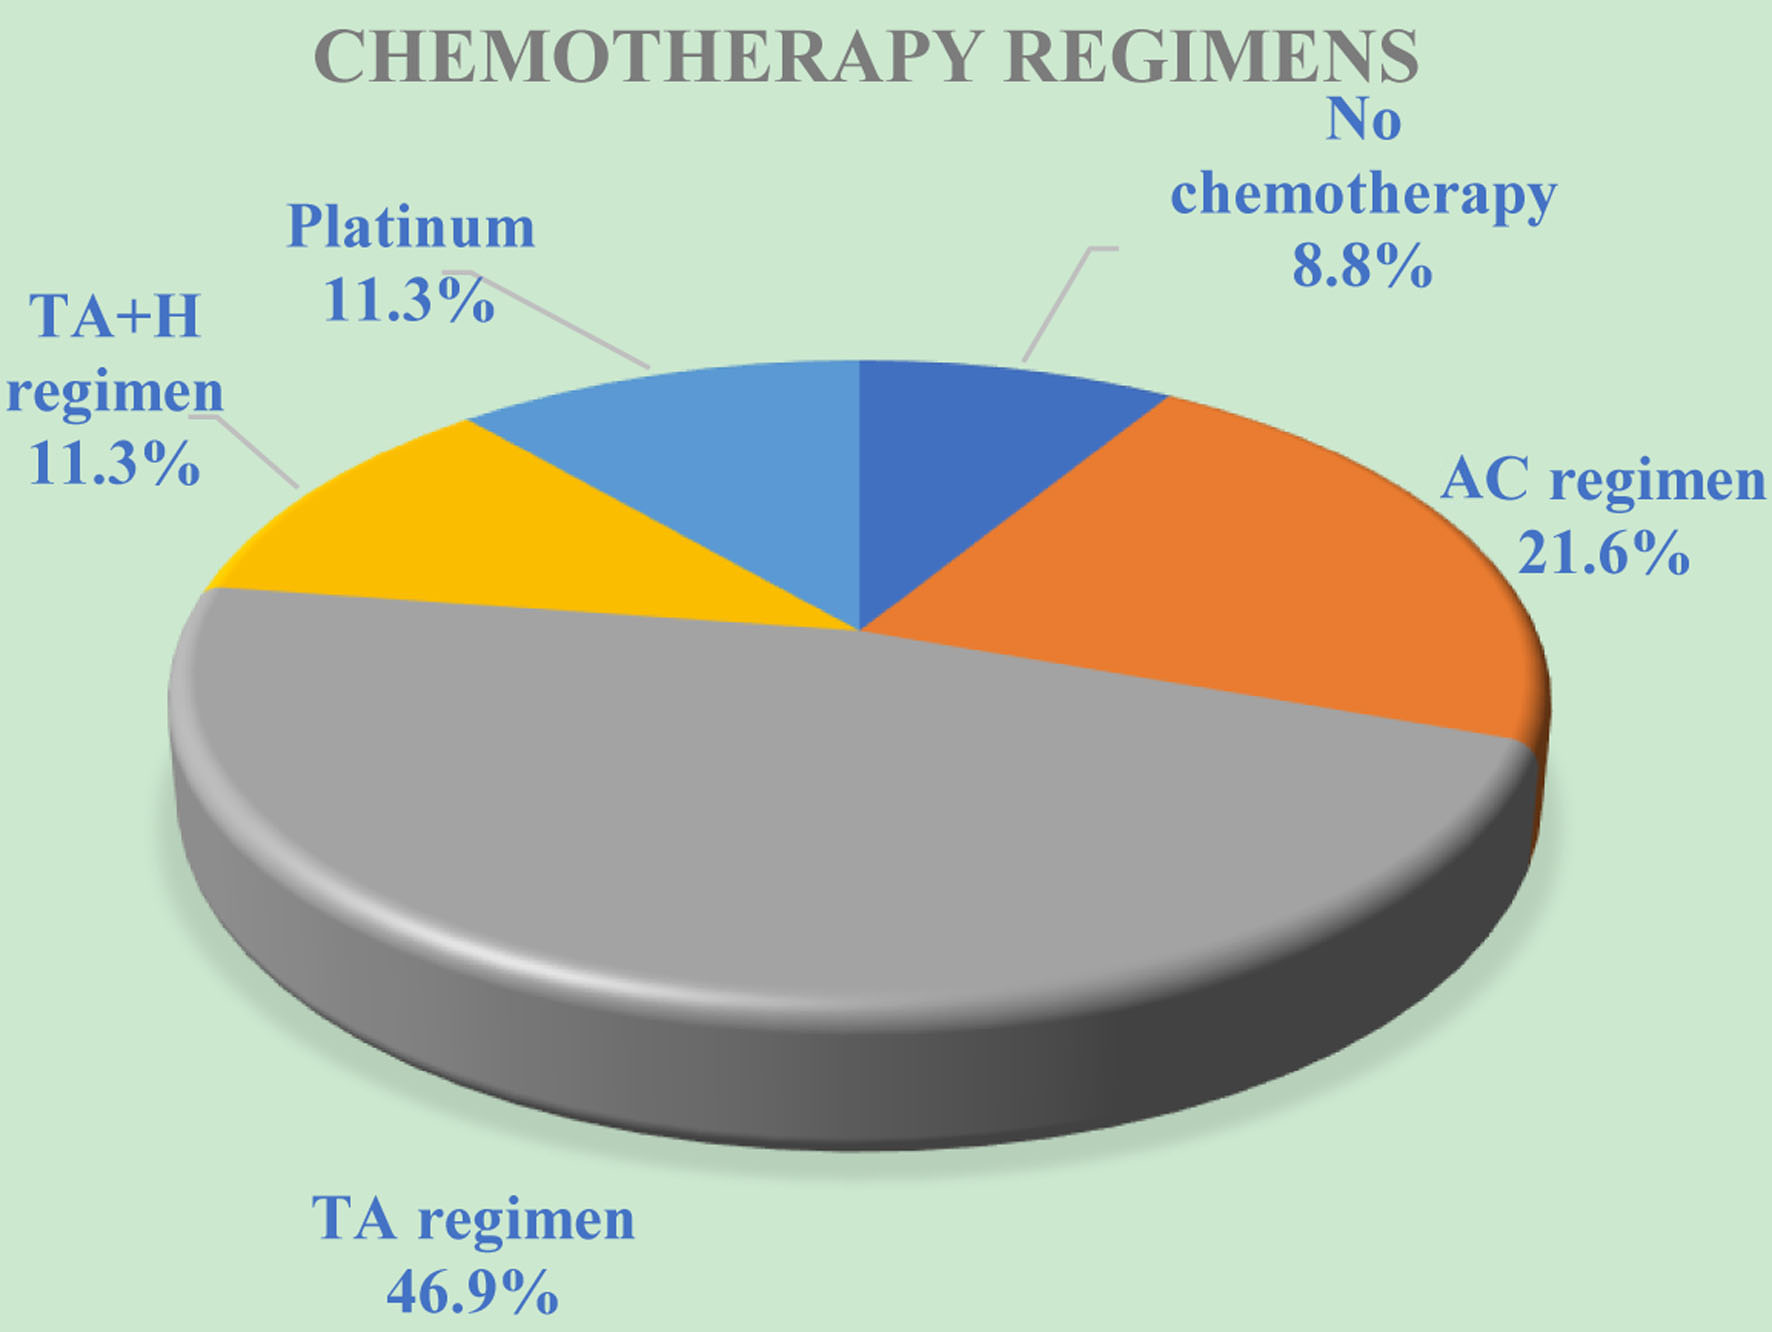
Figure 1. The distribution of breast cancer patients based on chemotherapy regimens. AC: anthracycline cyclophosphamide. TA: paclitaxel, anthracycline. TA + H: paclitaxel, anthracycline and trastuzumab.
| World Journal of Oncology, ISSN 1920-4531 print, 1920-454X online, Open Access |
| Article copyright, the authors; Journal compilation copyright, World J Oncol and Elmer Press Inc |
| Journal website https://www.wjon.org |
Original Article
Volume 14, Number 1, February 2023, pages 60-66
Estradiol Levels and Chemotherapy in Breast Cancer Patients: A Prospective Clinical Study
Figure
Tables
| Characteristics | Total (n = 194) | Chemotherapy | P-value | |
|---|---|---|---|---|
| No (n = 17) | Yes (n = 177) | |||
| aIndependent t-test. bMann-Whitney U. cChi-square/Fisher exact test. *Statistically significant (α = 5%). EBC: early breast cancer; LABC: locally advanced breast cancer; ABC: advanced breast cancer; LVI: lymphovascular invasion; HER2: human epidermal growth factor receptor 2. | ||||
| Agea (years) | 51.63 ± 10.01 | 51.47 ± 13.02 | 51.64 ± 9.72 | 0.946 |
| Menarcheb (years) | 12.77 ± 1.41 | 12.65 ± 1.73 | 12.78 ± 1.38 | 0.793 |
| Cancer stageb | 0.033* | |||
| EBC | 42 (21.6%) | 7 (41.2%) | 35 (19.8%) | |
| LABC | 100 (51.5%) | 8 (47.1%) | 92 (52.0%) | |
| ABC | 52 (26.8%) | 2 (11.8%) | 50 (28.2%) | |
| Cancer gradingb | 0.332 | |||
| I | 13 (6.7%) | 3 (17.6%) | 10 (5.6%) | |
| II | 64 (33.0%) | 5 (29.4%) | 59 (33.3%) | |
| III | 117 (60.3%) | 9 (52.9%) | 108 (61.0%) | |
| LVIc | 0.366 | |||
| Negative | 61 (31.4%) | 7 (41.2%) | 54 (30.5%) | |
| Positive | 133 (68.6%) | 10 (58.8%) | 123 (69.5%) | |
| Subtypec | 0.004* | |||
| Luminal A | 46 (23.7%) | 10 (58.8%) | 36 (20.3%) | |
| Luminal B | 41 (21.1%) | 4 (23.5%) | 37 (20.9%) | |
| HER2 overexpression | 50 (25.8%) | 0 (0.0%) | 50 (28.2%) | |
| Triple-negative | 36 (18.6%) | 2 (11.8%) | 34 (19.2%) | |
| Triple-positive | 21 (10.8%) | 1 (5.9%) | 20 (11.3%) | |
| Ki67c | 0.888 | |||
| Negative | 111 (57.2%) | 10 (58.8%) | 101 (57.1%) | |
| Positive | 83 (42.8%) | 7 (41.2%) | 76 (42.9%) | |
| Menopausal statusc | 0.675 | |||
| Premenopause | 112 (57.7%) | 9 (52.9%) | 103 (58.2%) | |
| Menopause | 82 (42.3%) | 8 (47.1%) | 74 (41.8%) | |
| Marital statusc | 0.570 | |||
| Unmarried | 9 (4.6%) | 1 (5.9%) | 8 (4.5%) | |
| Married | 185 (95.4%) | 16 (94.1%) | 169 (95.5%) | |
| Number of kid(s)b | 0.959 | |||
| None | 19 (9.8%) | 1 (5.9%) | 18 (10.2%) | |
| 1 - 2 | 111 (57.2%) | 11 (64.7%) | 100 (56.5%) | |
| ≥ 2 | 64 (33.0%) | 5 (29.4%) | 59 (33.3%) | |
| Breastfeedingc | 0.128 | |||
| No | 42 (21.6%) | 1 (5.9%) | 41 (23.2%) | |
| Yes | 152 (78.4%) | 16 (94.1%) | 136 (76.8%) | |
| Contraceptionc | 0.312 | |||
| Hormonal | 74 (38.1%) | 9 (52.9%) | 65 (36.7%) | |
| Nonhormonal | 57 (29.4%) | 5 (29.4%) | 52 (29.4%) | |
| None | 63 (32.5%) | 3 (17.6%) | 60 (33.9%) | |
| Family history of cancerc | 0.318 | |||
| Present | 35 (18.0%) | 1 (5.9%) | 34 (19.2%) | |
| Absent | 159 (82.0%) | 16 (94.1%) | 143 (80.8%) | |
| Subtype | Estradiol | N | Mean | SD | Min. | Max. | P value |
|---|---|---|---|---|---|---|---|
| *Uji Wilcoxon: there was a statistically significant difference in estradiol levels between before and after chemotherapy based on subtype (P < 0.05). HER2: human epidermal growth factor receptor 2; SD: standard deviation. | |||||||
| Luminal A | Before therapy | 46 | 78.63 | 65.37 | 0 | 377 | 0.003* |
| After therapy | 46 | 73.36 | 79.61 | 0 | 357 | ||
| Luminal B | Before therapy | 41 | 83.30 | 59.98 | 23 | 267 | 0.008* |
| After therapy | 41 | 68.86 | 47.13 | 16 | 222 | ||
| Triple-negative | Before therapy | 36 | 87.47 | 67.652 | 28 | 350 | 0.002* |
| After therapy | 36 | 72.42 | 58.194 | 27 | 315 | ||
| Triple-positive | Before therapy | 21 | 98.37 | 63.899 | 33 | 260 | 0.001* |
| After therapy | 21 | 60.88 | 41.182 | 1 | 175 | ||
| HER2 overexpression | Before therapy | 50 | 77.69 | 57.59 | 12 | 315 | 0.001* |
| After therapy | 50 | 54.31 | 23.78 | 5 | 112 | ||
| Regimen | Estradiol before (mean ± SD; pg/mL) | Estradiol after (mean ± SD; pg/mL) | P-value | Decrease (%) |
|---|---|---|---|---|
| aWilcoxon rank test for comparison of two population means (paired samples). bKruskal-Wallis for comparison of more than two population means (unpaired samples). *Statistically significant (α = 5%). AC: anthracycline cyclophosphamide; TA: paclitaxel, anthracycline. TA + H: paclitaxel, anthracycline and trastuzumab; SD: standard deviation. | ||||
| No chemotherapy (n = 17) | 106.83 ± 97.59 | 99.44 ± 94.90 | 0.163a | -6.9% |
| AC (n = 42) | 78.25 ± 51.79 | 61.51 ± 42.06 | 0.011a* | -21.4% |
| TA (n = 91) | 81.81 ± 61.65 | 65.25 ± 54.85 | < 0.001a* | -20.2% |
| TA + H (n = 22) | 83.43 ± 56.42 | 56.96 ± 32.29 | 0.006a* | -31.7% |
| Platinum (n = 22) | 79.46 ± 56.22 | 60.64 ± 40.38 | 0.016a* | -23.7% |
| P-value | 0.937b | 0.730b | ||