Figures
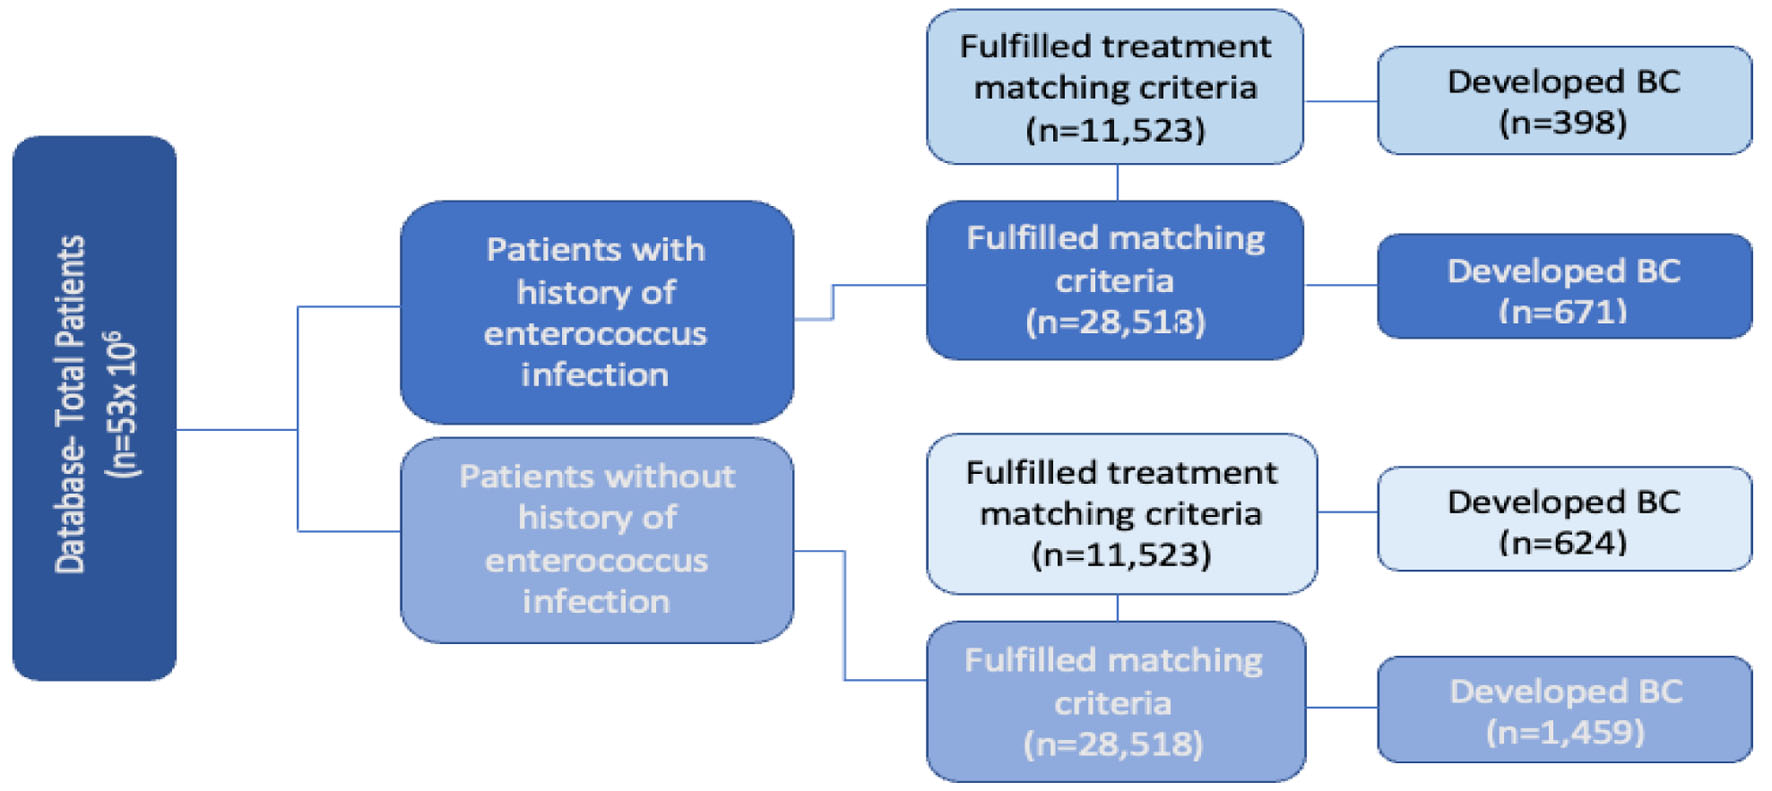
Figure 1. Flowchart of infected vs. noninfected groups with and without antibiotic treatment. Left side: total patients in database (n = 53 × 106). Second column from left: evaluation of incidence of breast cancer in patients with prior enterococcus infection (dark blue) and without infection (light blue). Third column from left: additional stratification and matching were done based on patient comorbidities and age with and without infection (very dark blue and dark blue, n = 28,518), and with antibiotic treatment with and without infection (very light blue and light blue, n = 11,523).
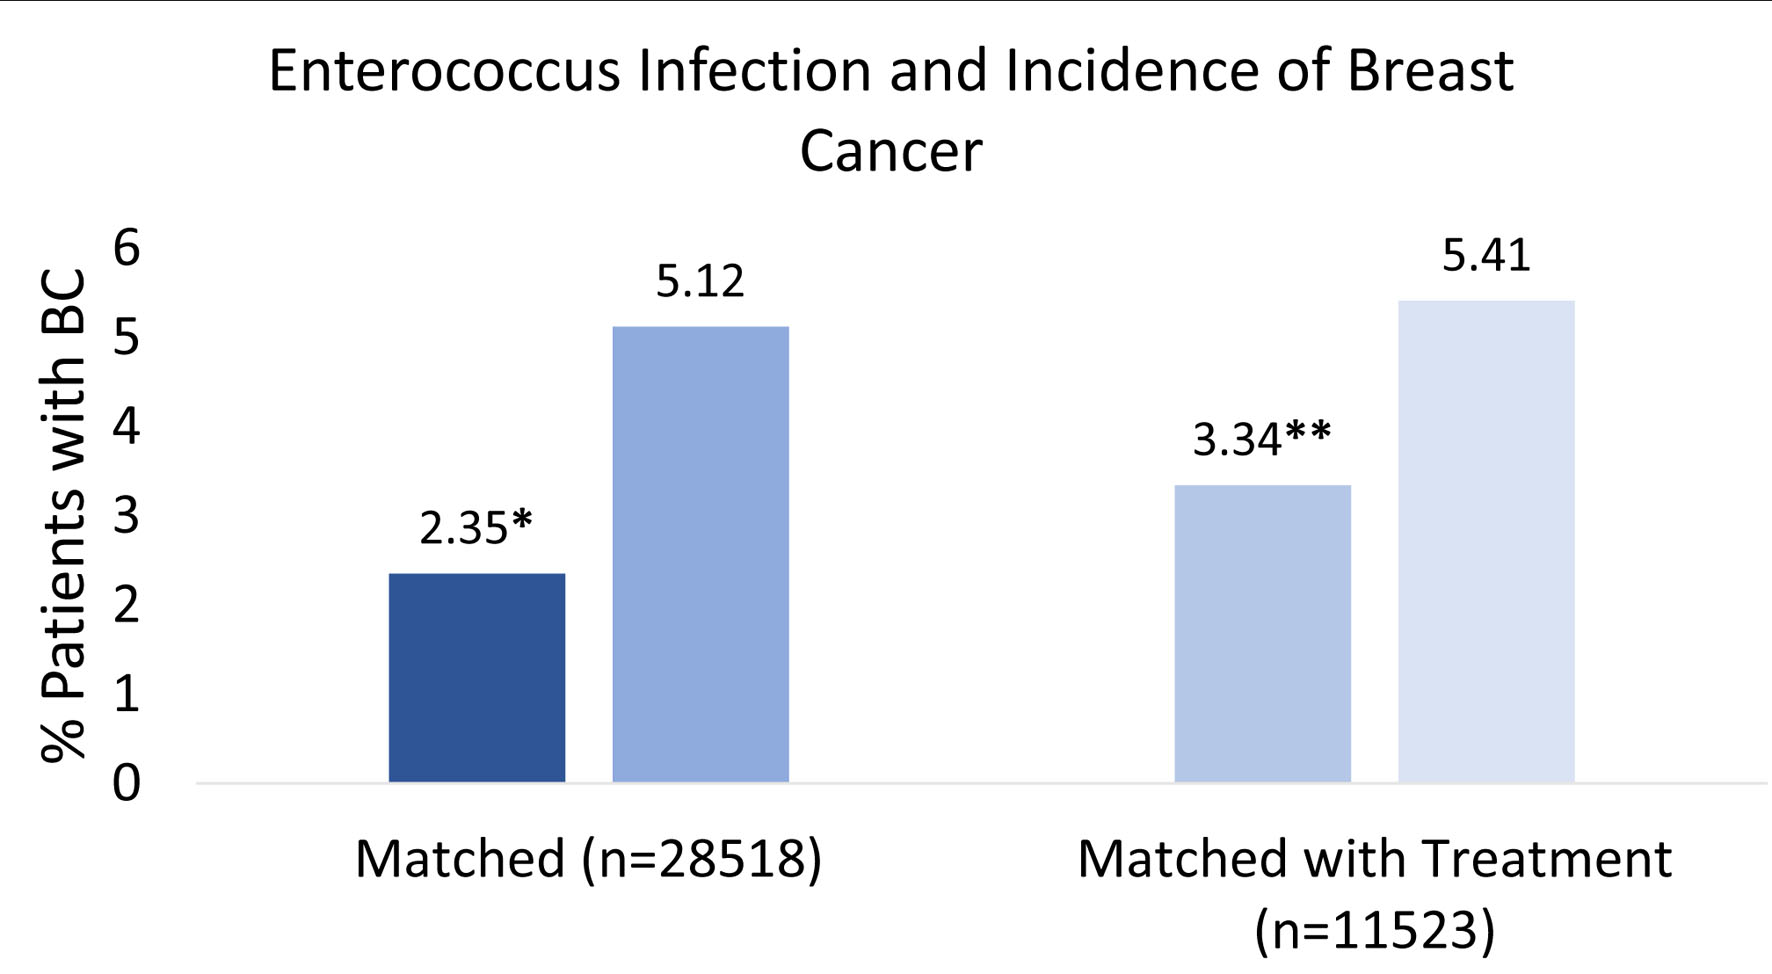
Figure 2. Percent breast cancer incidence after enterococcus infection. This figure illustrates the percentage of patients who developed breast cancer with or without a prior enterococcus infection. Left side: patients with enterococcus infection (very dark blue) and no infection (dark blue) were compared based on similar comorbidities and age before incidence of breast cancer (n = 28,518). Score *P < 2.2 × 10⁻¹⁶. Right side: patients with enterococcus infection with antibiotic treatment (light blue) and no infection with antibiotic treatment (very light blue) were controlled and similarly compared based on comorbidities and age before incidence of breast cancer (n = 11,523). Score **P < 2.2 × 10⁻¹⁶.
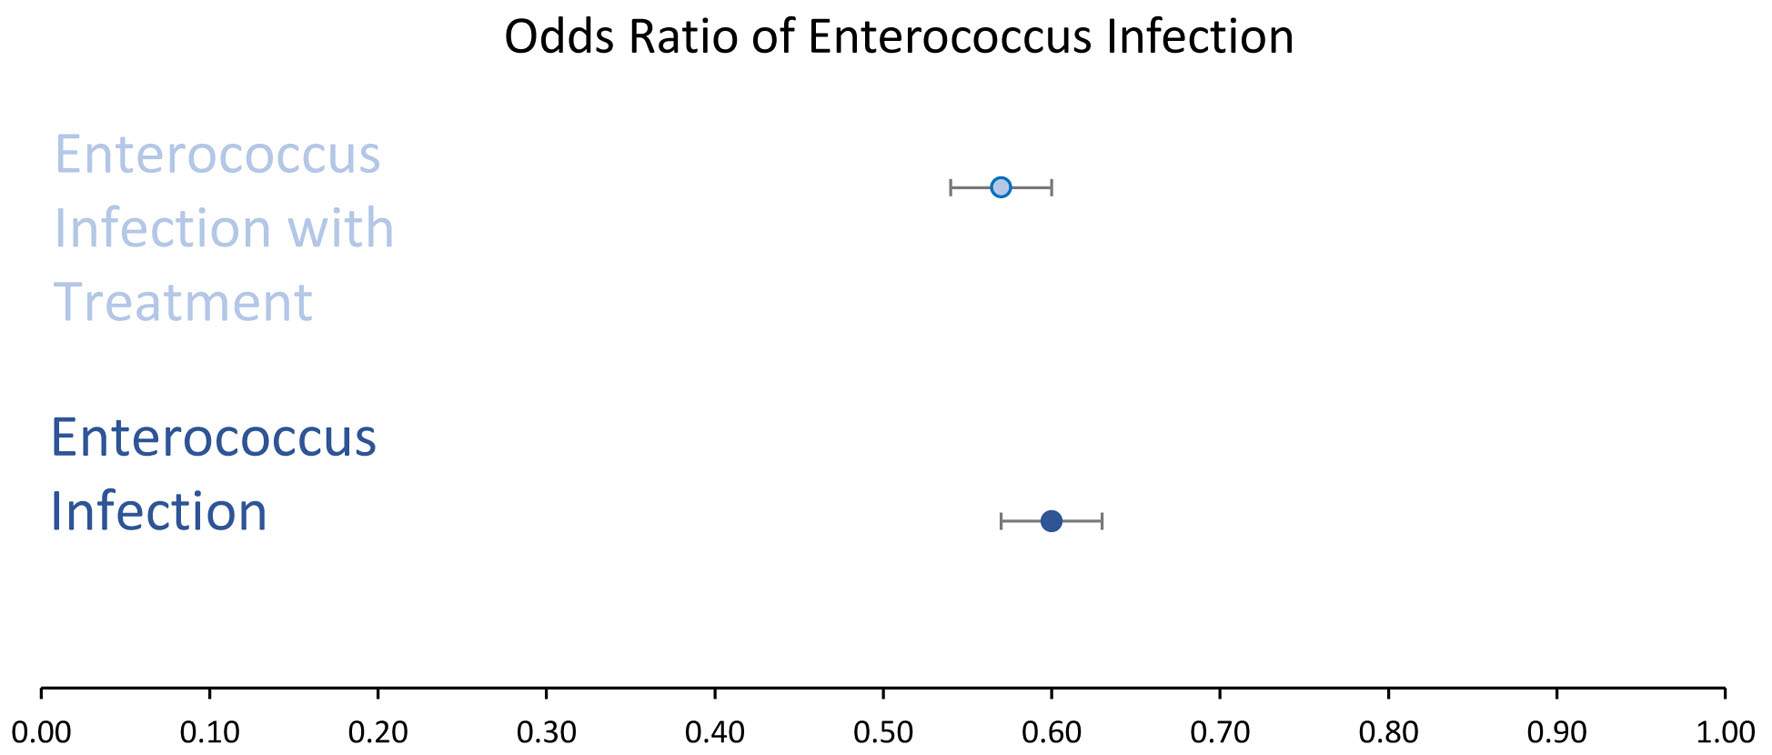
Figure 3. Odds ratio ((OR) with 95% confidence intervals (CIs). OR in enterococcus infected (dark blue) and enterococcus infected with antibiotic treatment (light blue) showed a decreased likelihood of developing breast cancer. OR in infected group (light blue) was 0.60 with a 95% CI of 0.57 - 0.63. OR in infected group with antibiotic treatment (dark blue) was 0.57 with a 95% CI of 0.54 - 0.60.
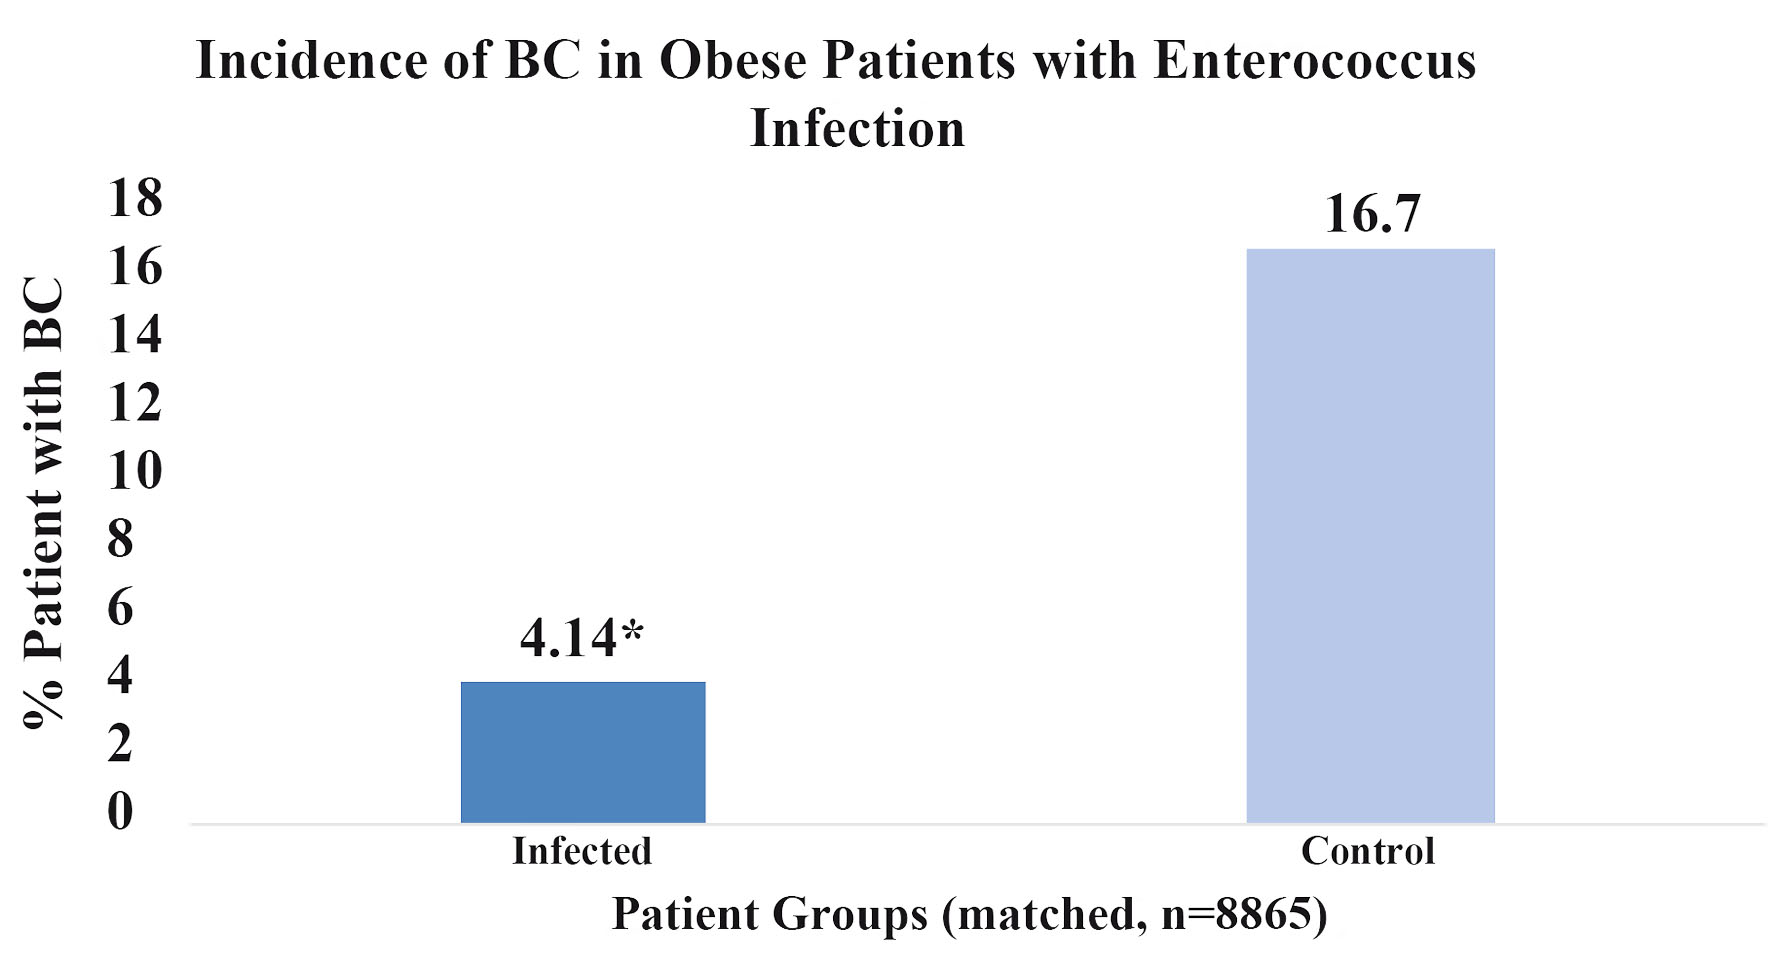
Figure 4. Percent breast cancer incidence in obese patients with enterococcus infection. This figure illustrates the percentage of obese patients (n = 8,865) who developed breast cancer with a prior history enterococcal infection (dark blue) and obese patients without infection (light blue). Score *P < 2.2 × 10⁻¹⁶.
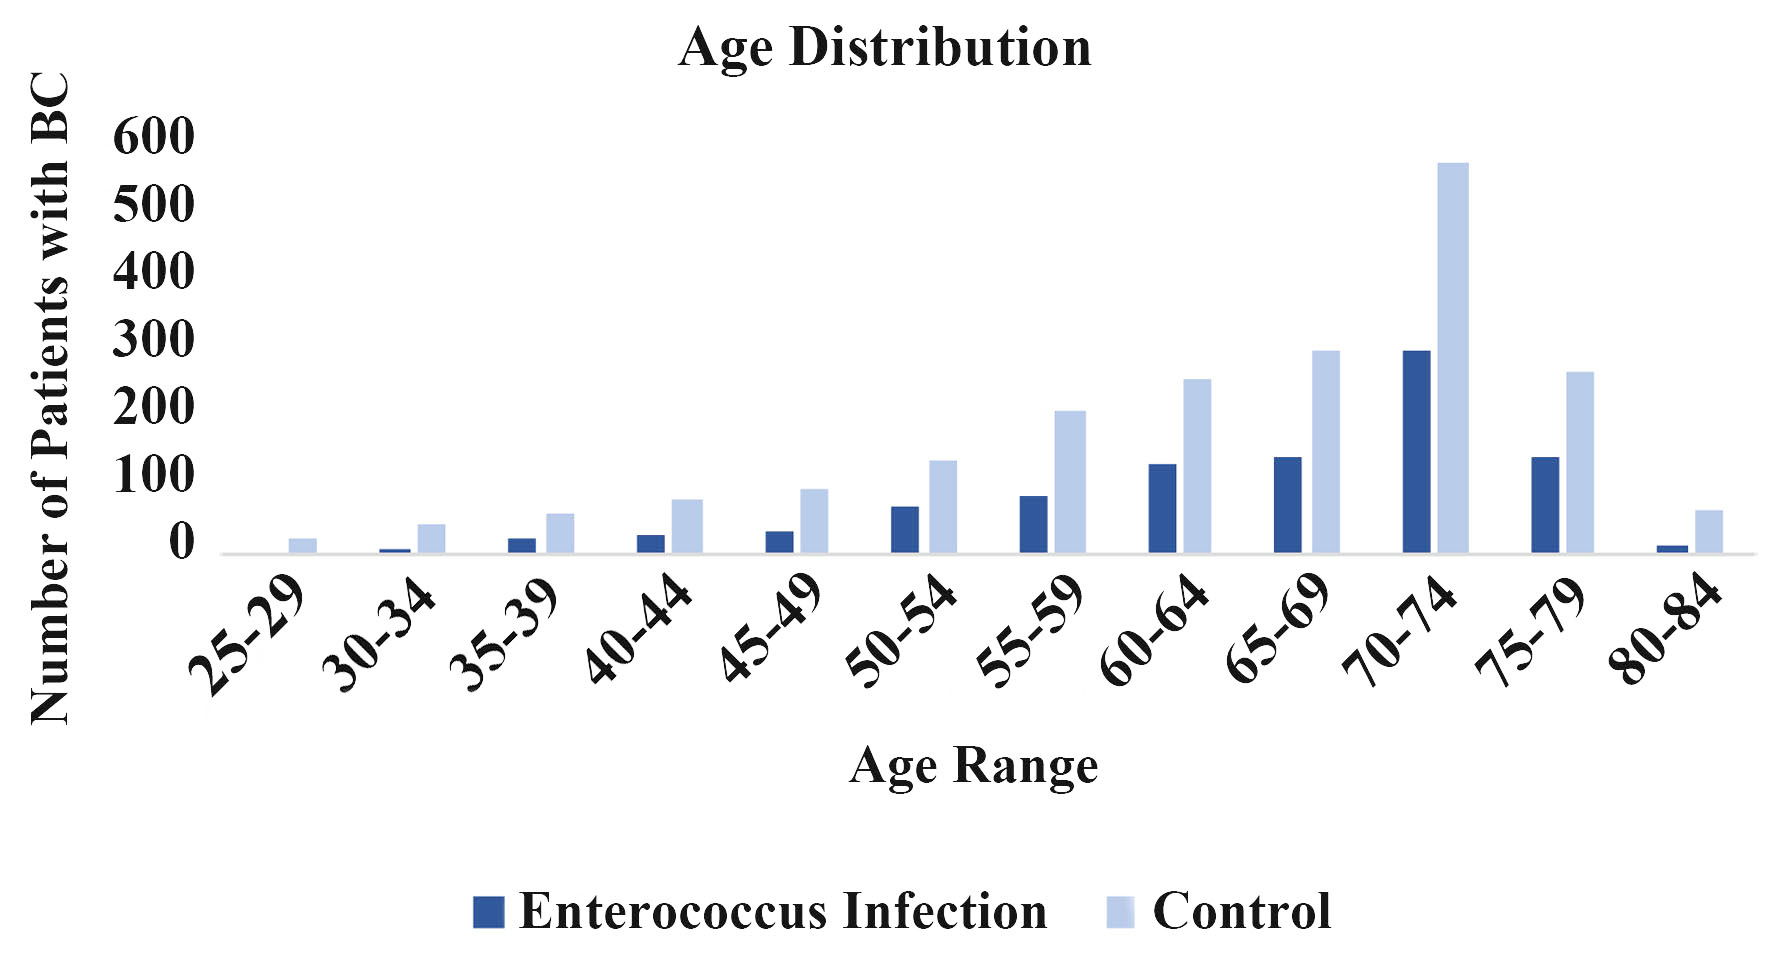
Figure 5. Age distribution. Incidence of breast cancer is sorted by age in enterococcus infected (dark blue) and noninfected (light blue) groups.
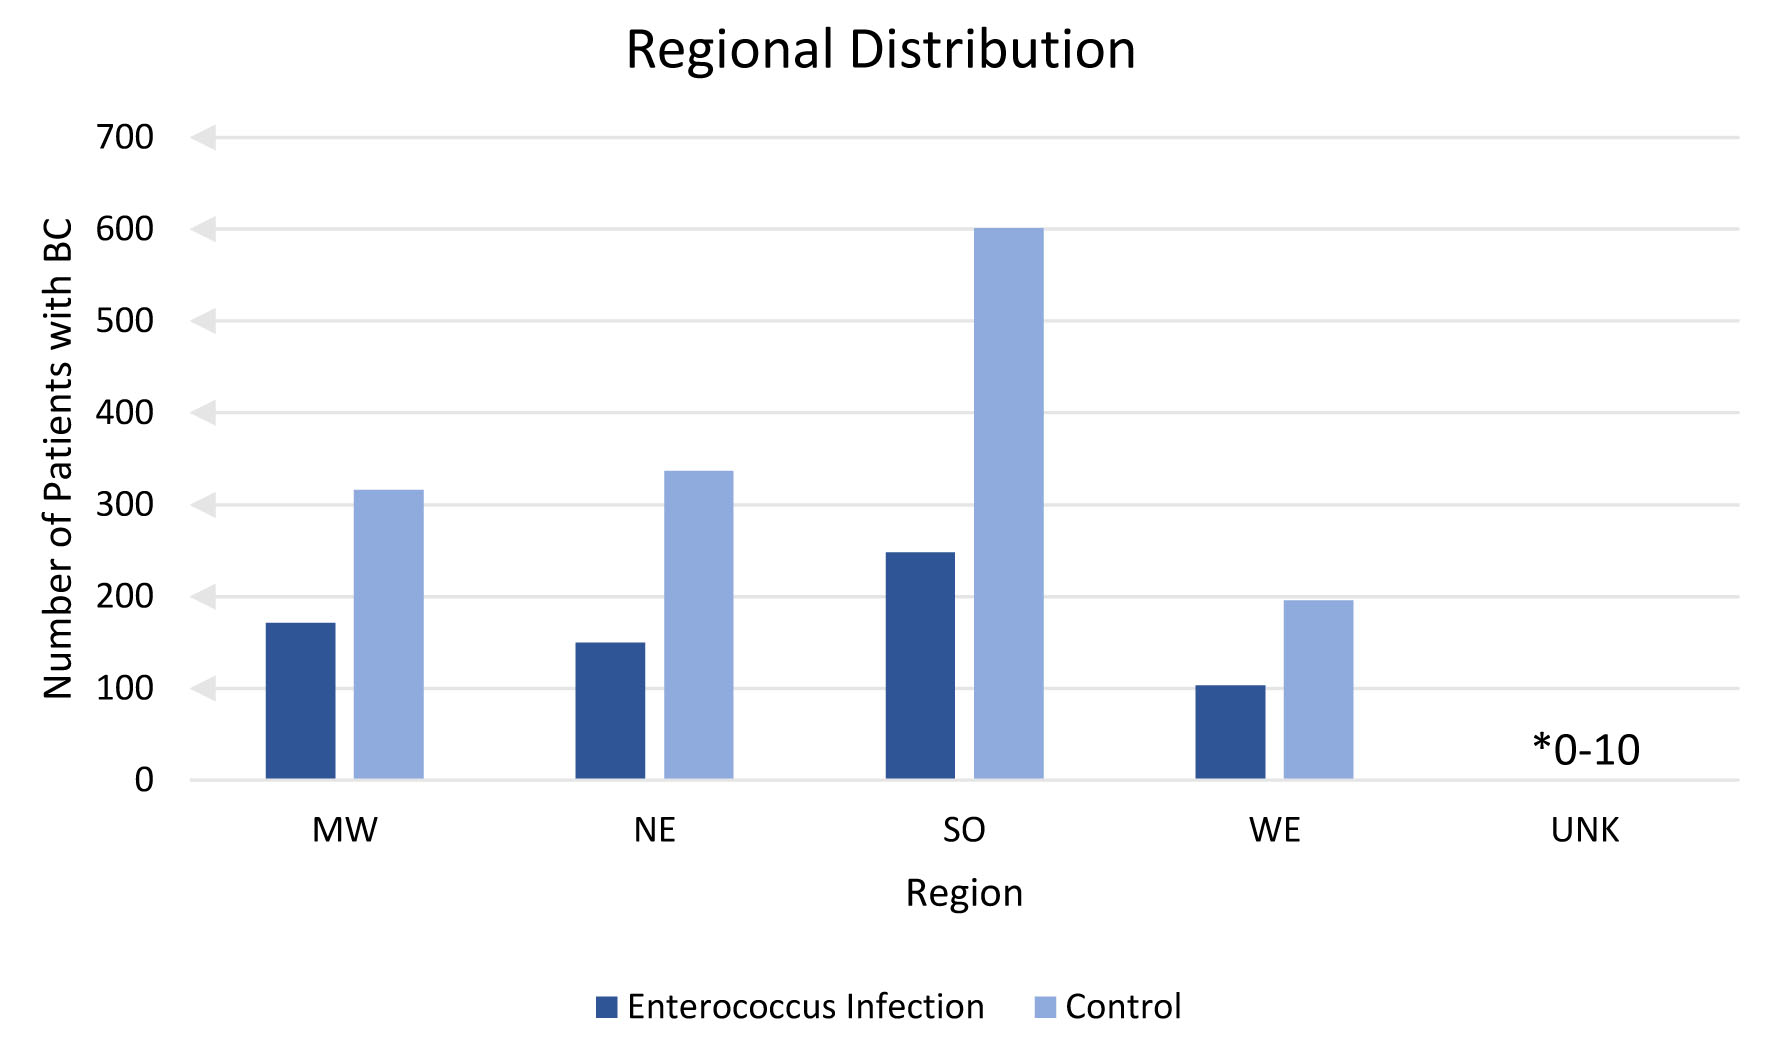
Figure 6. Regional distribution. This figure shows number of patients with breast cancer sorted by United States region with prior enterococcus (dark blue) and without prior enterococcus infection (light blue). Unknown (unk) is a label provided by the database for patient records with unidentified or no known region of residence.