Figures
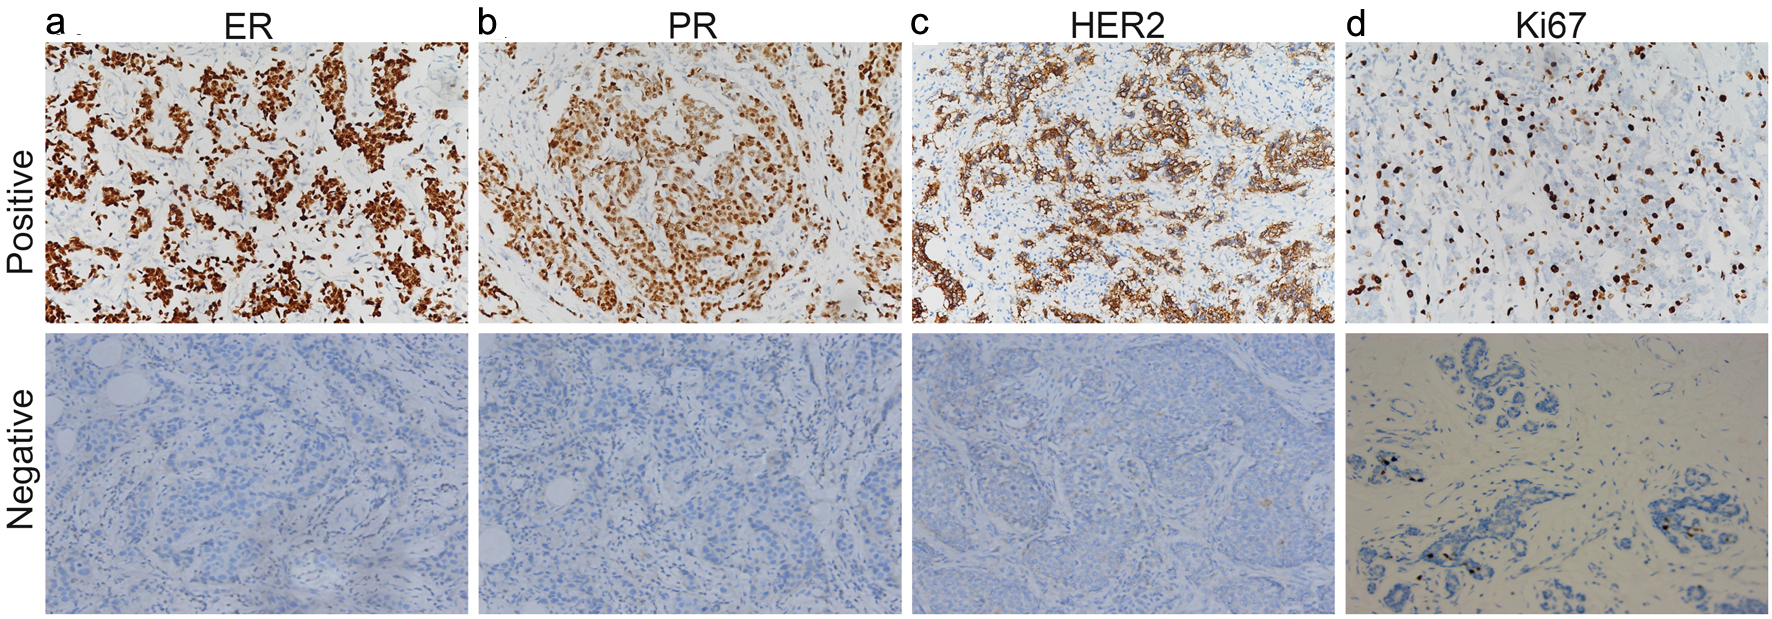
Figure 1. ER (a), PR (b), HER2 (c) and Ki67 (d) were found positive expression and negative expression in breast cancer tissues. ER: estrogen receptor; PR: progesterone receptor; HER2: human epidermal growth factor receptor 2.
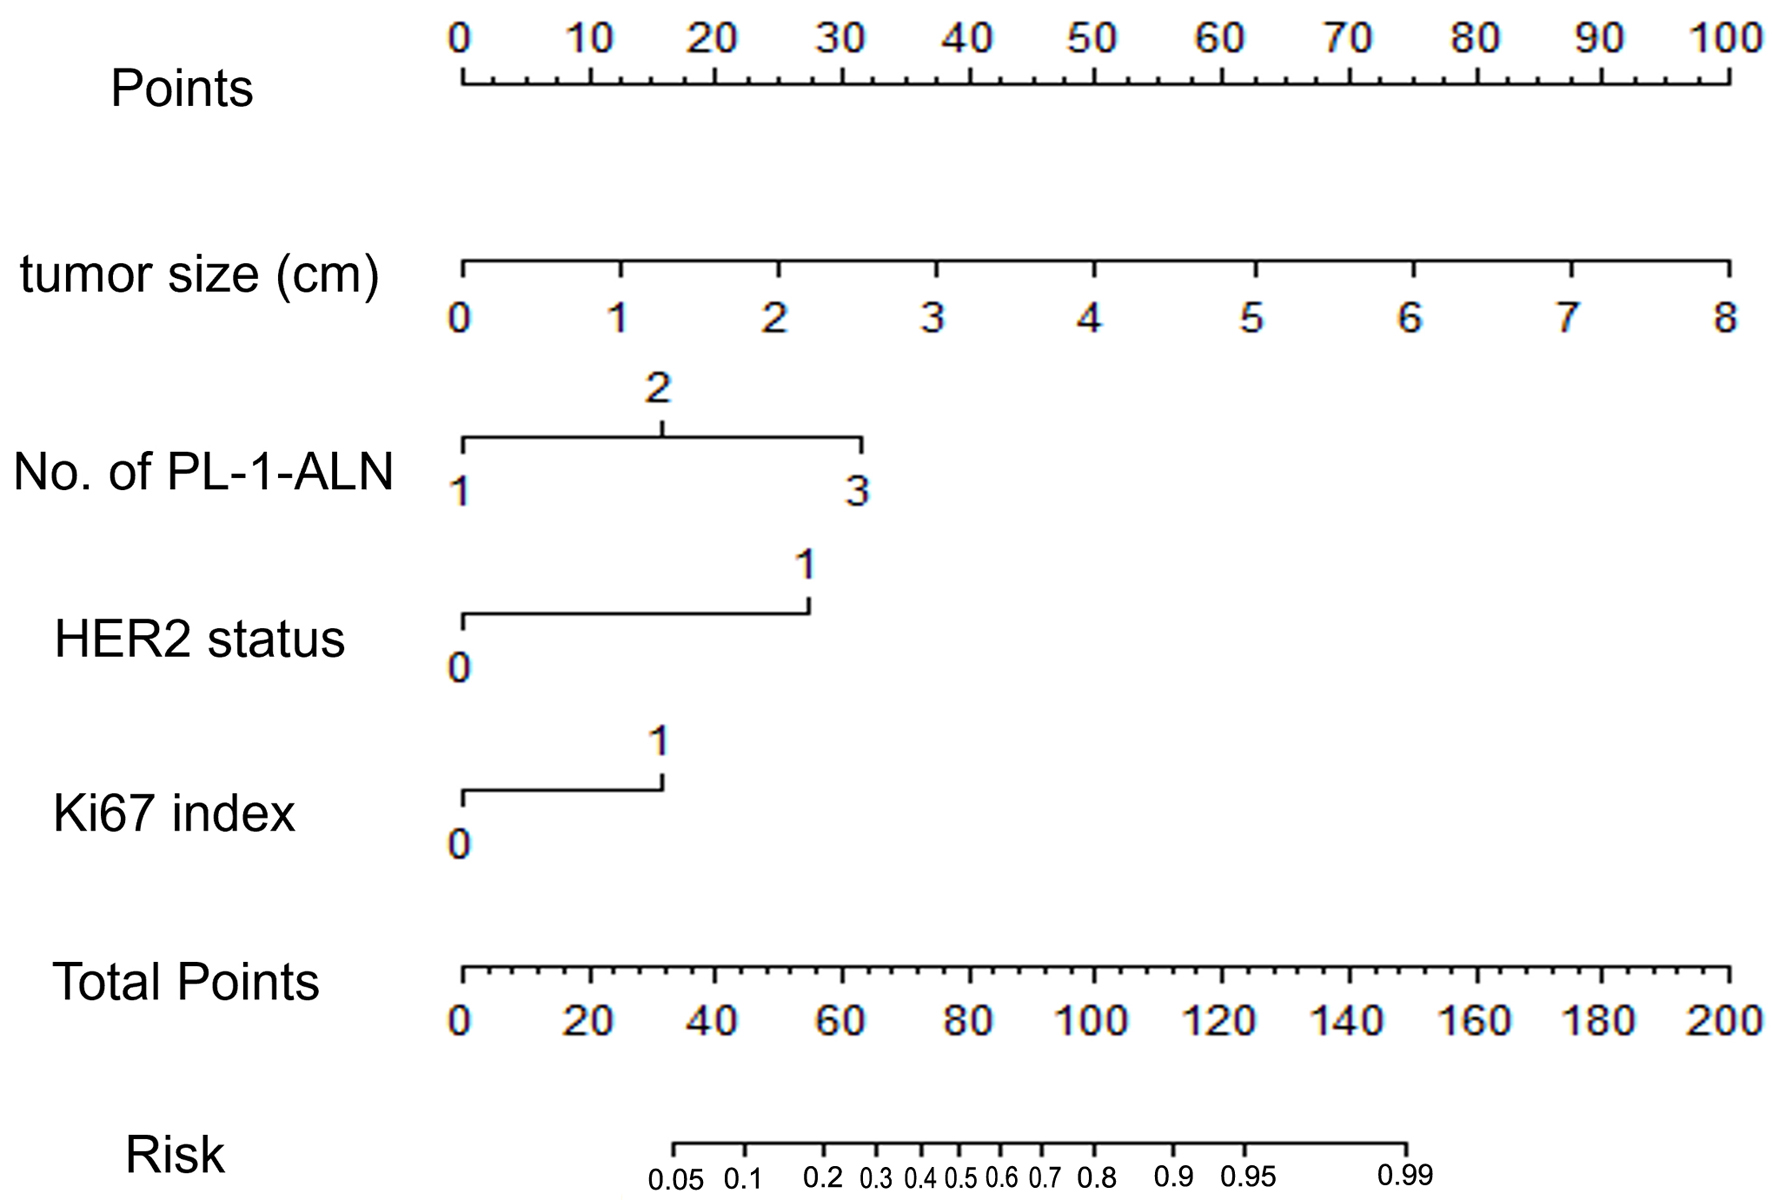
Figure 2. A nomogram for predicting the metastasis of breast cancer in a luminal B type invasive ductal carcinoma population. The nomogram is composed by seven rows. The first one is the point assignment for every variable. For a patient, every variable is assigned a value depending on the variables by painting a vertical line between the exact variable value and points line. As a consequence, the total points can be gained by pulsing all of the points for the four variables. Finally, the predictive probability of the luminal B type breast cancer metastasis can be gained by painting a vertical line between total points and risk (the final row). About the risk, from left to right, it refers to 0.05, 0.1, 0.2, 0.3, 0.4, 0.5, 0.6, 0.7, 0.8, 0.9, 0.95, and 0.99.
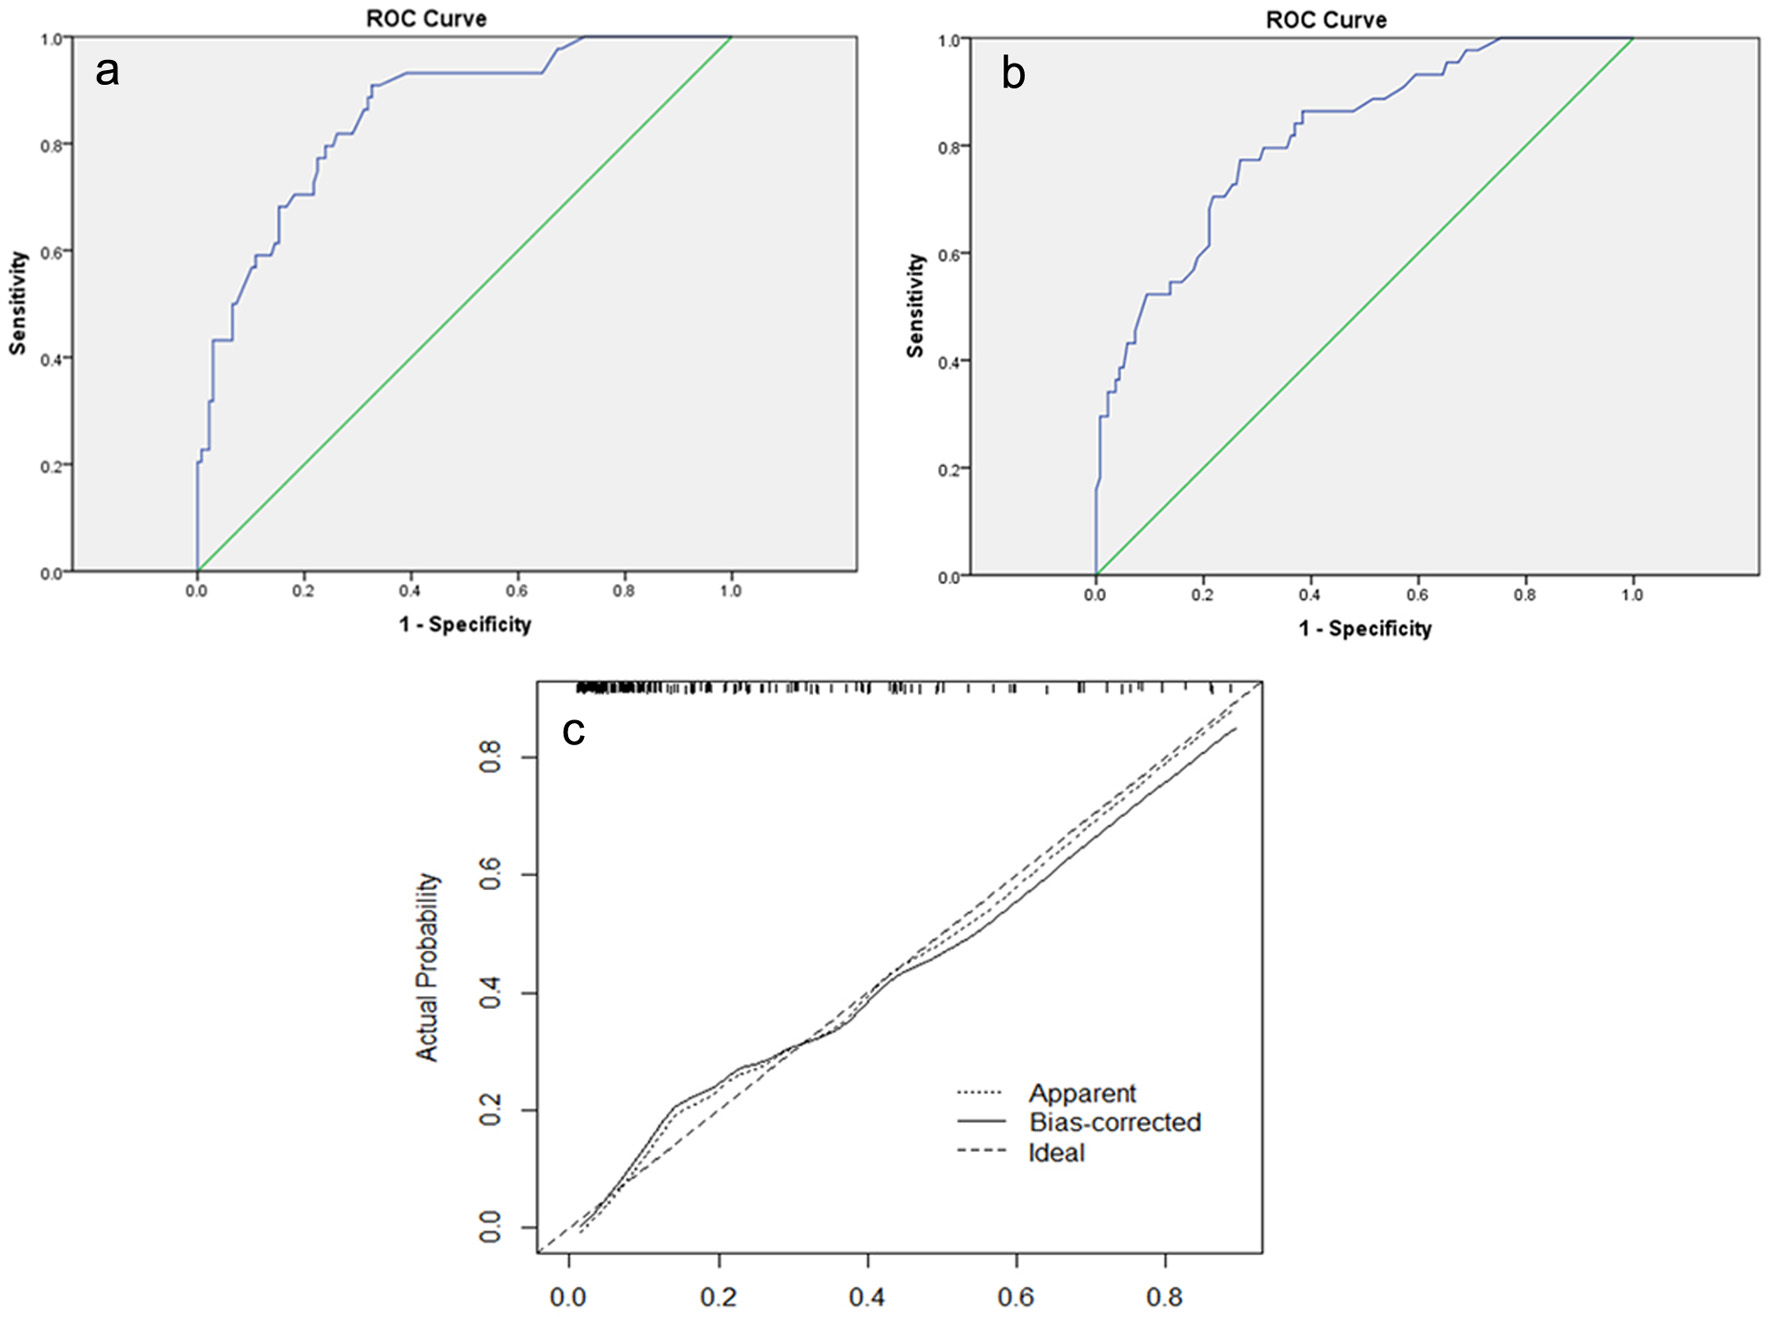
Figure 3. (a) The ROC curve of the modeling group. The AUC is 0.855 (95% CI: 0.793 - 0.917). (b) The ROC curve of the validation group. The AUC is 0.818 (95% CI: 0.747 - 0.888). (c) Calibration plot of the nomogram for predicting the probability of breast cancer metastasis. ROC: receiver-operating characteristic; AUC: area under the ROC curve; CI: confidence interval.
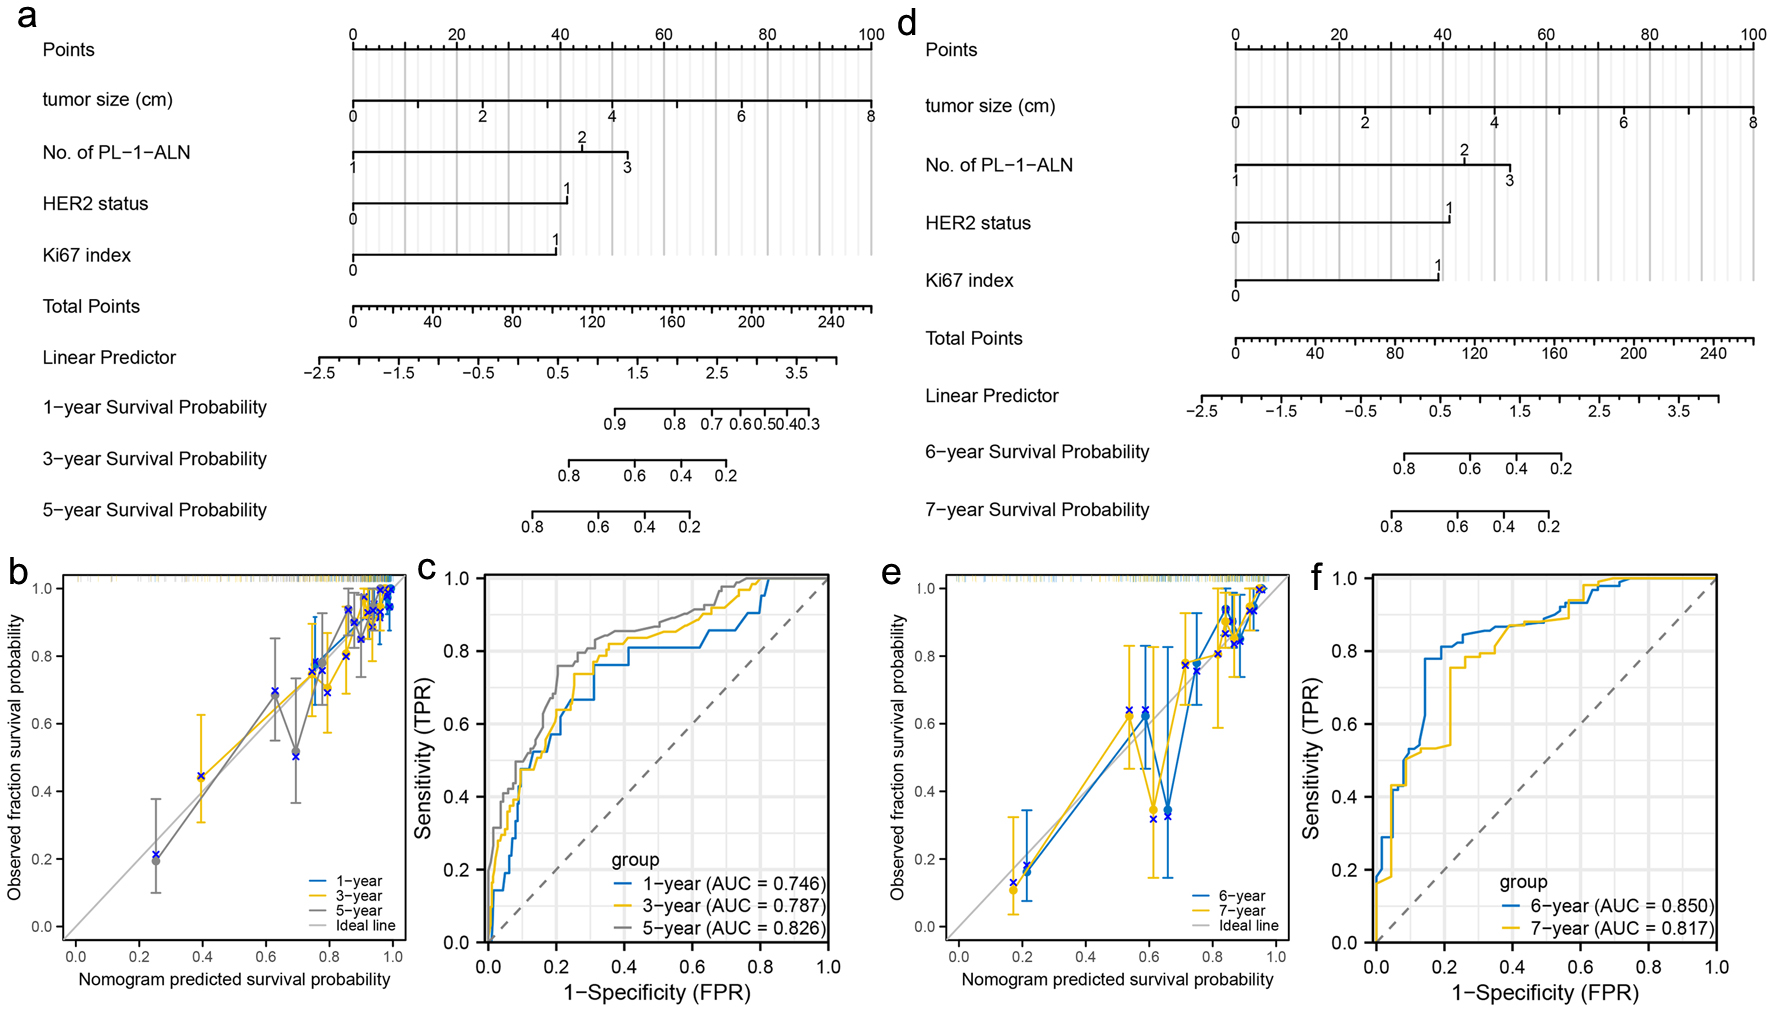
Figure 4. Construction and validation of nomograms which can predict the probability of breast cancer metastasis at specific stage. (a) Prognostic nomogram for the 1-, 3-, and 5-year metastasis probability of patients with luminal B type breast cancer. (b) Calibration curves of the nomogram for predicting 1-, 3-, and 5-year metastasis probability of patients with luminal B type breast cancer. (c) ROC curves and AUC values of the nomogram for predicting 1-, 3-, and 5-year metastasis probability of patients with luminal B type breast cancer. (d) Prognostic nomogram for the 6- and 7-year metastasis probability of patients with luminal B type breast cancer. (e) Calibration curves of the nomogram for predicting 6- and 7-year metastasis probability of patients with luminal B type breast cancer. (f) ROC curves and AUC values of the nomogram for predicting 6- and 7-year metastasis probability of patients with luminal B type breast cancer. ROC: receiver-operating characteristic; AUC: area under the ROC curve.
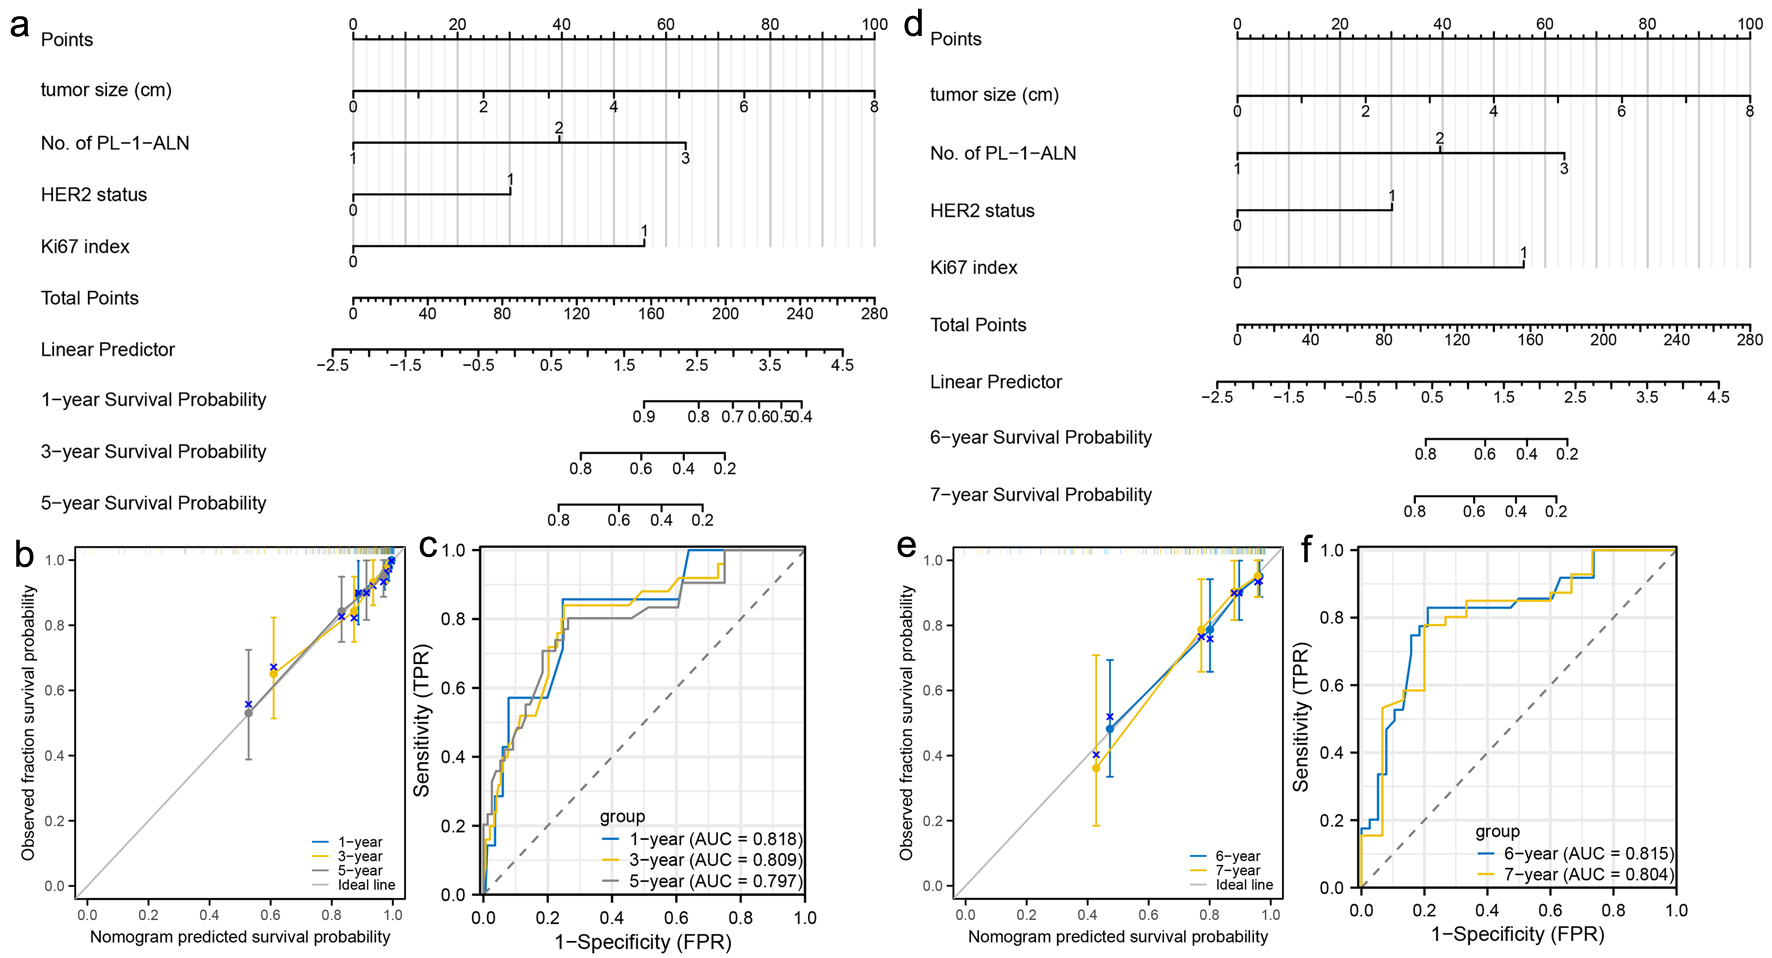
Figure 5. Construction and validation of nomograms which can predict the probability of breast cancer metastasis in pre-menopausal patients. (a) Prognostic nomogram for the 1-, 3-, and 5-year metastasis probability of pre-menopausal patients. (b) Calibration curves of the nomogram for predicting 1-, 3-, and 5-year metastasis probability of pre-menopausal patients. (c) ROC curves and AUC values of the nomogram for predicting 1-, 3-, and 5-year metastasis probability of pre-menopausal patients. (d) Prognostic nomogram for the 6- and 7-year metastasis probability of pre-menopausal patients. (e) Calibration curves of the nomogram for predicting 6- and 7-year metastasis probability of pre-menopausal patients. (f) ROC curves and AUC values of the nomogram for predicting 6- and 7-year metastasis probability of pre-menopausal patients. ROC: receiver-operating characteristic; AUC: area under the ROC curve.
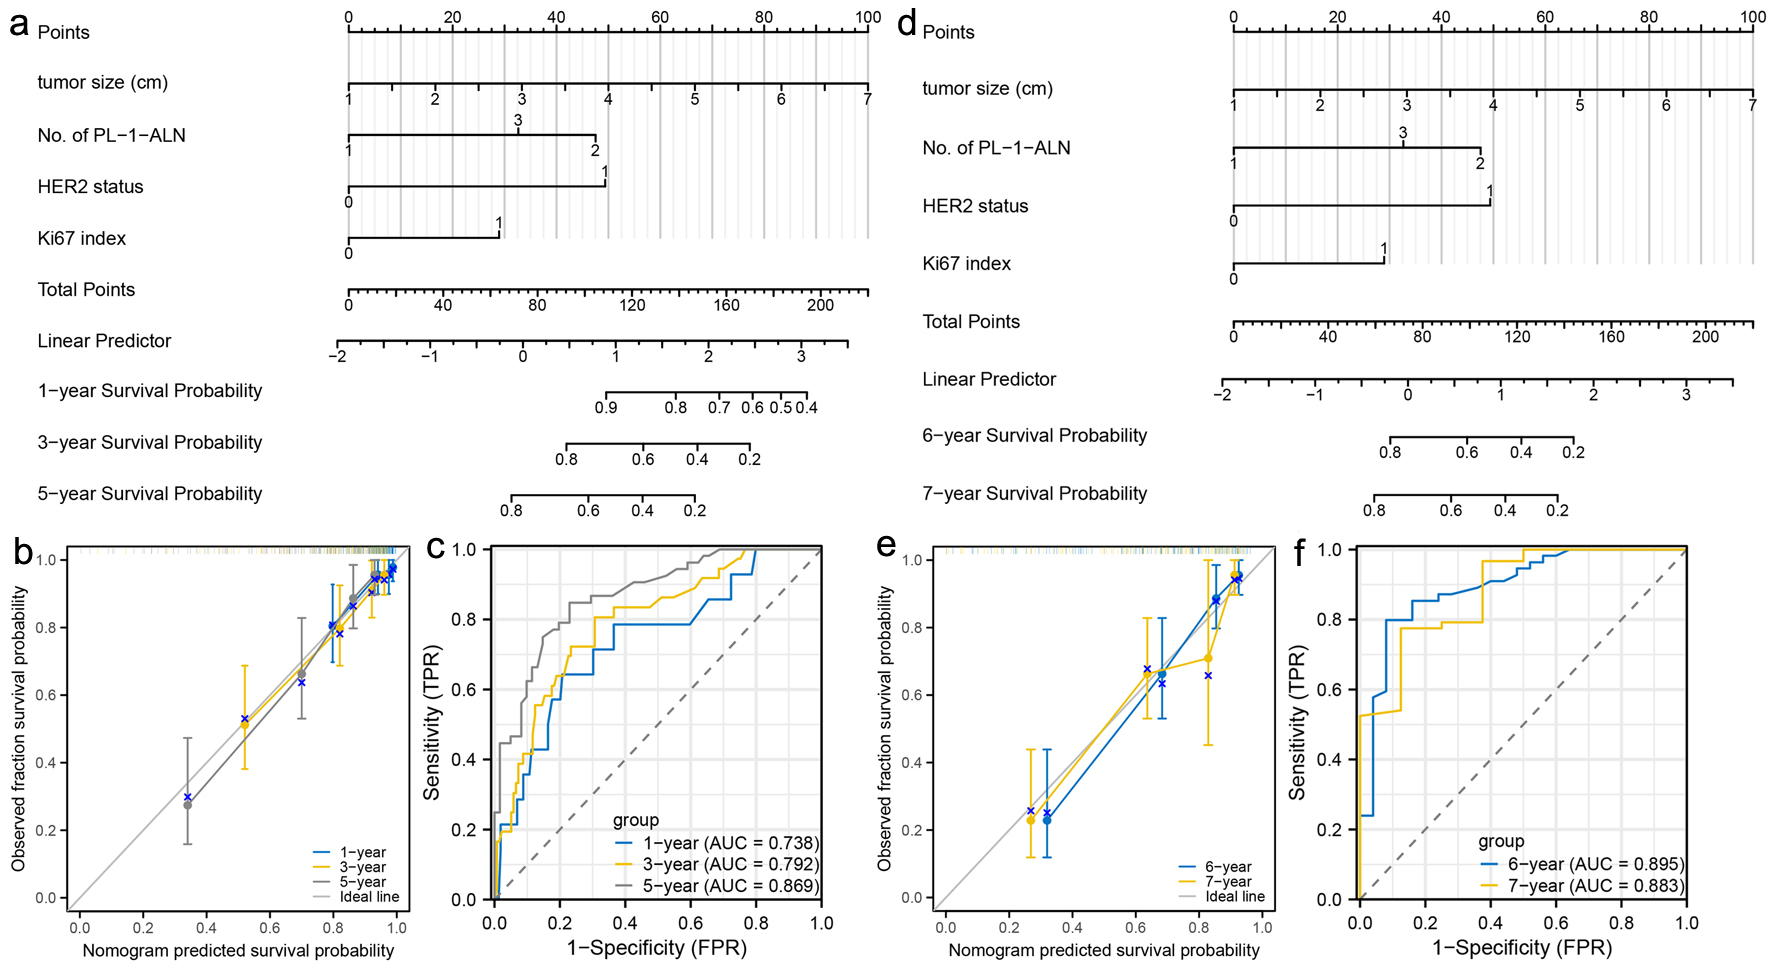
Figure 6. Construction and validation of nomograms which can predict the probability of breast cancer metastasis in post-menopausal patients. (a) Prognostic nomogram for the 1-, 3-, and 5-year metastasis probability of post-menopausal patients. (b) Calibration curves of the nomogram for predicting 1-, 3-, and 5-year metastasis probability of post-menopausal patients. (c) ROC curves and AUC values of the nomogram for predicting 1-, 3-, and 5-year metastasis probability of post-menopausal patients. (d) Prognostic nomogram for the 6- and 7-year metastasis probability of post-menopausal patients. (e) Calibration curves of the nomogram for predicting 6- and 7-year metastasis probability of post-menopausal patients. (f) ROC curves and AUC values of the nomogram for predicting 6- and 7-year metastasis probability of post-menopausal patients. ROC: receiver-operating characteristic; AUC: area under the ROC curve.
Tables
Table 1. Comparison of Clinicopathological Characteristics of Modeling and Validation Groups for the Breast Cancer Metastasis Nomogram
| Variables | Modeling group, N (%) | Validation group, N (%) | P-value |
|---|
| PL-1-ALN: positive level 1 axillary lymph node; L-2-ALNM: level 2 axillary lymph node metastasis; PR: progesterone receptor; HER2: human epidermal growth factor receptor 2. |
| No. of patients | 182 (100) | 182 (100) | |
| Age (years) | | | 0.286 |
| ≤ 45 | 53 (29.1) | 44 (24.2) | |
| > 45 | 129 (70.9) | 138 (75.8) | |
| Menopausal status | | | 0.834 |
| Pre-menopausal | 89 (48.9) | 91 (50.0) | |
| Post-menopausal | 93 (51.1) | 91 (50.0) | |
| Tumor size (cm) | | | 0.568 |
| Median (range) | 2.5 (0.8 - 8.0) | 2.4 (0.2 - 6.0) | |
| No. of PL-1-ALN | | | 0.990 |
| 1 - 2 | 123 (67.6) | 121 (66.5) | |
| 3 - 4 | 44 (24.2) | 52 (28.6) | |
| ≥ 5 | 15 (8.2) | 9 (4.9) | |
| L-2-ALNM | | | 0.792 |
| Yes | 37 (20.3) | 35 (19.2) | |
| No | 145 (79.7) | 147 (80.8) | |
| Histological grade | | | 0.774 |
| I | 9 (4.9) | 11 (6.1) | |
| II | 155 (85.2) | 150 (82.4) | |
| III | 18 (9.9) | 21 (11.5) | |
| PR status | | | 0.086 |
| Positive | 159 (87.4) | 147 (80.8) | |
| Negative | 23 (12.6) | 35 (19.2) | |
| HER2 status | | | 0.300 |
| Positive | 49 (26.9) | 58 (31.9) | |
| Negative | 133 (73.1) | 124 (68.1) | |
| Ki67 index | | | 0.276 |
| ≤ 20% | 71 (39.0) | 61 (33.5) | |
| > 20% | 111 (61.0) | 121 (66.5) | |
Table 2. Univariate Logistic Regression Analysis of Different Variables Predicting Breast Cancer Metastasis in the Modeling Group
| Variables | Metastasis, N (%) | No metastasis, N (%) | P-value |
|---|
| PL-1-ALN: positive level 1 axillary lymph node; L-2-ALNM: level 2 axillary lymph node metastasis; PR: progesterone receptor; HER2: human epidermal growth factor receptor 2. |
| No. of patients | 44 (100) | 138 (100) | |
| Age (years) | | | 0.757 |
| ≤ 45 | 12 (27.3) | 41 (29.7) | |
| > 45 | 32 (72.7) | 97 (70.3) | |
| Menopausal status | | | 0.118 |
| Pre-menopausal | 17 (38.6) | 72 (52.2) | |
| Post-menopausal | 27 (61.4) | 66 (47.8) | |
| Tumor size (cm) | | | < 0.001 |
| Median (range) | 3.08 (1.2 - 8.0) | 2.28 (0.8 - 5.0) | |
| No. of PL-1-ALN | | | < 0.001 |
| 1 - 2 | 19 (43.2) | 104 (75.4) | |
| 3 - 4 | 15 (34.1) | 29 (21.0) | |
| ≥ 5 | 10 (22.7) | 5 (3.6) | |
| L-2-ALNM | | | 0.189 |
| Yes | 32 (72.7) | 113 (81.9) | |
| No | 12 (27.3) | 25 (18.1) | |
| Histological grade | | | 0.614 |
| I | 1 (2.3) | 8 (5.8) | |
| II | 38 (86.4) | 117 (84.8) | |
| III | 5 (11.3) | 13 (9.4) | |
| PR status | | | 0.453 |
| Positive | 37 (84.1) | 122 (88.4) | |
| Negative | 7 (15.9) | 16 (11.6) | |
| HER2 status | | | < 0.001 |
| Positive | 26 (59.1) | 23 (16.7) | |
| Negative | 18 (40.9) | 115 (83.3) | |
| Ki67 index | | | < 0.001 |
| ≤ 20% | 6 (13.6) | 65 (47.1) | |
| > 20% | 38 (86.4) | 73 (52.9) | |
Table 3. Results of Multivariate Logistic Regression Testing the Association of Each Variable With the Breast Cancer Metastasis
| Variables | Coefficient | SE | Wald value | P-value | OR | 95% CI |
|---|
| Lower | Upper |
|---|
| PL-1-ALN: positive level 1 axillary lymph node; HER2: human epidermal growth factor receptor 2; SE: standard error; OR: odds ratio; CI: confidence interval. |
| No. of PL-1-ALN | 1.101 | 0.338 | 10.611 | 0.001 | 3.006 | 1.550 | 5.829 |
| Tumor size | 0.793 | 0.248 | 10.205 | 0.001 | 2.210 | 1.359 | 3.595 |
| HER2 status | 1.823 | 0.451 | 16.347 | < 0.001 | 6.190 | 2.558 | 14.978 |
| Ki67 index | 1.279 | 0.534 | 5.741 | 0.017 | 3.594 | 1.262 | 10.232 |
| Constant | -6.383 | 1.065 | 35.916 | < 0.001 | 0.002 | | |
Table 4. Predictive Values of the Breast Cancer Metastasis Nomogram at the Optimal Cutoff Value in the Modeling Group and the Validation Group
| Variable | Modeling group | Validation group |
|---|
| ROC: receiver-operating characteristic. |
| Area under ROC curve | 0.855 | 0.818 |
| Cutoff score | 60 | 60 |
| Sensitivity (%) | 81.8 | 77.3 |
| Specificity (%) | 73.9 | 73.2 |
| Positive predictive value (%) | 49.3 | 47.9 |
| Negative predictive value (%) | 92.7 | 91.0 |
| Positive likelihood ratio | 3.1 | 2.9 |
| Negative likelihood ratio | 0.25 | 0.31 |