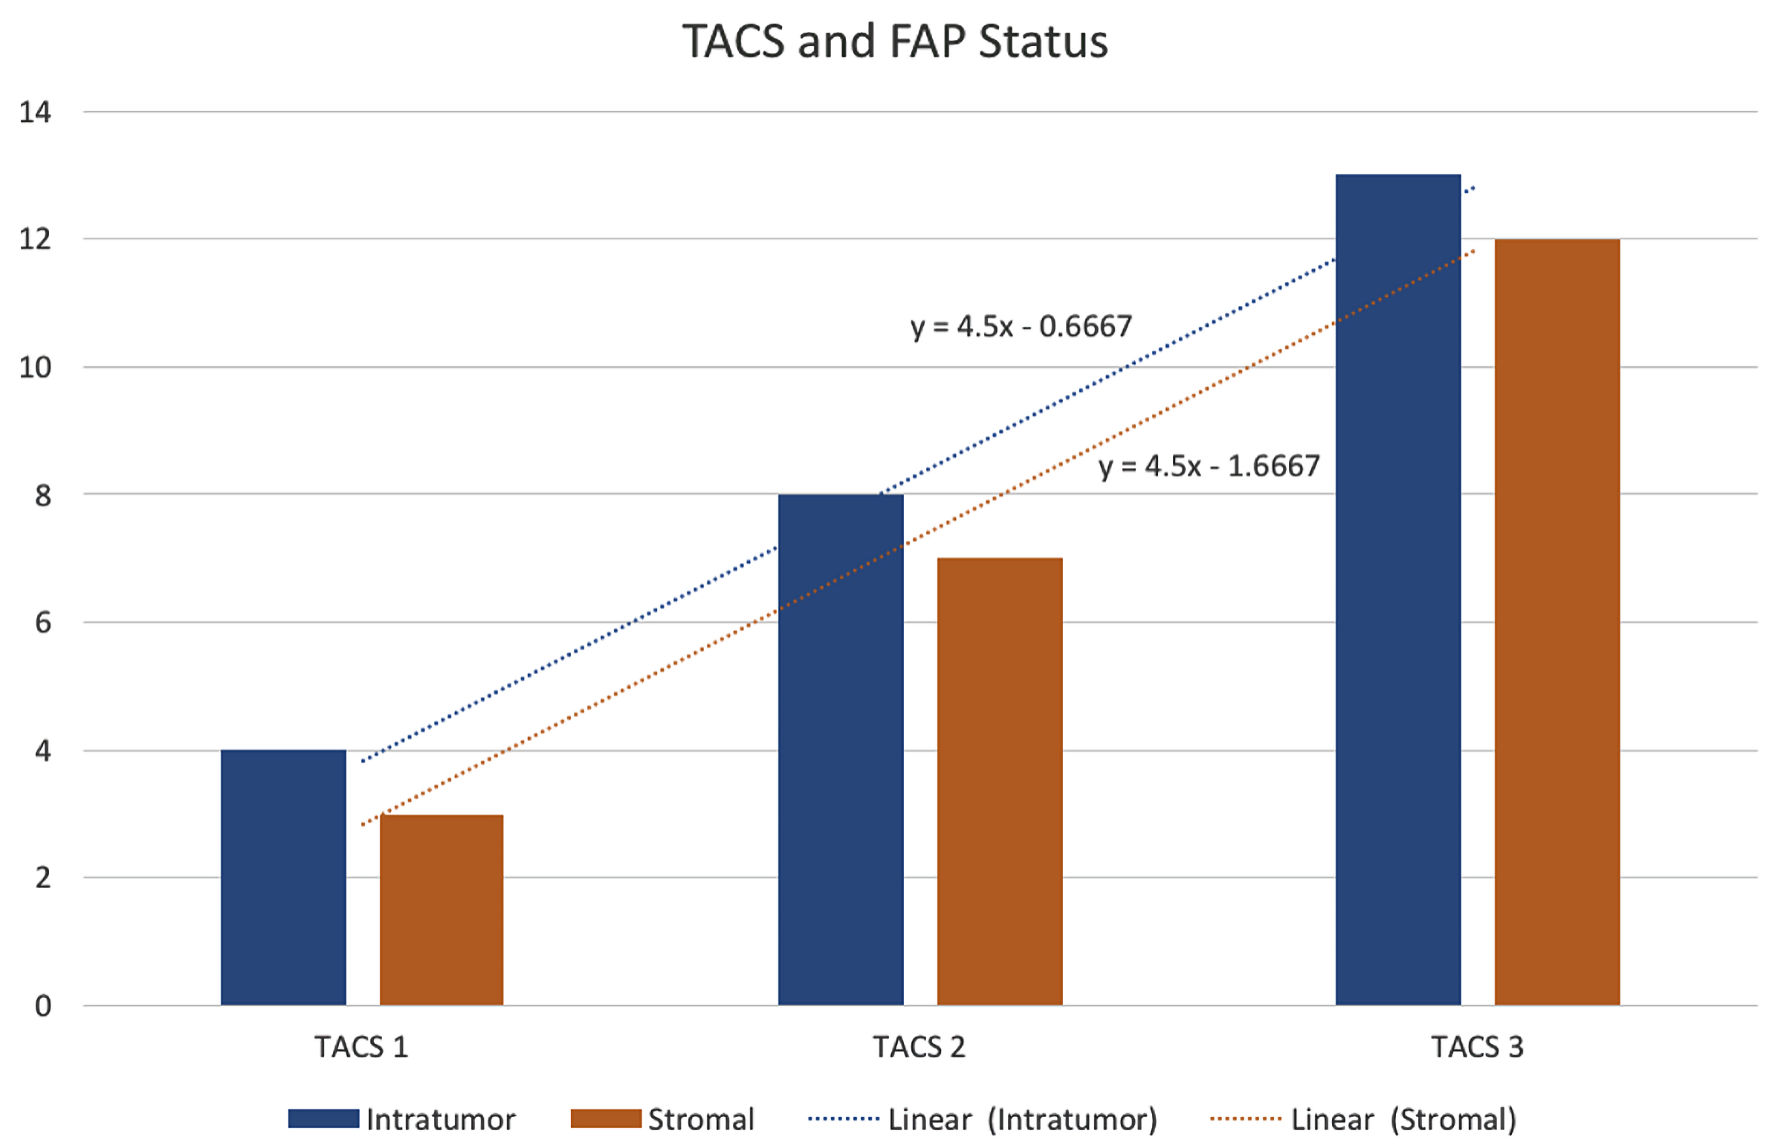
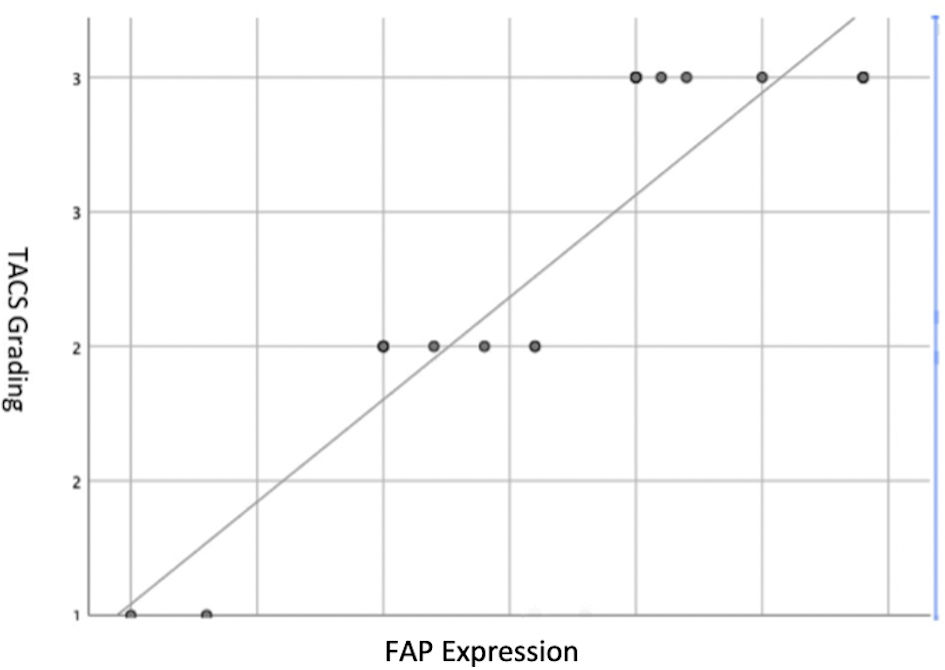
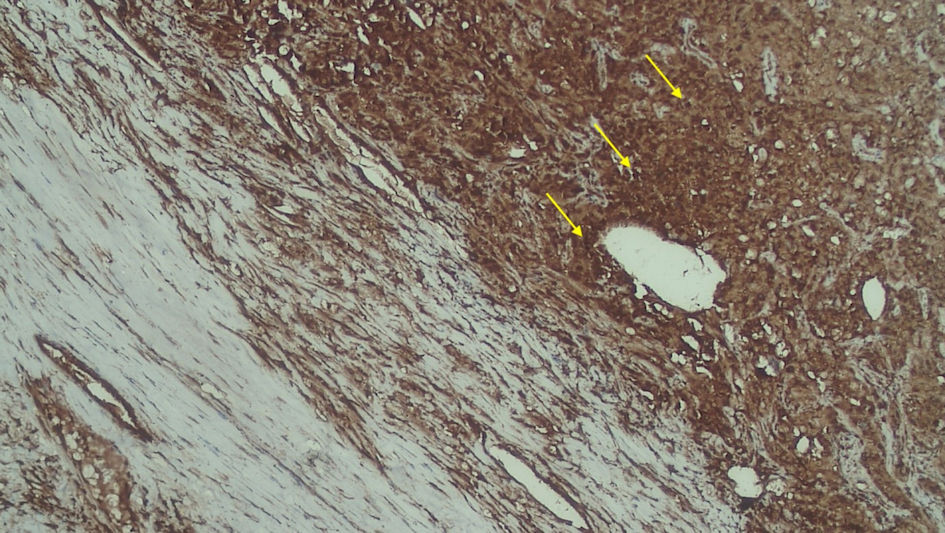
Figure 1. FAP status assessed according to TACS grading. TACS: tumor-associated collagen signature; FAP: fibroblast activation protein.
| World Journal of Oncology, ISSN 1920-4531 print, 1920-454X online, Open Access |
| Article copyright, the authors; Journal compilation copyright, World J Oncol and Elmer Press Inc |
| Journal website https://www.wjon.org |
Original Article
Volume 14, Number 2, April 2023, pages 145-149
Correlation Between Tumor-Associated Collagen Signature and Fibroblast Activation Protein Expression With Prognosis of Clear Cell Renal Cell Carcinoma Patient
Figures
Table
| TACS-1 | TACS-2 | TACS-3 | |
|---|---|---|---|
| TACS: tumor-associated collagen signature; SD: standard deviation. | |||
| Age (mean ± SD) | 53 ± 8.4 | 52 ± 15.1 | 45 ± 17.8 |
| Gender (male), n (%) | 4 (50%) | 6 (75%) | 10 (71%) |
| Grade | |||
| I | 0 | 3 | 2 |
| II | 5 | 5 | 4 |
| III | 2 | 5 | 9 |
| IV | 0 | 2 | 10 |