World Journal of Oncology, ISSN 1920-4531 print, 1920-454X online, Open Access
Article copyright, the authors; Journal compilation copyright, World J Oncol and Elmer Press Inc
Journal website https://www.wjon.org

Original Article

Volume 14, Number 3, June 2023, pages 178-187


Fluctuations in Gut Microbiome Composition During Immune Checkpoint Inhibitor Therapy

Figures

Figure 1.
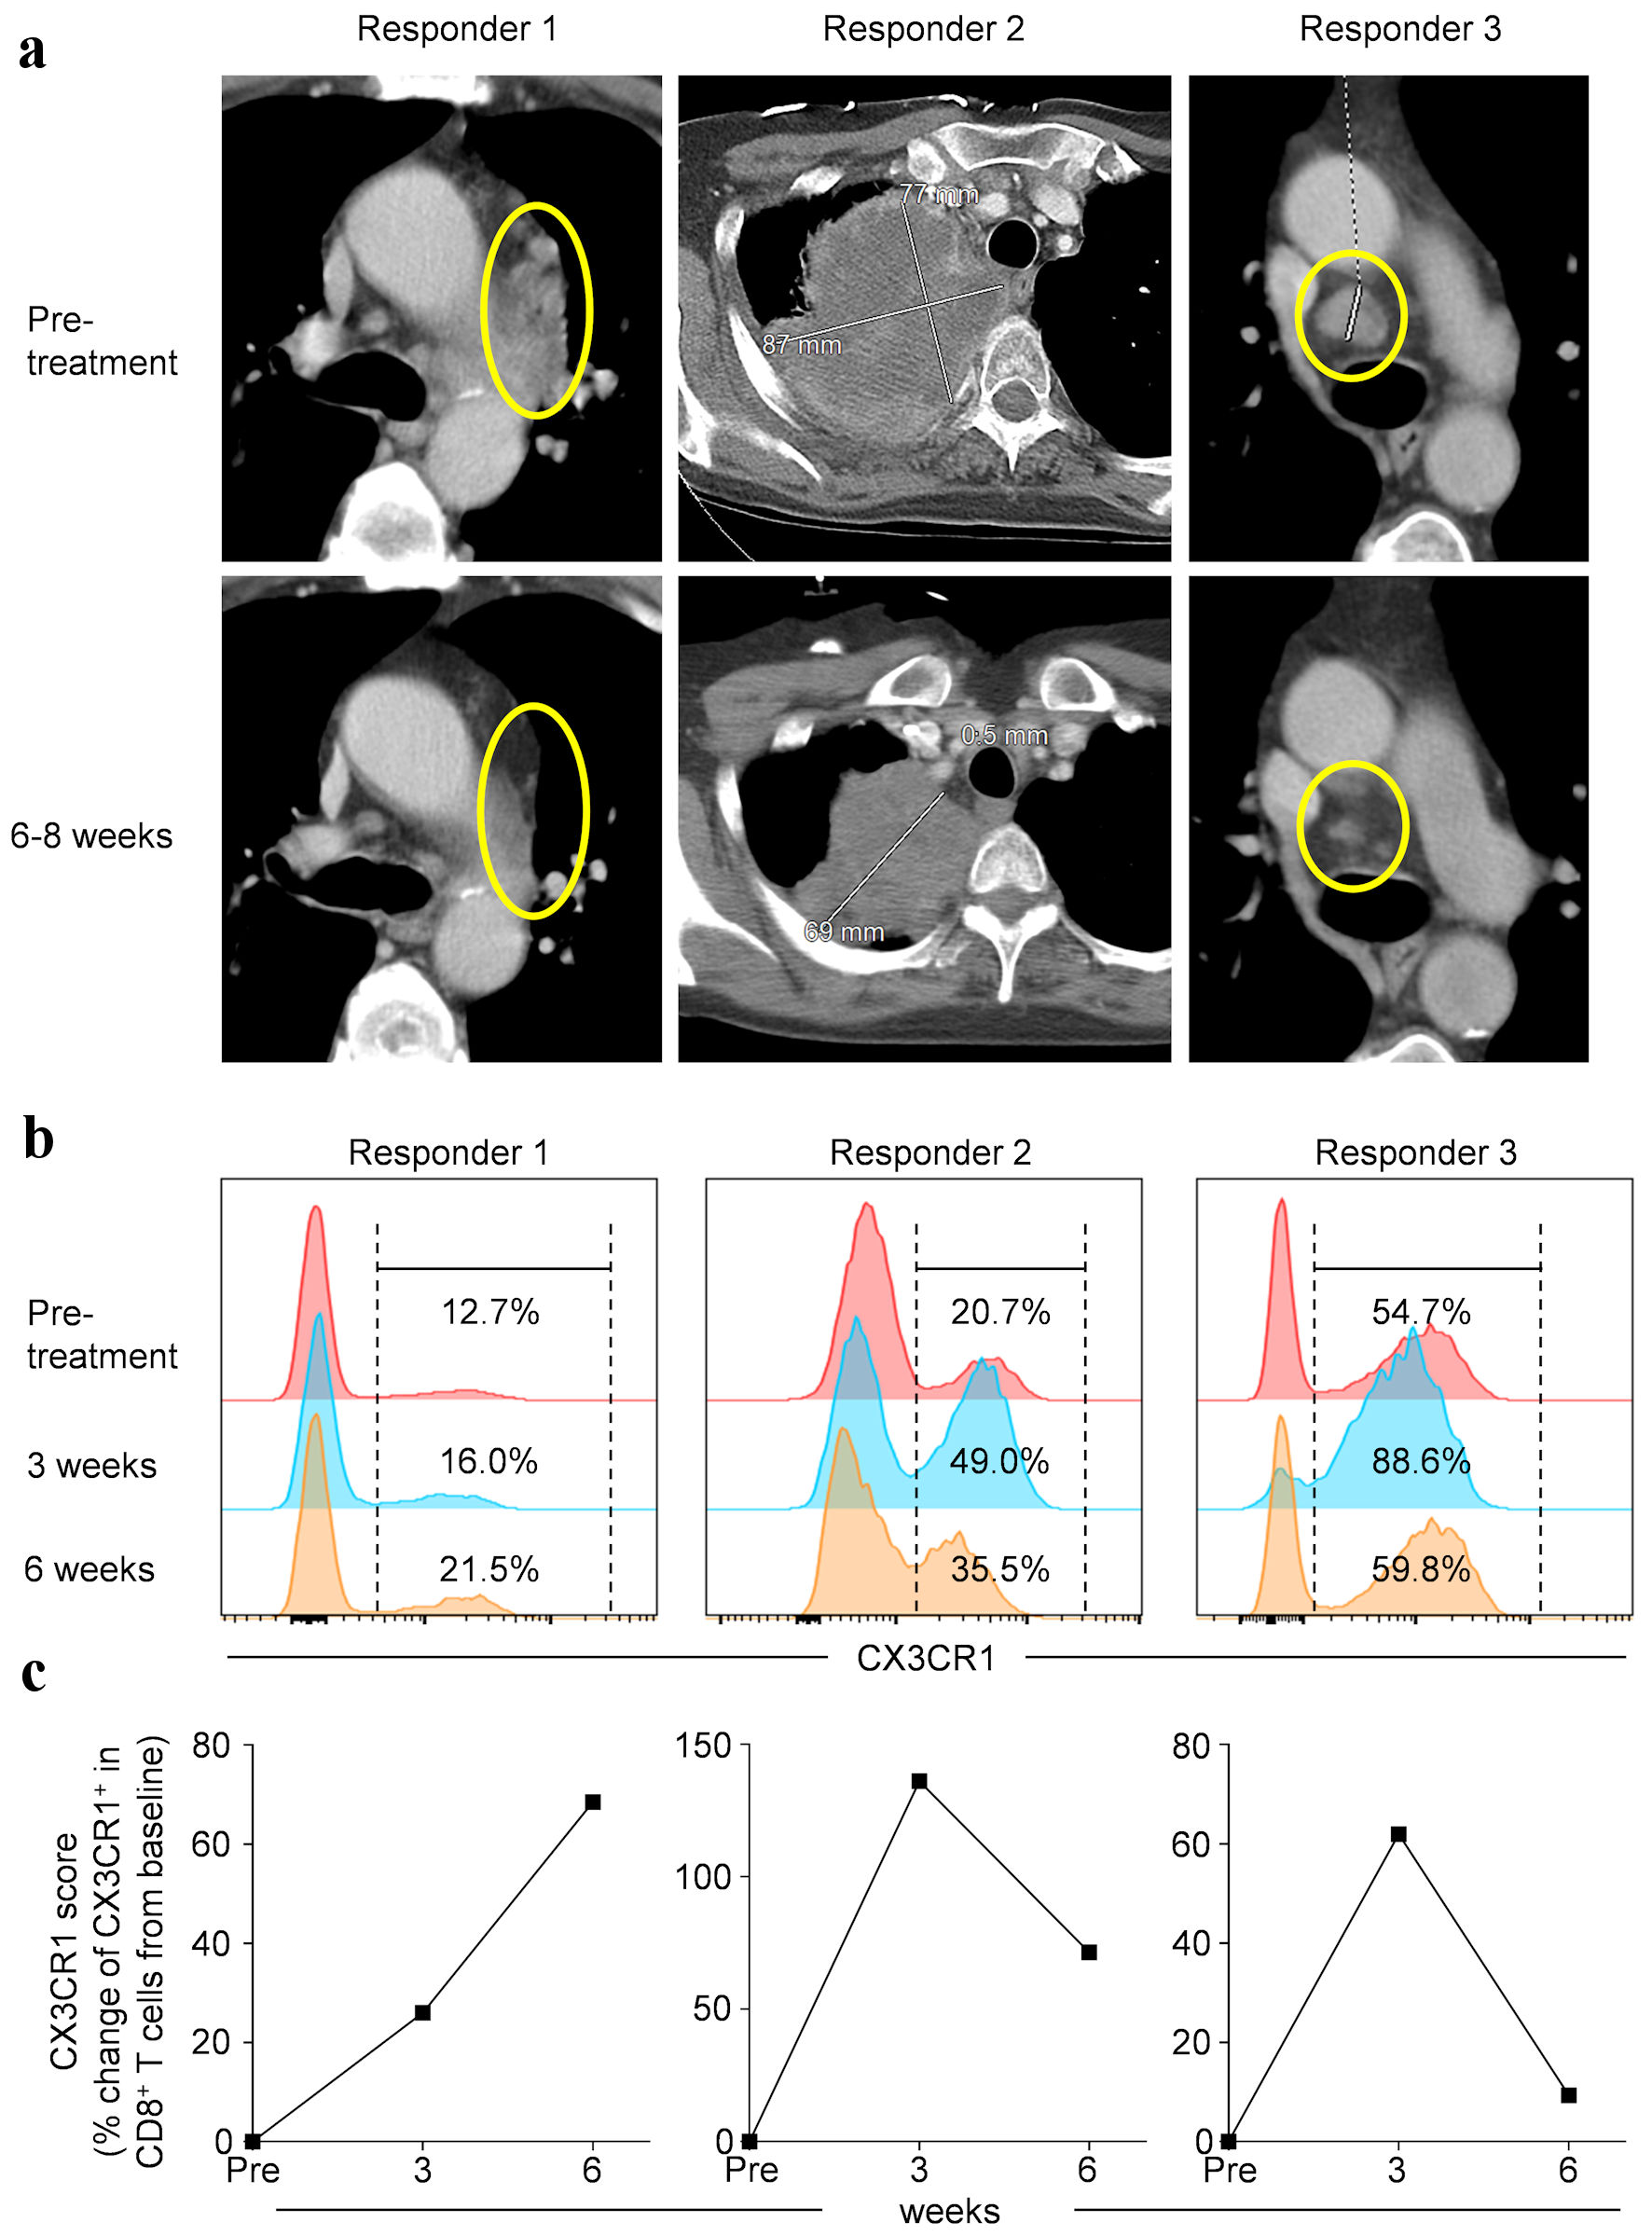
Figure 1. Pre- and on-treatment imaging study and circulating biomarker performance in non-small cell lung cancer (NSCLC) patients treated with anti-PD-1 therapy. (a) Contrast-enhanced cross sectional imaging obtained prior to and during treatment in three patients. Expression of CX3CR1 in peripheral blood CD8+ T cells (b) and % change of CX3CR1+ in CD8+ T cells from baseline (CX3CR1 score) (c) at different time points as indicated. PD-1: programmed cell death protein-1; CX3CR1: CX3C chemokine receptor 1.
Figure 2.
Figure 2. Fluctuations in gut microbiome in non-small cell lung cancer (NSCLC) patients during anti-PD-1 therapy. (a) Alpha diversities of baseline gut microbiome in responders (R) and non-responders (NR). First column: observed diversity reflects the total number of unique organisms. Second column: Chao1 diversity reflects total richness, weighted towards rare species. Third column: Shannon index reflects both richness and evenness of each sample. Fourth column: Simpson index reflects richness, weighted toward common species. (b) Beta-diversity using Bray-Curtis dissimilarity coupled with multidimensional scaling depicting pre- and post-treatment with anti-PD-1 immunotherapy. The first three pairwise principal components were displayed. P value was estimated from PERMANOVA using Bray-Curtis dissimilarity implemented by vegan R package (v2.5.6). Pt: patient; PD-1: programmed cell death protein-1; PERMANOVA permutational multivariate analysis of variance.
Figure 3.
Figure 3. Substantial change in microbial profiles in NSCLC patients responding to anti-PD-1 therapy. (a, b) Significantly abundant genera found in pre- and on-treatment microbial composition between responders (a) and non-responders (b). Heatmap demonstrating significant differences in pre- and post-treatment microbial composition for each subject (n = 5); each pair of blue and yellow columns represents one subject. A variance-stabilization transformation (implemented by DESeq2) was used for the taxa abundance values. Darker shades represent higher differential abundance. (c) Genus composition pre- and on-treatment for all subjects. Pt: patient; NSCLC: non-small cell lung cancer; PD-1: programmed cell death protein-1.

Table

Table 1. Demographic and Clinical Characteristics of Patients
 
Patient characteristicsN = 5
ECOG PS: the Eastern Cooperative Oncology Group Scale of Performance Status; NSCLC: non-small cell lung cancer; PD-L1: PD-1 ligand-1; PD-1: programmed cell death protein-1.
Median age (range)62 (50 - 68)
Sex, n (%)
  Male1 (20%)
  Female4 (80%)
Race, n (%)
  Caucasian5 (100%)
ECOG PS
  03 (60%)
  12 (40%)
History of smoking
  Never1 (20%)
  Former2 (40%)
  Current2 (40%)
Histology, n (%)
  Adenocarcinoma4 (80%)
  NSCLC with giant cell features1 (20%)
Stage at diagnosis, n (%)
  III1 (20%)
  IV4 (80%)
Prior lung surgery for lung cancer, n (%)0 (0%)
Prior chemotherapy for lung cancer, n (%)1 (20%)
Prior targeted therapy for lung cancer, n (%)0 (0%)
Prior radiation, n (%)
  Thoracic radiation1 (20%)
  Bone radiation0 (0%)
  Gamma knife stereotactic radiosurgery2 (40%)
Known brain metastases, n (%)3 (60%)
Drug regimen, n (%)
  Pembrolizumab1 (20%)
  Carboplatin, pemetrexed, pembrolizumab4 (40%)
Best disease response at 12 weeks, n (%)
  Complete response (CR)1 (20%)
  Partial response (PR)2 (40%)
  Stable disease (SD)0 (0%)
  Progressive disease (PD)2 (40%)
PD-L1 expression tumor proportion score
  ≥ 50%1 (20%)
  1-49%3 (60%)
  < 1%0 (0%)
  N/A1 (20%)