Figures
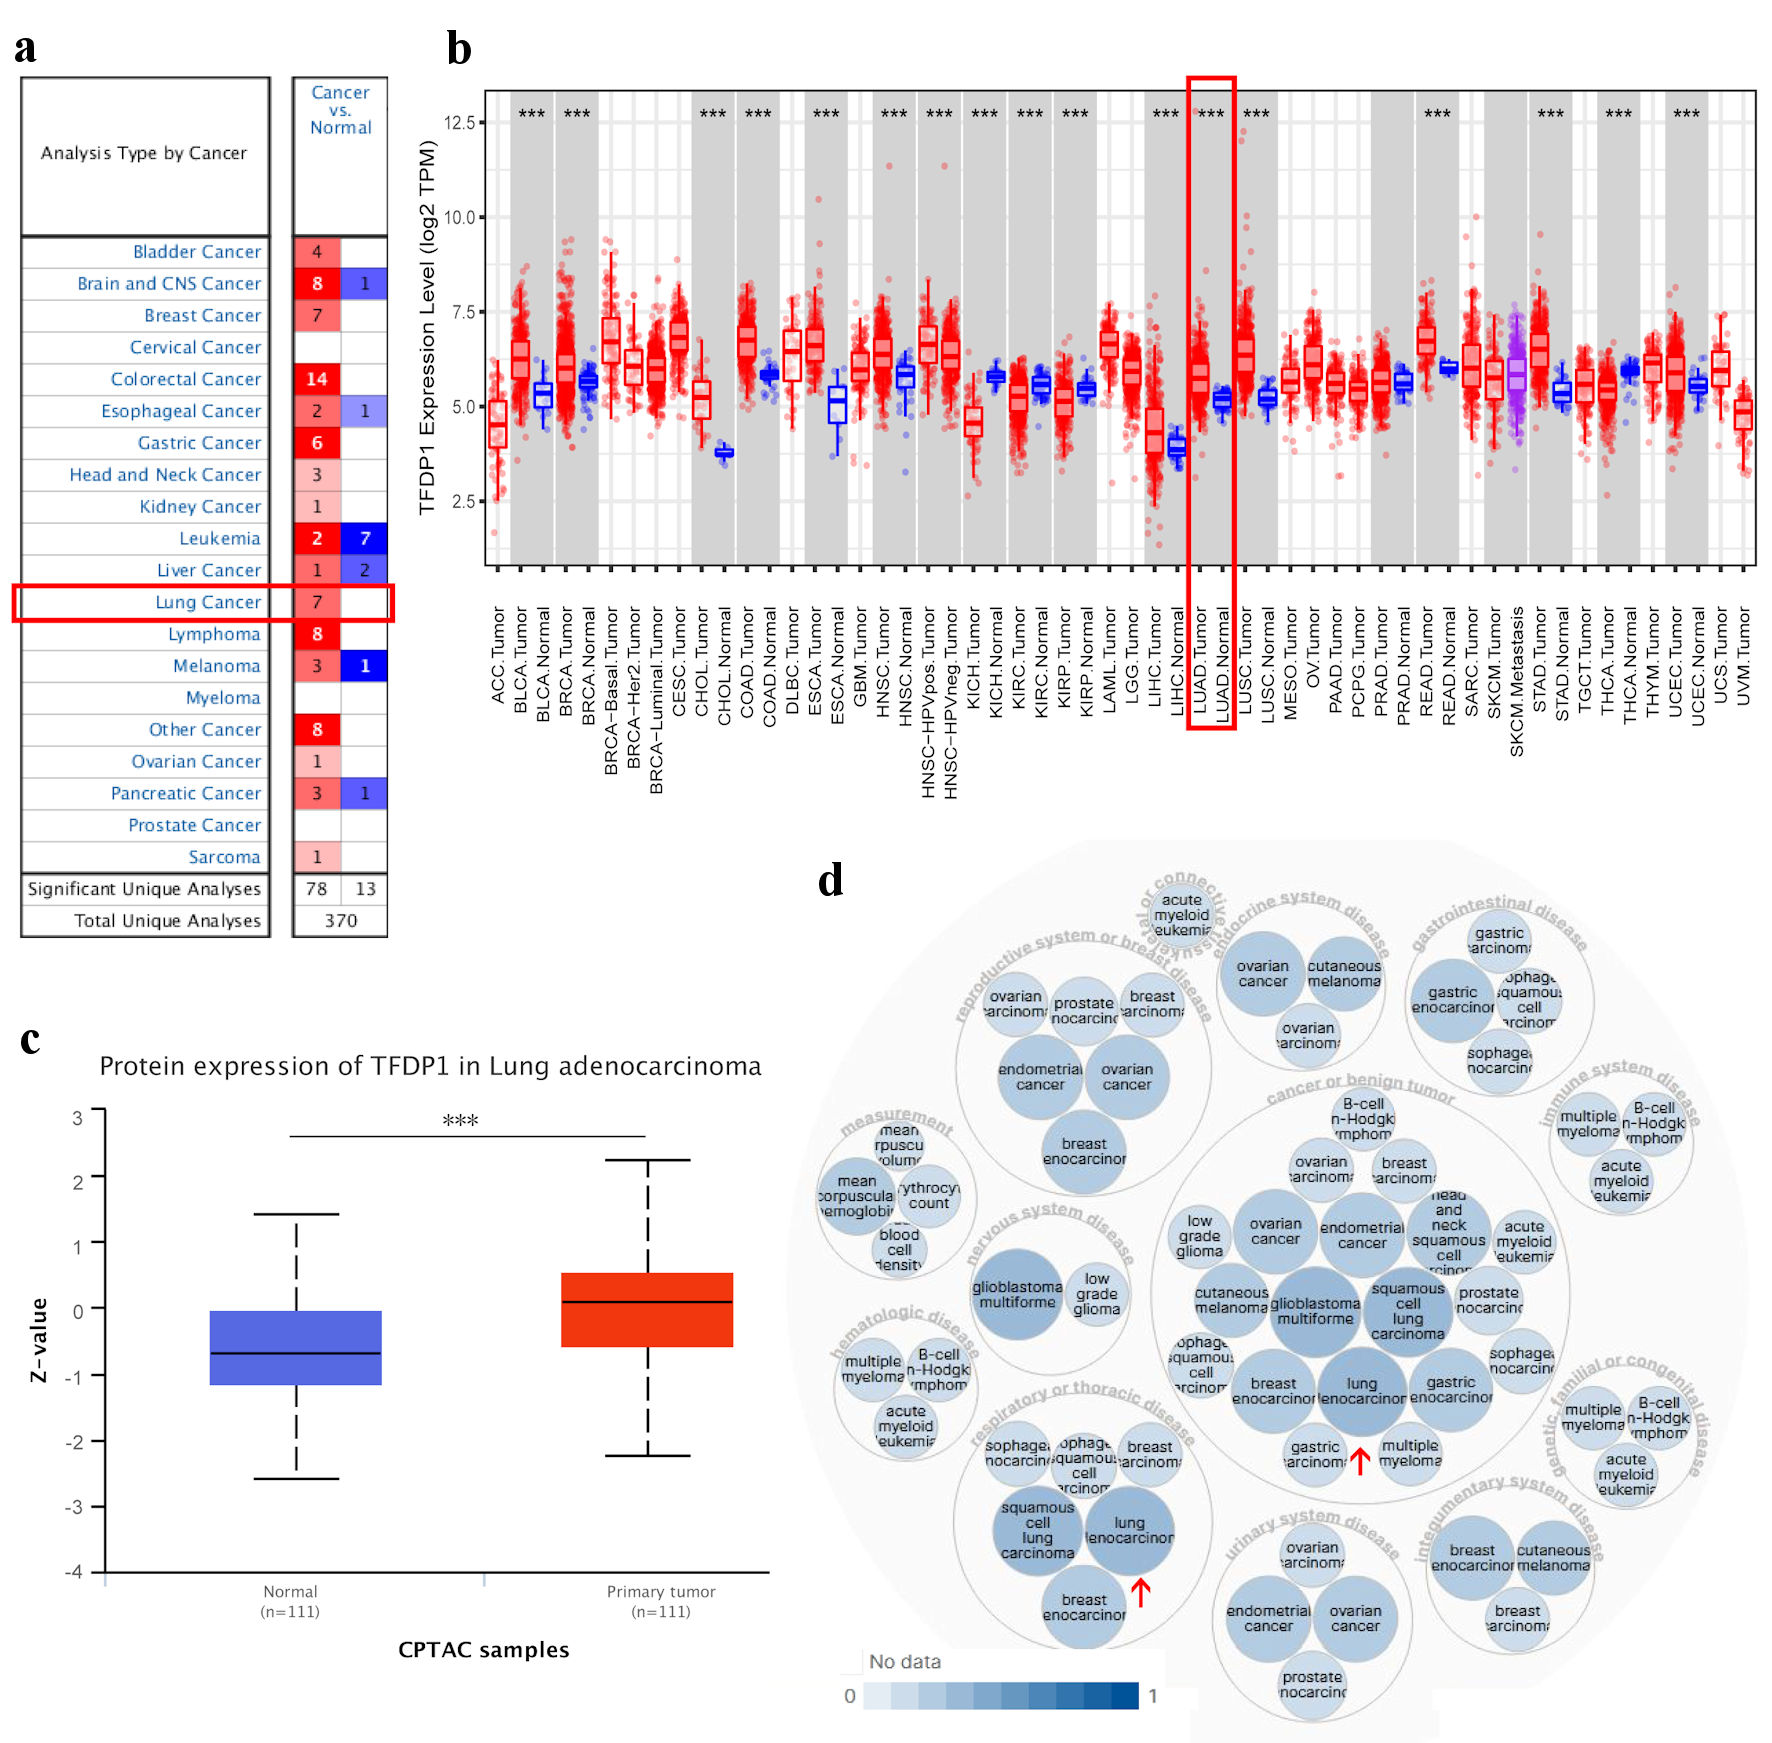
Figure 1. TFDP1 expression in various types of human cancer and its relative diseases. (a) The difference of TFDP1 mRNA levels in cancer tissues and normal tissues (ONCOMINE). (b) The TFDP1 expression difference from the TIMER database. (c) The TFDP1 protein expression differences in the CPTAC database (UALCAN). (d) TFDP1-associated diseases obtained by Open Targets Platform. (***P < 0.001). TFDP1: transcription factor Dp-1; CPTAC: Clinical Proteomics Tumor Analysis Consortium.
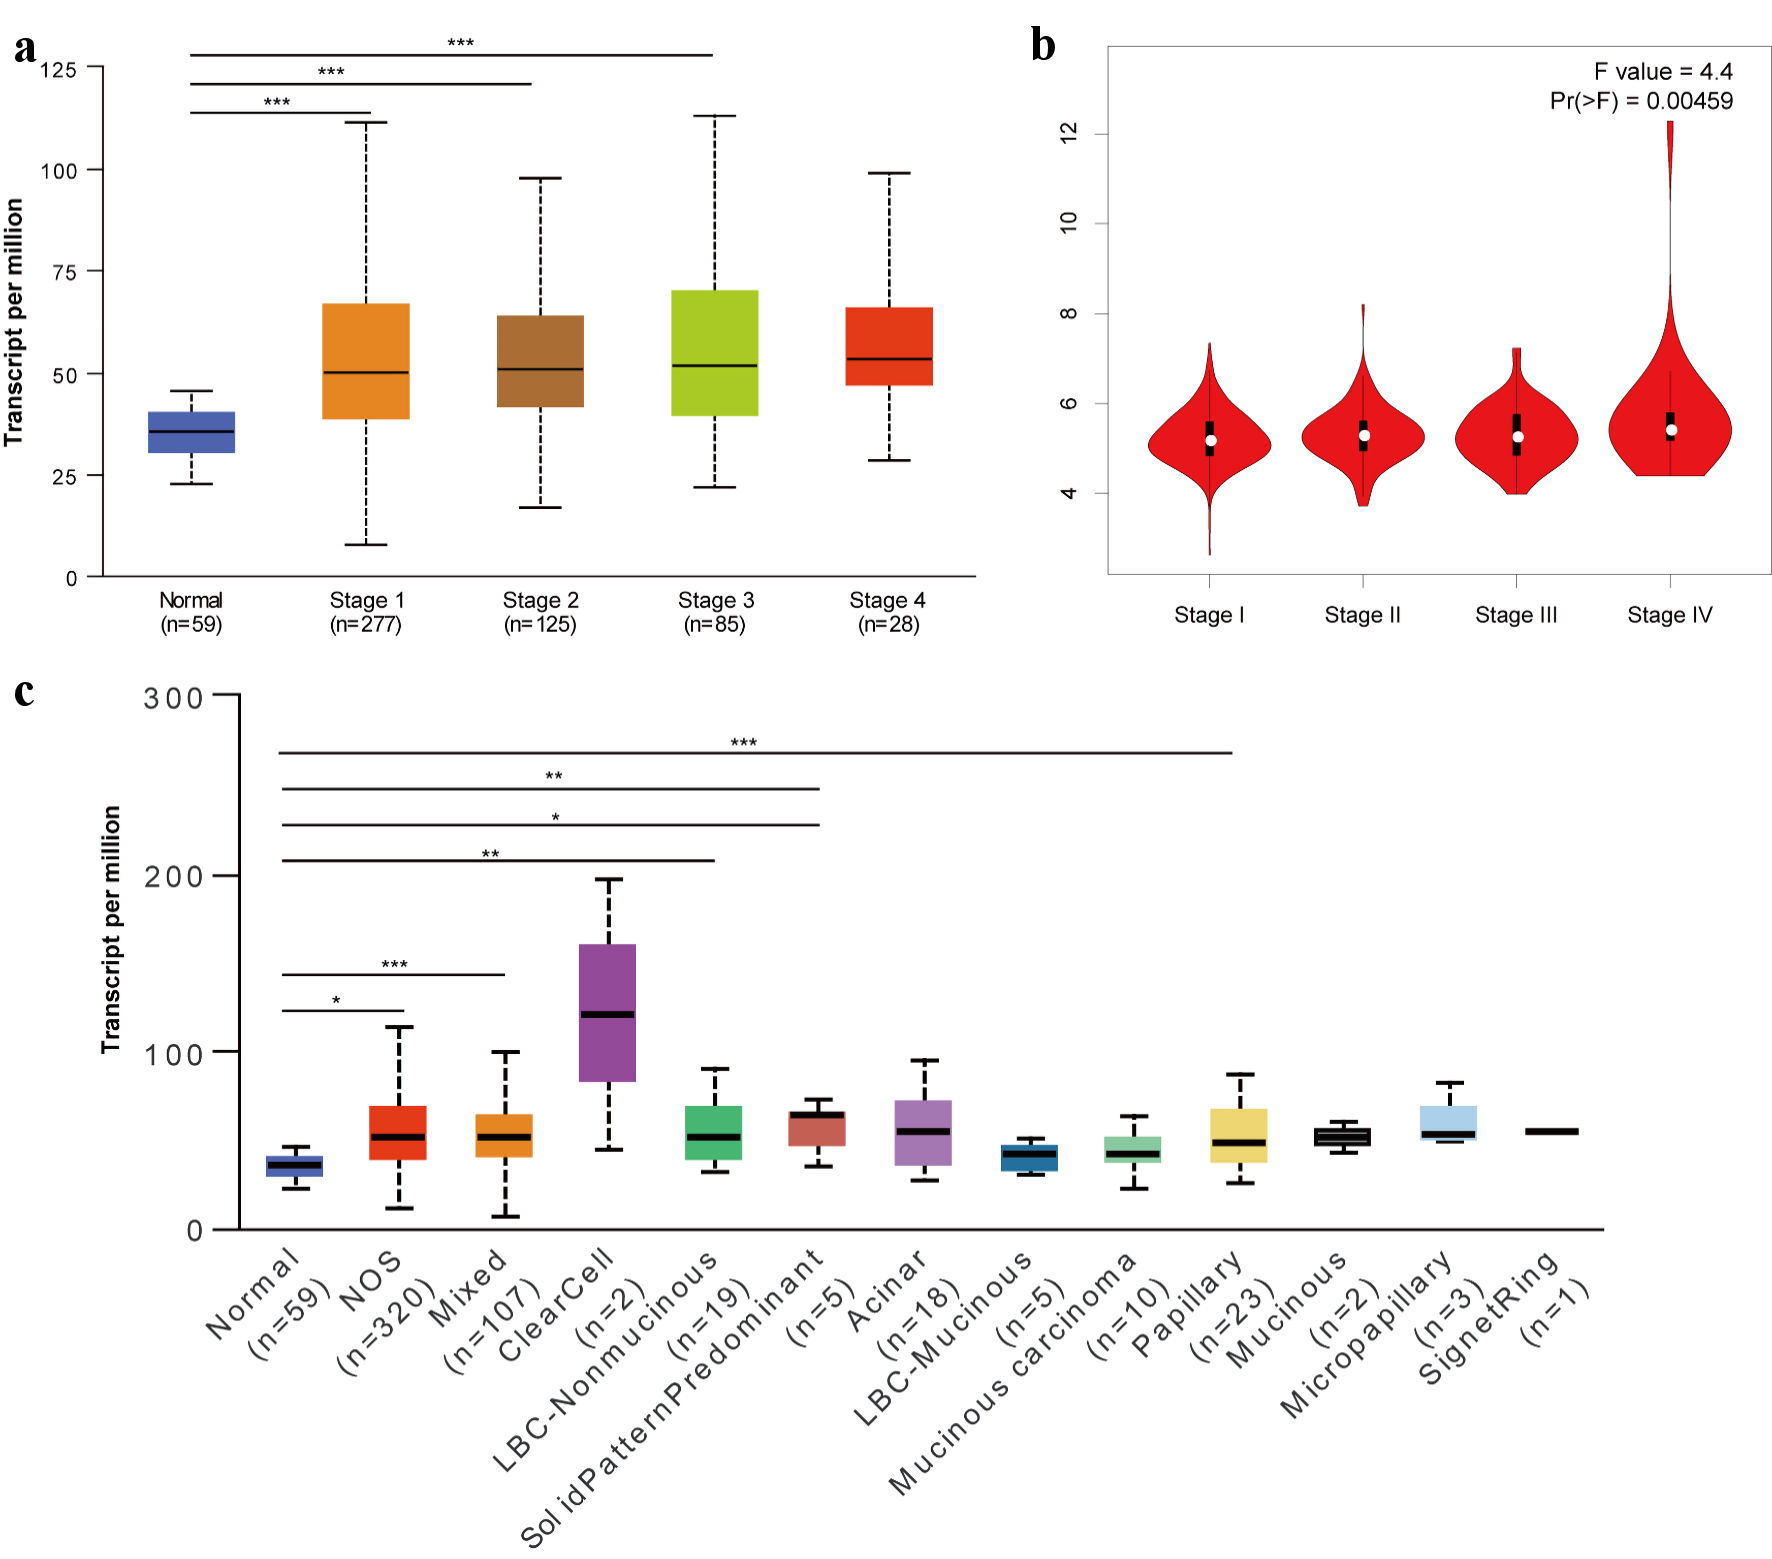
Figure 2. Relationship of TFDP1 with the pathological stages of LUAD patients analyzed by UALCAN (a) and GEPIA 2 (b). (c) TFDP1 expression differences in the LUAD histological subtypes. (*P < 0.05, **P < 0.01, ***P < 0.001). TFDP1: transcription factor Dp-1; LUAD: lung adenocarcinoma.
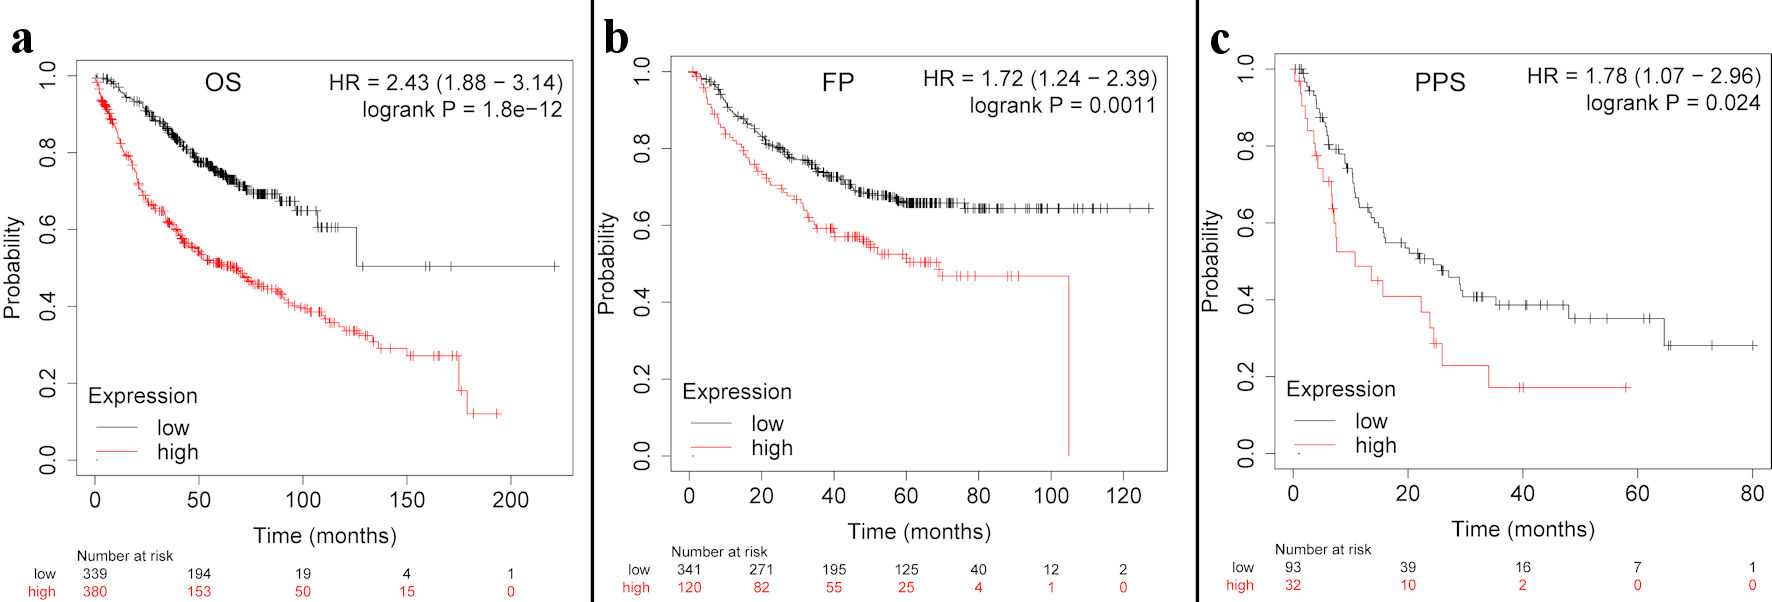
Figure 3. The TFDP1 prognosis in LUAD patients using the Kaplan-Meier plotter. (a)The OS curve of TFDP1 in LUAD. (b) The first progression (FP) curve of TFDP1 in LUAD. (c) The PPS curve of TFDP1 in LUAD. TFDP1: transcription factor Dp-1; LUAD: lung adenocarcinoma; OS: overall survival; PPS: post progression survival.
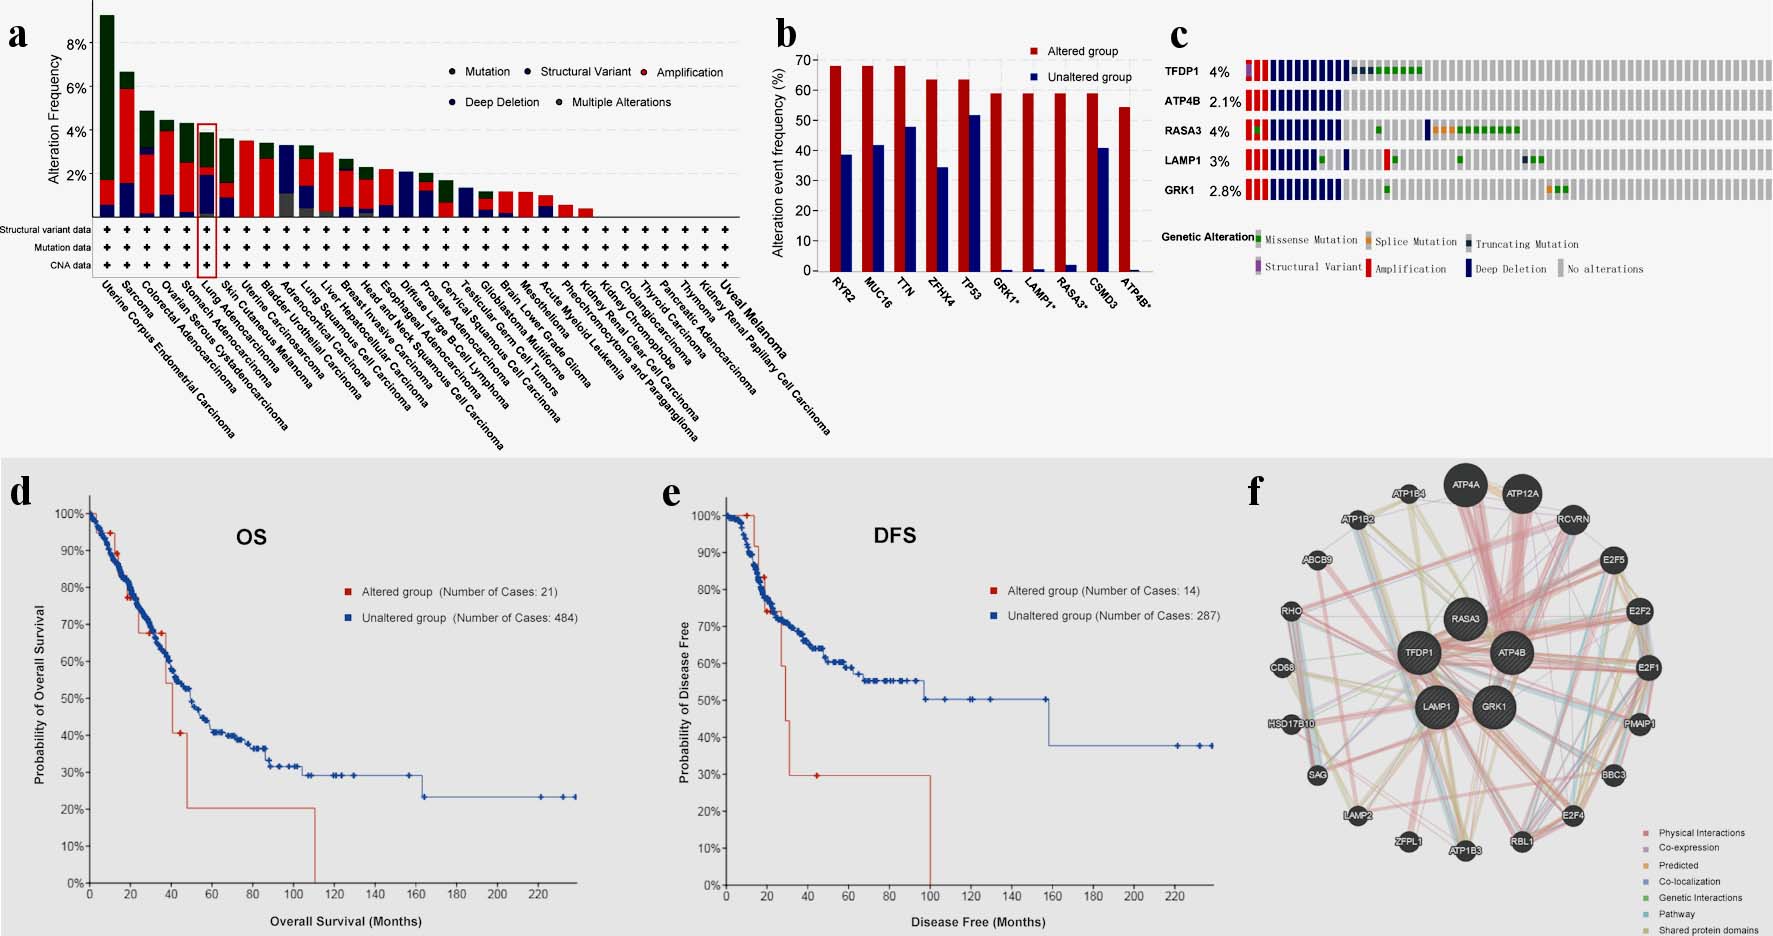
Figure 4. TFDP1 alterations in LUAD patients analyzed by cBioPortal and GeneMANIA. (a) Alteration frequencies of TFDP1 across various human cancers. (b) Alteration frequencies of RYR2, MUC16, TTN, ZFHX4, TP53, GRK1, LAMP1, RASA3, CSMD3, and ATP4B cooccurred with TFDP1 alterations in LUAD. (c) Summary of genetic alterations of TFDP1, ATP4B, RASA3, LAMP1, and GRK1 in LUAD. (d) The OS and (e) the DFS between TFDP1-altered and TFDP1-unaltered groups in LUAD patients. (f) Gene-gene interaction network of TFDP1 and its cooccurred genes. TFDP1: transcription factor Dp-1; LUAD: lung adenocarcinoma; OS: overall survival;DFS: disease-free survival.
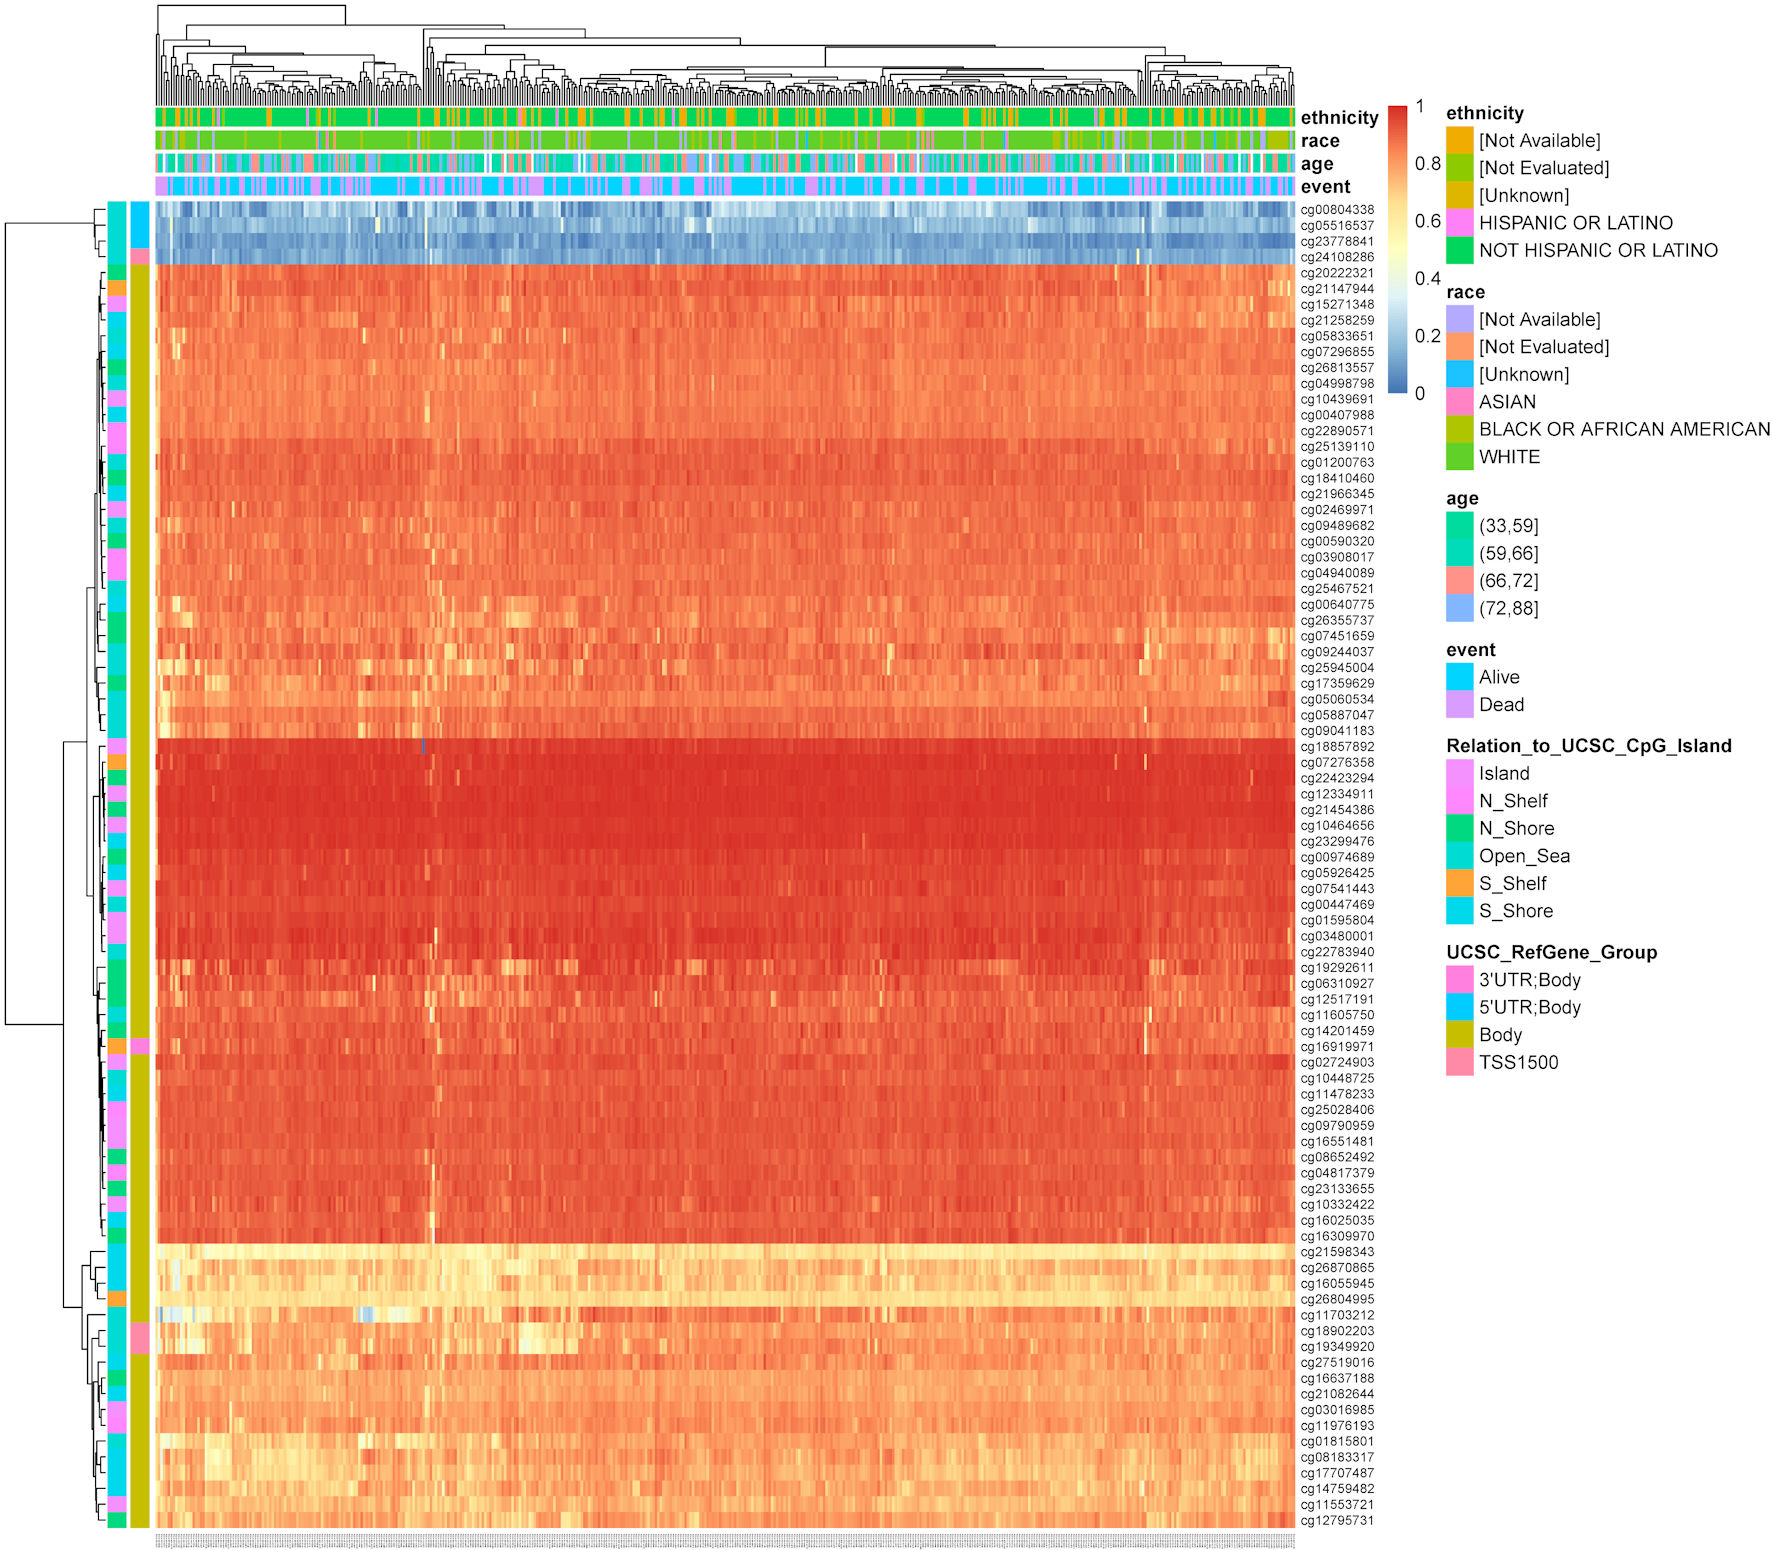
Figure 5. The heatmap shows TFDP1 methylation levels at different CpG sites in LUAD patients (MethSurv). TFDP1: transcription factor Dp-1; LUAD: lung adenocarcinoma.
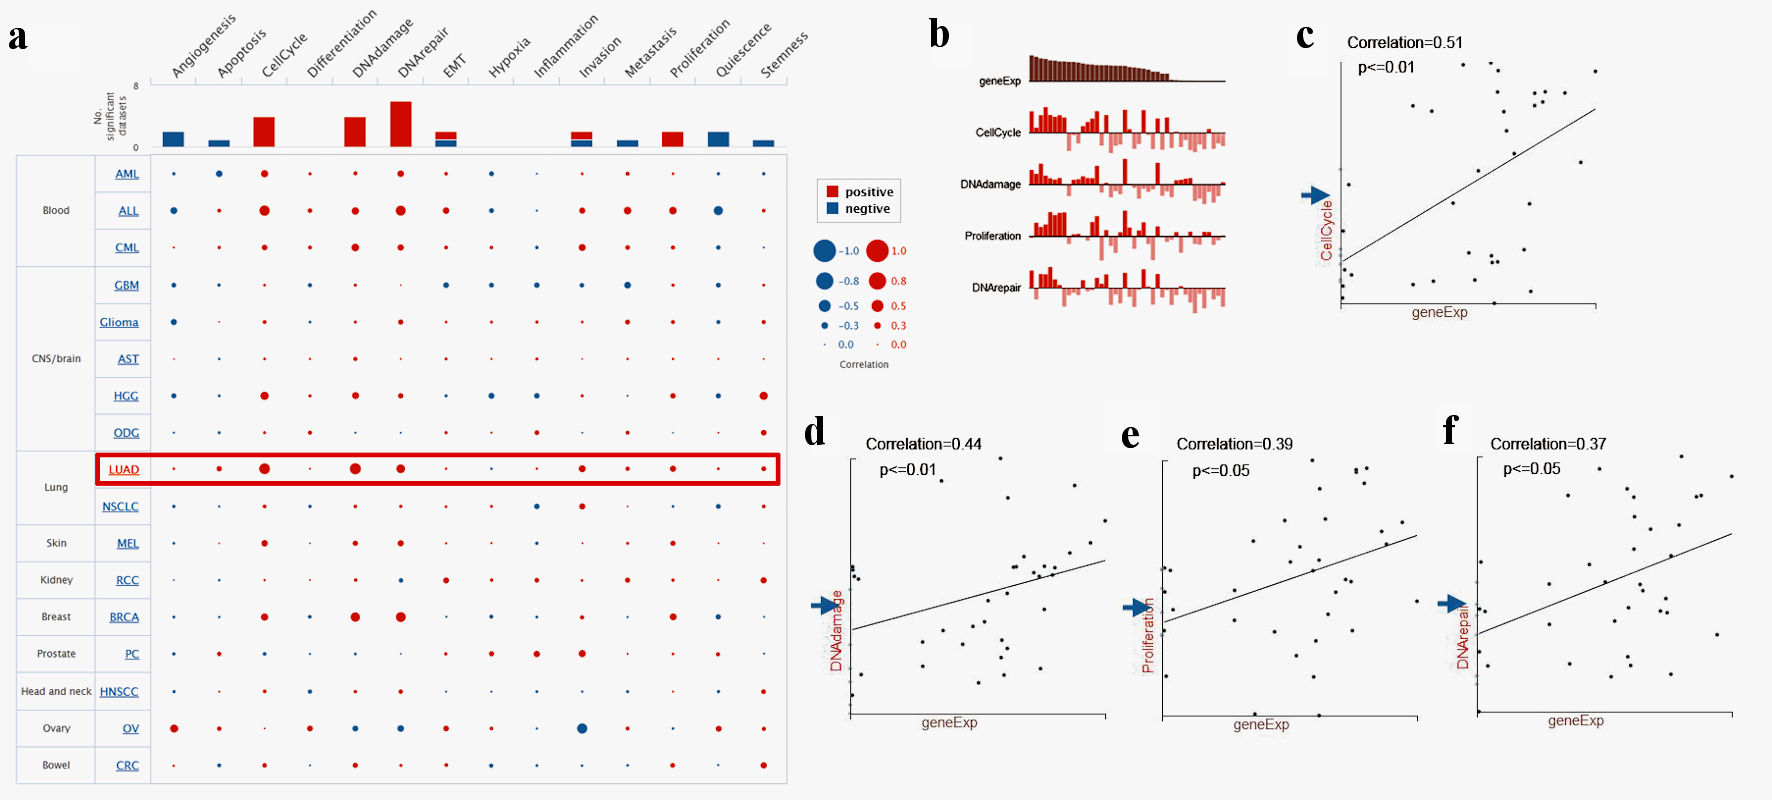
Figure 6. Single-cell functional analysis of TFDP1 in LUAD (CancerSEA). (a) Relevance of TFDP1 across 14 functions in multiple human cancers. (b-f) The various functions were markedly associated with TFDP1 in LUAD. TFDP1: transcription factor Dp-1; LUAD: lung adenocarcinoma.
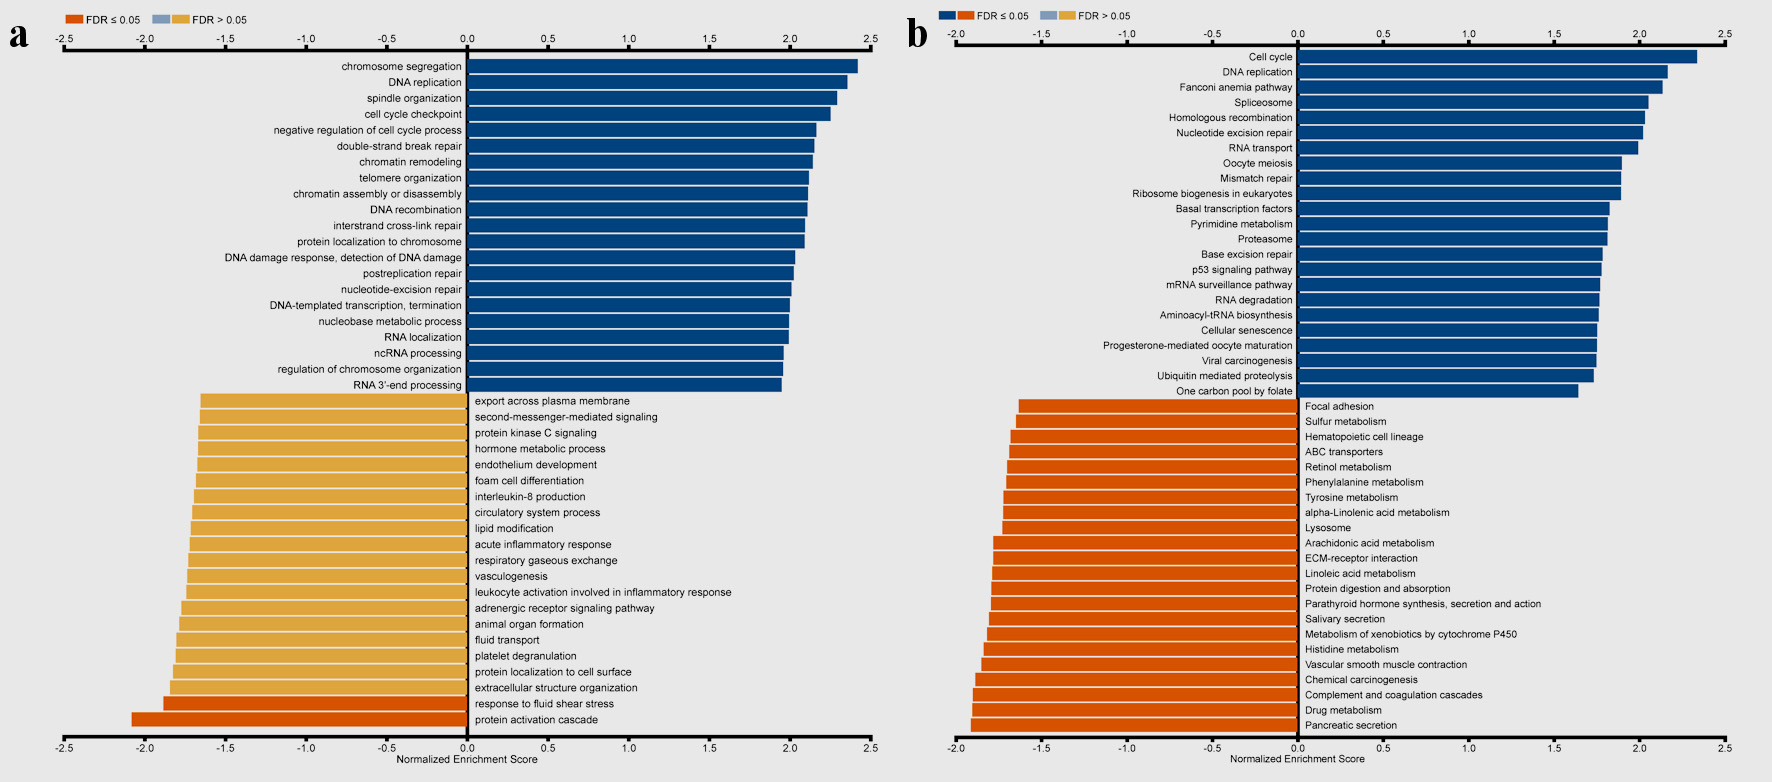
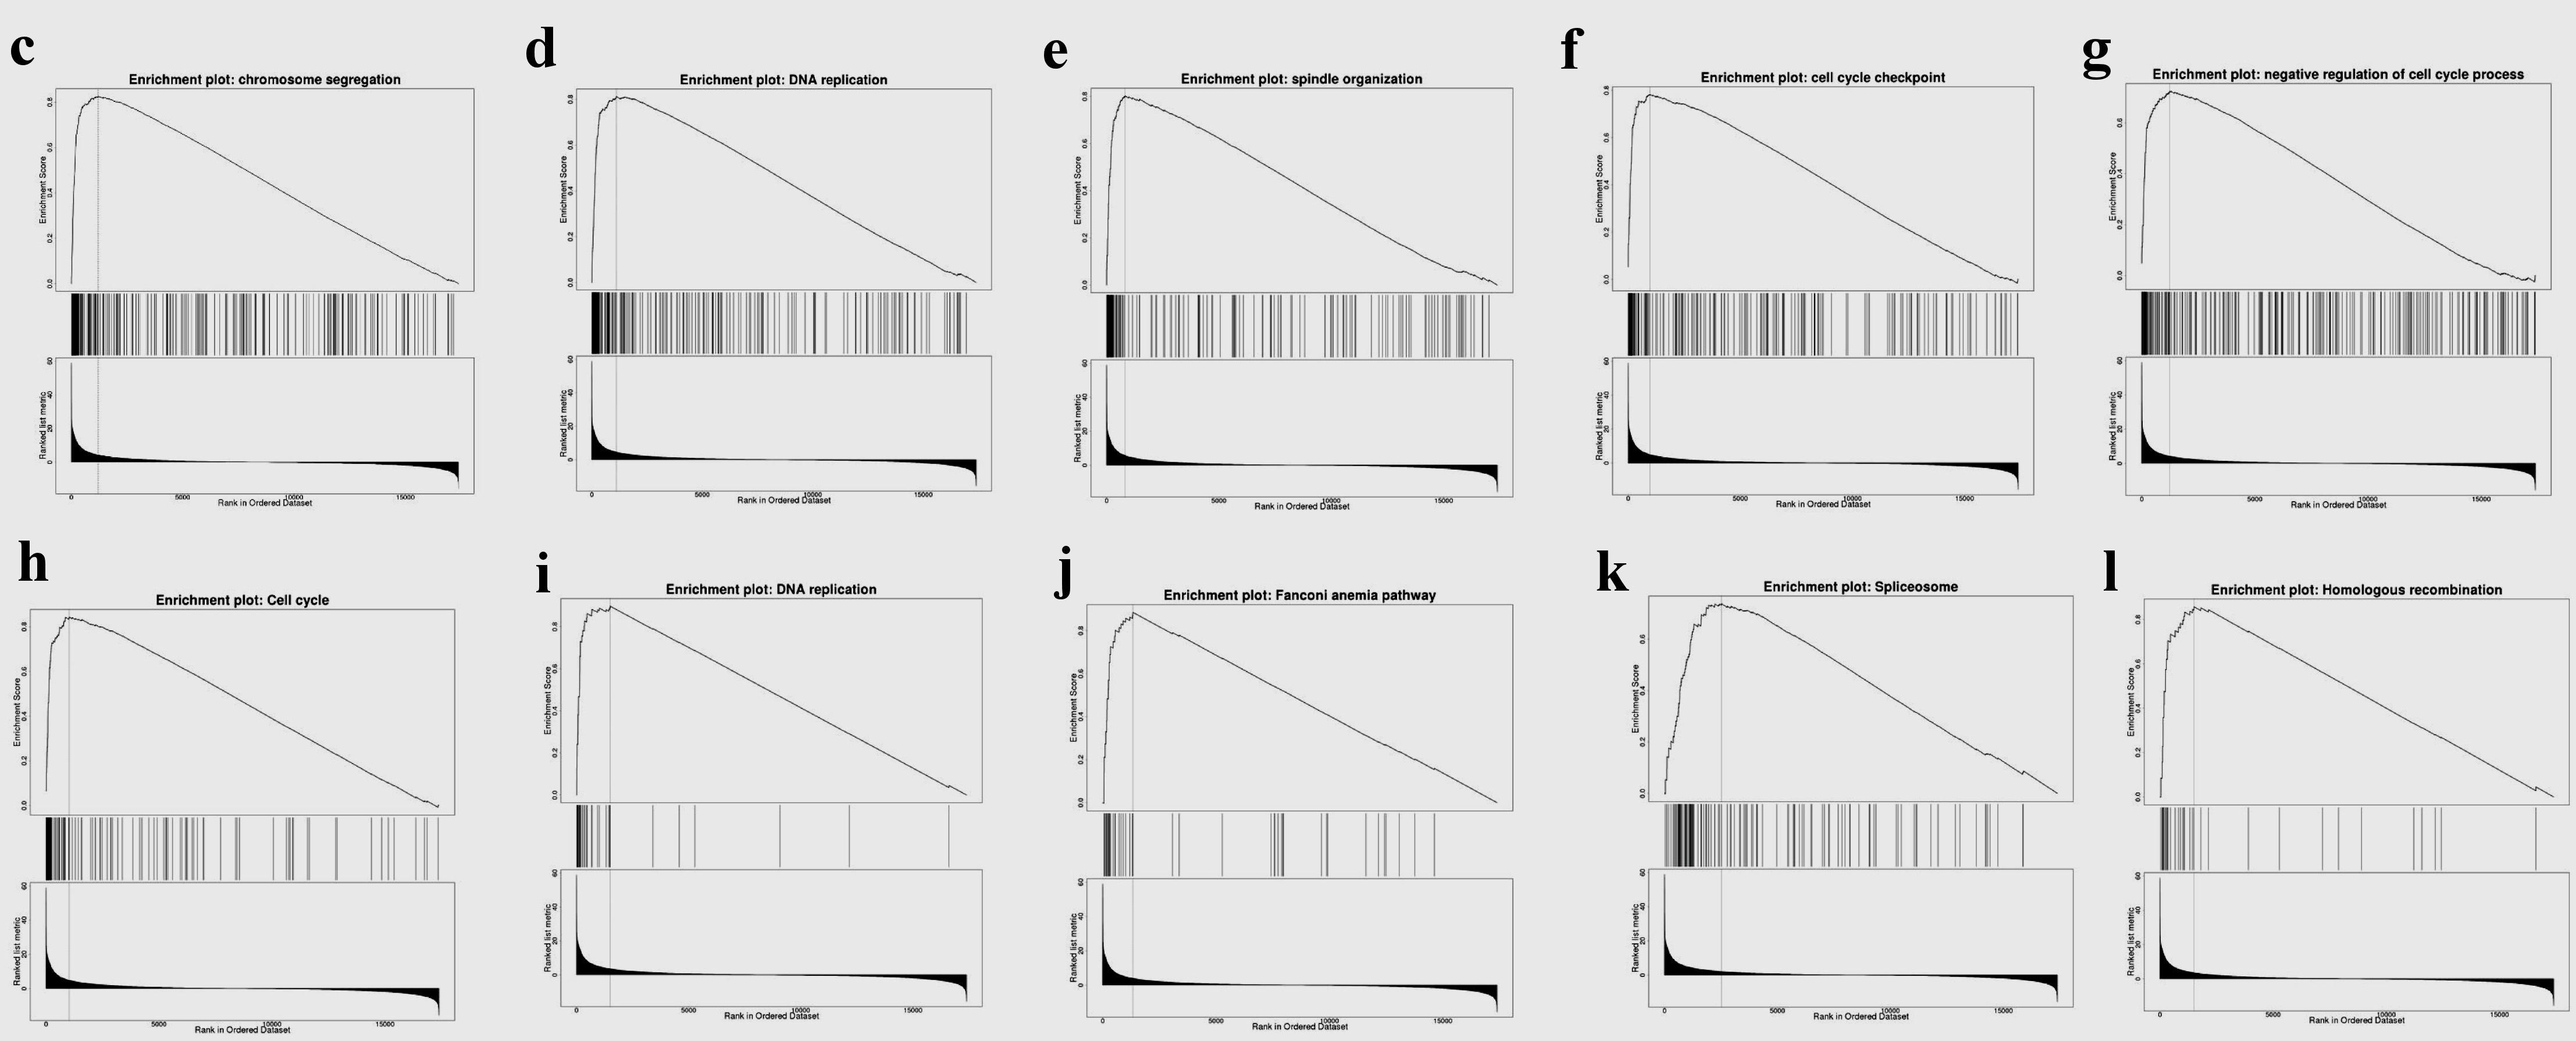
Figure 8. Gene set enrichment analysis of the genes coexpressed with TFDP1 in LUAD (LinkedOmics). (a) Biological process and (b) KEGG pathway analyses of TFDP1 in the TCGA cohort. (c) Chromosome segregation (normalized enrichment score (NES) = 2.4230, P < 0.001). (d) DNA replication (NES = 2.3660, P < 0.001). (e) Spindle organization (NES = 2.3299, P < 0.001). (f) Cell cycle checkpoint (NES = 2.2625, P < 0.001). (g) Negative regulation of cell cycle process (NES = 2.2039, P < 0.001). (h) Cell cycle (NES = 2.3389, P < 0.001). (i) DNA replication (NES = 2.1674, P < 0.001). (j) Fanconi anemia pathway (NES = 2.1372, P < 0.001). (k) Spliceosome (NES = 2.0545, P < 0.001). (l) Homologous recombination (NES = 2.0336, P < 0.001). TFDP1: transcription factor Dp-1; LUAD: lung adenocarcinoma KEGG: Kyoto Encyclopedia of Genes and Genomes; FDR: false discovery rate.
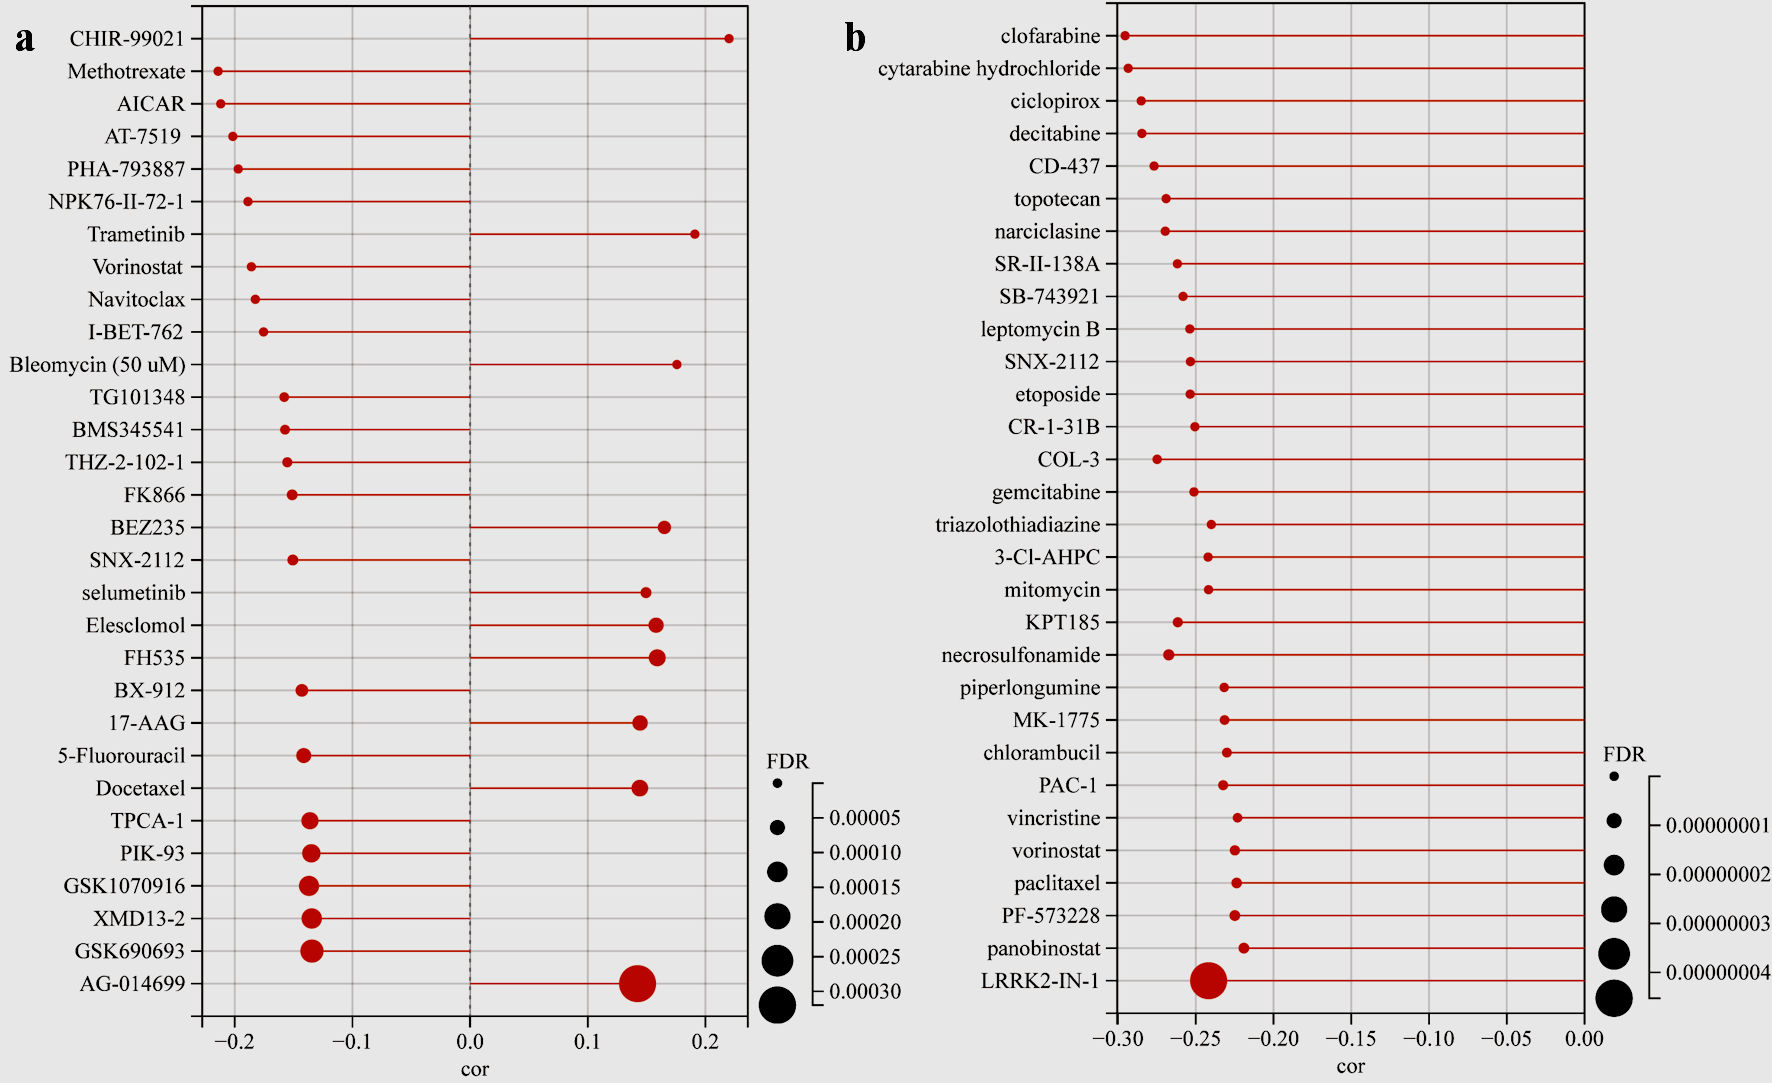
Figure 9. Drug sensitivity analysis. (a) The lollipop plot showing the TFDP1-drug pairs sensitivity in the GDSC database. (b) The lollipop plot showing the TFDP1-drug pairs sensitivity in the CTRP database. TFDP1: transcription factor Dp-1; GDSC: Genomics of Drug Sensitivity in Cancer; CTRP: Cancer Therapeutics Response Portal.
Tables
Table 1. Univariate and multivariate Cox regression analysis in LUAD
| Variables | Univariate analysis | Multivariate analysis |
|---|
| N | Hazard ratio | P value | Hazard ratio | P value |
|---|
| *P < 0.05. TFDP1: transcription factor Dp-1; LUAD: lung adenocarcinoma; AJCC: American Joint Committee on Cancer. |
| TFDP1 | | | | | |
| Low | 377 | Reference | | |
| High | 142 | 1.43 (1.05 - 1.94) | 0.023* | 1.29 (0.94 - 1.76) | 0.117 |
| AJCC pathologic stage | | | < 0.001* | | |
| I | 289 | Reference | | |
| II | 124 | 2.25 (1.58 - 3.21) | < 0.001* | 1.16 (0.63 - 2.14) | 0.625 |
| III | 80 | 3.52 (2.42 - 5.11) | < 0.001* | 1.62 (0.68 - 3.86) | 0.274 |
| IV | 26 | 3.72 (2.16 - 6.43) | < 0.001* | 2.32 (1.16 - 4.65) | 0.017* |
| AJCC stage T | | | < 0.001* | | |
| T1 | 172 | Reference | | |
| T2 | 280 | 1.50 (1.05 - 2.13) | 0.025* | 1.23 (0.84 - 1.77) | 0.268 |
| T3 | 46 | 2.94 (1.75 - 4.94) | < 0.001* | 2.30 (1.24 - 4.28) | 0.008* |
| Other | 21 | 3.49 (1.91 - 6.39) | < 0.001* | 1.67 (0.81 - 3.43) | 0.162 |
| AJCC stage N | | | < 0.001* | | |
| N0 | 340 | Reference | | |
| N1 | 95 | 2.26 (1.60 - 3.18) | < 0.001* | 1.87 (1.06 - 3.30) | 0.032* |
| N2 | 70 | 3.11 (2.14 - 4.53) | < 0.001* | 1.82 (0.82 - 4.03) | 0.138 |
| Other | 14 | 1.23 (0.45 - 3.34) | 0.690 | 0.88 (0.31 - 2.55) | 0.818 |
Table 2. The Significant Correlation of TFDP1 Methylation at Different CpG Sites With the Prognosis in LUAD
| CpG sites | HR | CI | P value | UCSC_RefGene_Group | Relation_to_UCSC_CpG_Island |
|---|
| TFDP1: transcription factor Dp-1; LUAD: lung adenocarcinoma; HR: hazard ratio; CI: confidence interval. |
| cg10439691 | 1.525 | (1.104; 2.105) | 0.010365787 | Body | Island |
| cg11976193 | 1.435 | (1.045; 1.97) | 0.025736416 | Body | N_Shelf |
| cg01595804 | 0.678 | (0.475; 0.969) | 0.032998214 | Body | Island |
| cg26355737 | 0.699 | (0.499; 0.978) | 0.03671796 | Body | N_Shore |