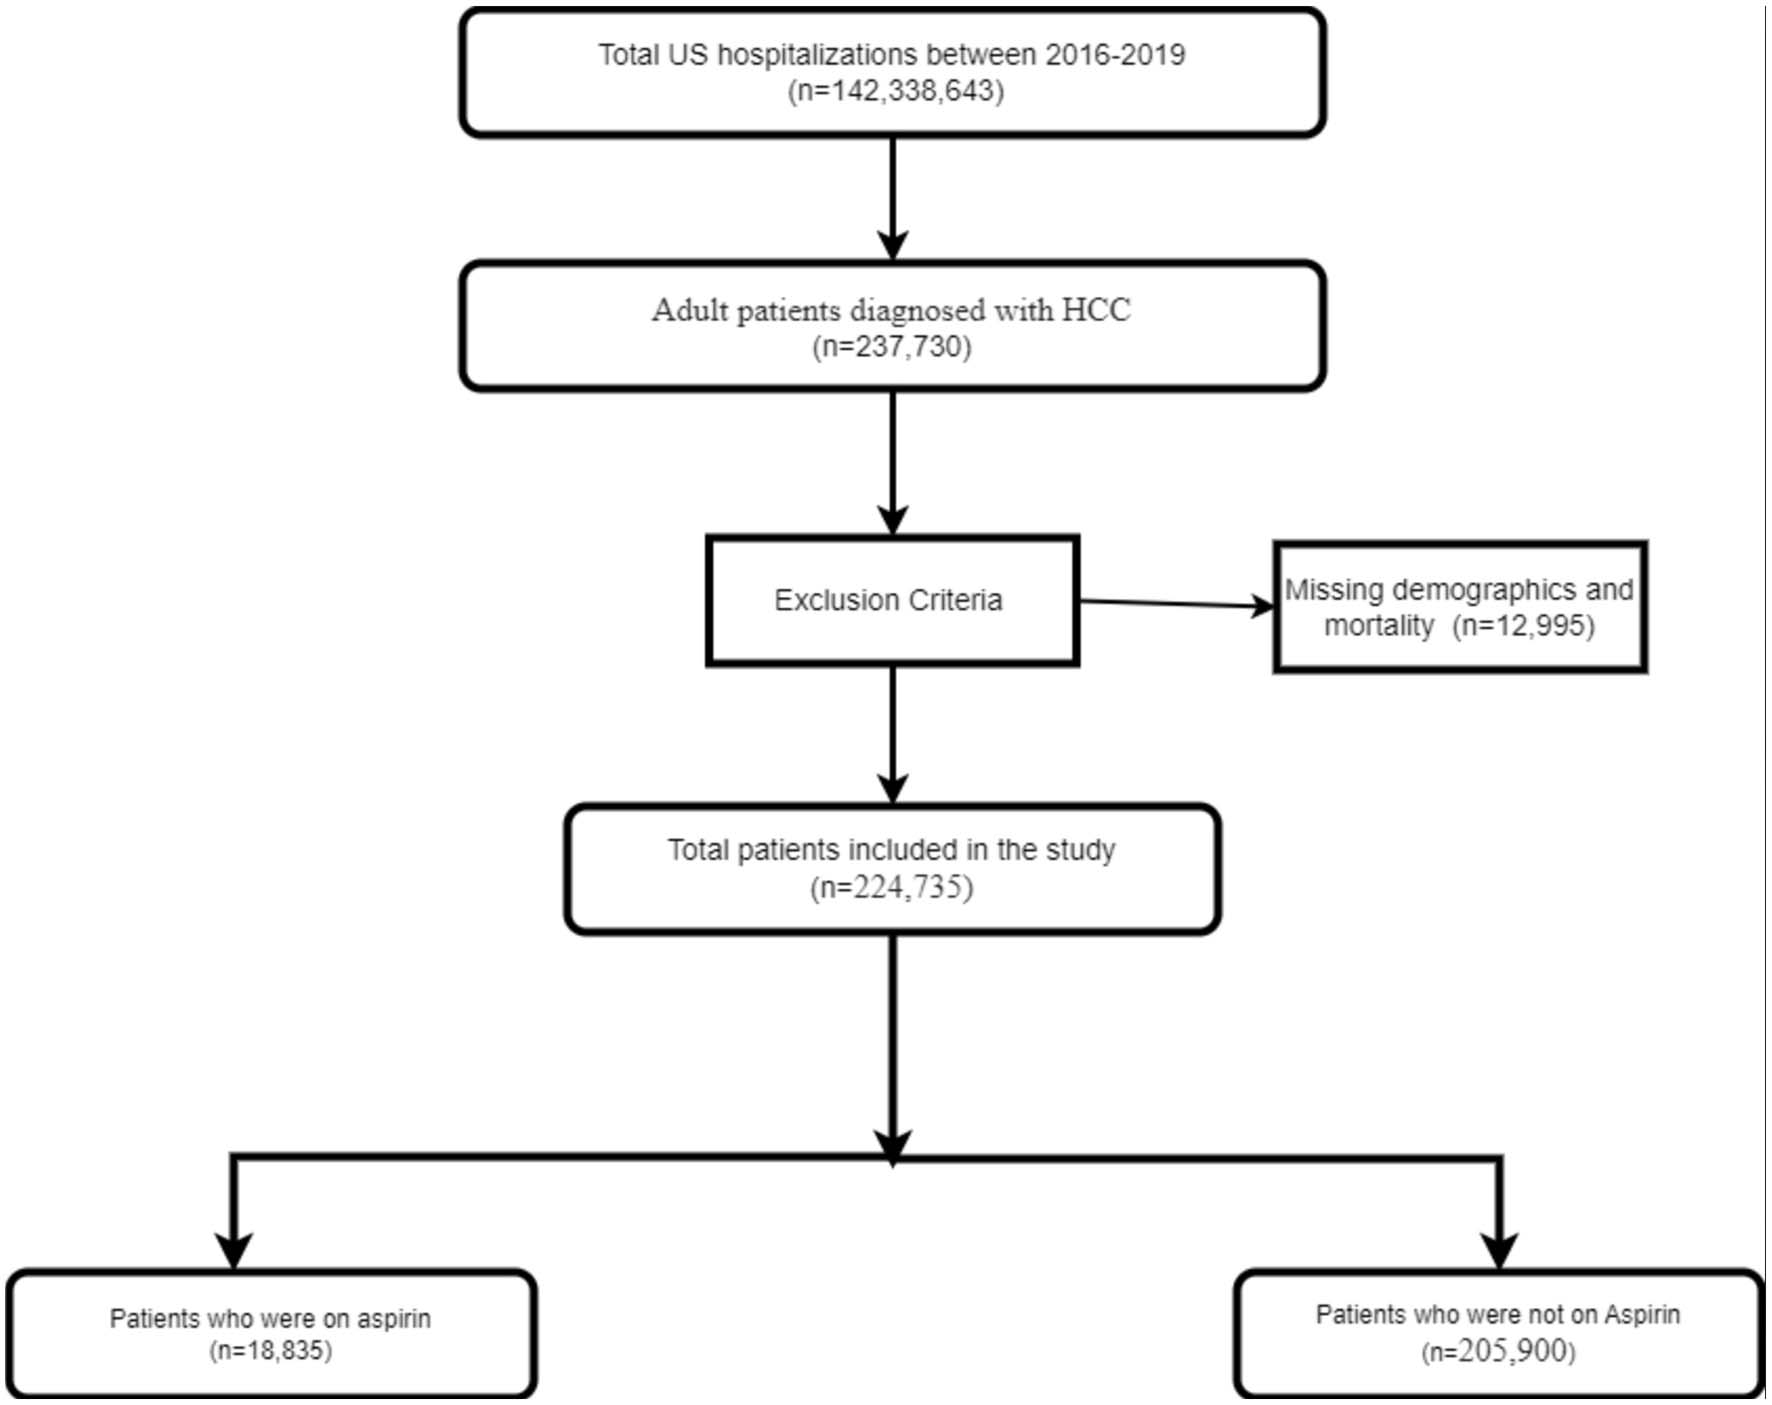
Figure 1. Inclusion flow diagram of patients with HCC. HCC: hepatocellular carcinoma.
| World Journal of Oncology, ISSN 1920-4531 print, 1920-454X online, Open Access |
| Article copyright, the authors; Journal compilation copyright, World J Oncol and Elmer Press Inc |
| Journal website https://www.wjon.org |
Original Article
Volume 14, Number 3, June 2023, pages 195-204
Impact of Aspirin Use on Outcomes in Patients With Hepatocellular Cancer: A Nationwide Analysis
Figures
Tables
| Demographics | No aspirin use, n (%) | Aspirin use, n (%) | P value |
|---|---|---|---|
| *P < 0.05. | |||
| Age category | |||
| 18 - 44 | 6,025 (2.93) | 115 (0.61) | < 0.001* |
| 45 - 64 | 95,745 (46.5) | 5,770 (30.63) | |
| > 65 | 104,130 (50.57) | 12,950 (68.75) | |
| Sex | |||
| Male | 153,110 (74.4) | 14,735 (78.23) | < 0.001* |
| Female | 52,790 (25.64) | 4,100 (21.8) | |
| Race | |||
| White | 112,575 (54.67) | 11,540 (61.27) | < 0.001* |
| Black | 31,325 (15.21) | 3,480 (18.48) | |
| Hispanic | 36,885 (17.91) | 2,265 (12.03) | |
| Asian/Pacific Islander | 14,875 (7.22) | 935 (4.96) | |
| Native American | 2,040 (0.99) | 150 (0.80) | |
| Other | 8,200 (3.98) | 465 (2.47) | |
| Primary expected payer | |||
| Medicare | 108,920 (52.9) | 12,715 (67.51) | < 0.001* |
| Medicaid | 40,480 (19.66) | 2,270 (12.05) | |
| Private | 42,205 (20.5) | 3,055 (16.22) | |
| Uninsured | 6,425 (3.12) | 230 (1.22) | |
| Median household income | |||
| Lowest quartile | 66,725 (32.41) | 6,155 (32.68) | 0.74 |
| Second quartile | 52,195 (25.35) | 4,675 (24.82) | |
| Third quartile | 47,065 (22.86) | 4,235 (22.48) | |
| Highest quartile | 39,915 (19.39) | 3,770 (20.02) | |
| Hospital region | |||
| Northeast | 41,300 (20.06) | 3,625 (19.25) | < 0.001* |
| Midwest | 35,695 (17.34) | 4,480 (23.79) | |
| South | 77,620 (37.7) | 6,890 (36.58) | |
| West | 51,285 (24.91) | 3,840 (20.39) | |
| Hospital location | |||
| Rural | 7,135 (3.47) | 645 (3.43) | 0.91 |
| Urban | 198,765 (96.53) | 18,190 (96.58) | |
| Hospital teaching status | |||
| Non-teaching hospitals | 36,055 (17.51) | 2,995 (15.9) | 0.02* |
| Teaching hospitals | 169,845 (82.49) | 15,840 (84.1) | |
| Hospital bed size | |||
| Small | 29,565 (14.36) | 2,820 (14.97) | 0.62 |
| Medium | 50,220 (24.39) | 4,620 (24.53) | |
| Large | 126,115 (61.25) | 11,395 (60.5) | |
| Elixhauser comorbidities | |||
| 0 | 1,745 (.85) | 90 (0.48) | < 0.001* |
| 1 | 6,985 (3.39) | 345 (1.83) | |
| 2 | 16,975 (8.24) | 945 (5.01) | |
| > 3 | 180,195 (87.52) | 17,455 (92.67) | |
| Comorbidities | No aspirin use, n (%) | Aspirin use, n (%) | P value |
|---|---|---|---|
| *P < 0.05. AIDS: acquired immunodeficiency syndrome; HIV: human immunodeficiency virus. | |||
| Congestive heart failure | 26,690 (12.96) | 4,615 (24.5) | < 0.001* |
| Cardiac arrhythmias | 36,830 (17.89) | 4,940 (26.23) | < 0.001* |
| Valvular disease | 8,740 (4.25) | 1,640 (8.71) | < 0.001* |
| Pulmonary circulation disorders | 9,585 (4.66) | 1,065 (5.65) | 0.0084* |
| Peripheral vascular disorders | 11,720 (5.7) | 2,220 (11.79) | < 0.001* |
| Hypertension, uncomplicated | 79,850 (38.78) | 9,135 (48.5) | < 0.001* |
| Paralysis | 2,340 (1.14) | 190 (1.00) | 0.4792 |
| Other neurological disorders | 25,765 (12.51) | 1,975 (10.49) | 0.0004* |
| Chronic pulmonary disease | 39,600 (19.23) | 4,680 (24.85) | < 0.001* |
| Diabetes, uncomplicated | 36,055 (17.51) | 4,320 (22.94) | < 0.001* |
| Diabetes, complicated | 43,370 (21.06) | 5,885 (31.25) | < 0.001* |
| Hypothyroidism | 21,115 (10.25) | 2,245 (11.92) | 0.0016* |
| Renal failure | 41,860 (20.33) | 4,950 (26.28) | < 0.001* |
| Peptic ulcer disease excluding bleeding | 3,765 (1.83) | 345 (1.83) | 0.9893 |
| AIDS/HIV | 1,515 (0.74) | 60 (0.32) | 0.0028* |
| Lymphoma | 1,580 (0.77) | 170 (0.90) | 0.3617 |
| Metastatic cancer | 41,030 (19.93) | 3,155 (16.75) | < 0.001* |
| Rheumatoid arthritis/collagen vascular disorders | 3,415 (1.66) | 335 (1.78) | 0.5915 |
| Coagulopathy | 73,960 (35.92) | 4,345 (23.07) | < 0.001* |
| Obesity | 21,185 (10.29) | 2,590 (13.75) | < 0.001* |
| Malnutrition | 46,050 (22.37) | 3,090 (16.41) | < 0.001* |
| Fluid and electrolyte disorders | 108,240 (52.57) | 8,375 (44.47) | < 0.001* |
| Blood loss anemia | 4,650 (2.26) | 305 (1.62) | 0.0107* |
| Deficiency anemia | 13,730 (6.67) | 1,265 (6.72) | 0.9107 |
| Alcohol abuse | 60,010 (29.15) | 3,545 (18.82) | < 0.001* |
| Drug abuse | 14,605 (7.09) | 860 (4.57) | < 0.001* |
| Psychoses | 2,655 (1.29) | 180 (0.96) | 0.0886 |
| Depression | 21,365 (10.38) | 2,195 (11.65) | 0.0165* |
| Hypertension, complicated | 44,695 (21.71) | 6,480 (34.4) | < 0.001* |
| No aspirin use, n (%) | Aspirin use, n (%) | P value | |
|---|---|---|---|
| *P < 0.05. NASH: non-alcoholic steatohepatitis; SBP: spontaneous bacterial peritonitis. | |||
| Etiology of liver disease | |||
| Alcohol-related liver disease | 48,900 (23.75) | 2,725 (14.47) | < 0.001* |
| NASH | 16,735 (8.13) | 1,755 (9.32) | 0.01* |
| Hepatitis B | 13,865 (6.73) | 840 (4.46) | < 0.001* |
| Hepatitis C | 83,130 (40.37) | 6,055 (32.15) | < 0.001* |
| Decompensations | |||
| Hepatic encephalopathy | 60,030 (29.15) | 3,620 (19.22) | < 0.001* |
| Ascites | 86,610 (42.06) | 5,210 (27.66) | < 0.001* |
| Varices | 9,790 (4.76) | 510 (2.71) | < 0.001* |
| SBP | 8,535 (4.15) | 320 (1.70) | < 0.001* |
| Hepatorenal syndrome | 13,390 (6.50) | 490 (2.60) | < 0.001* |
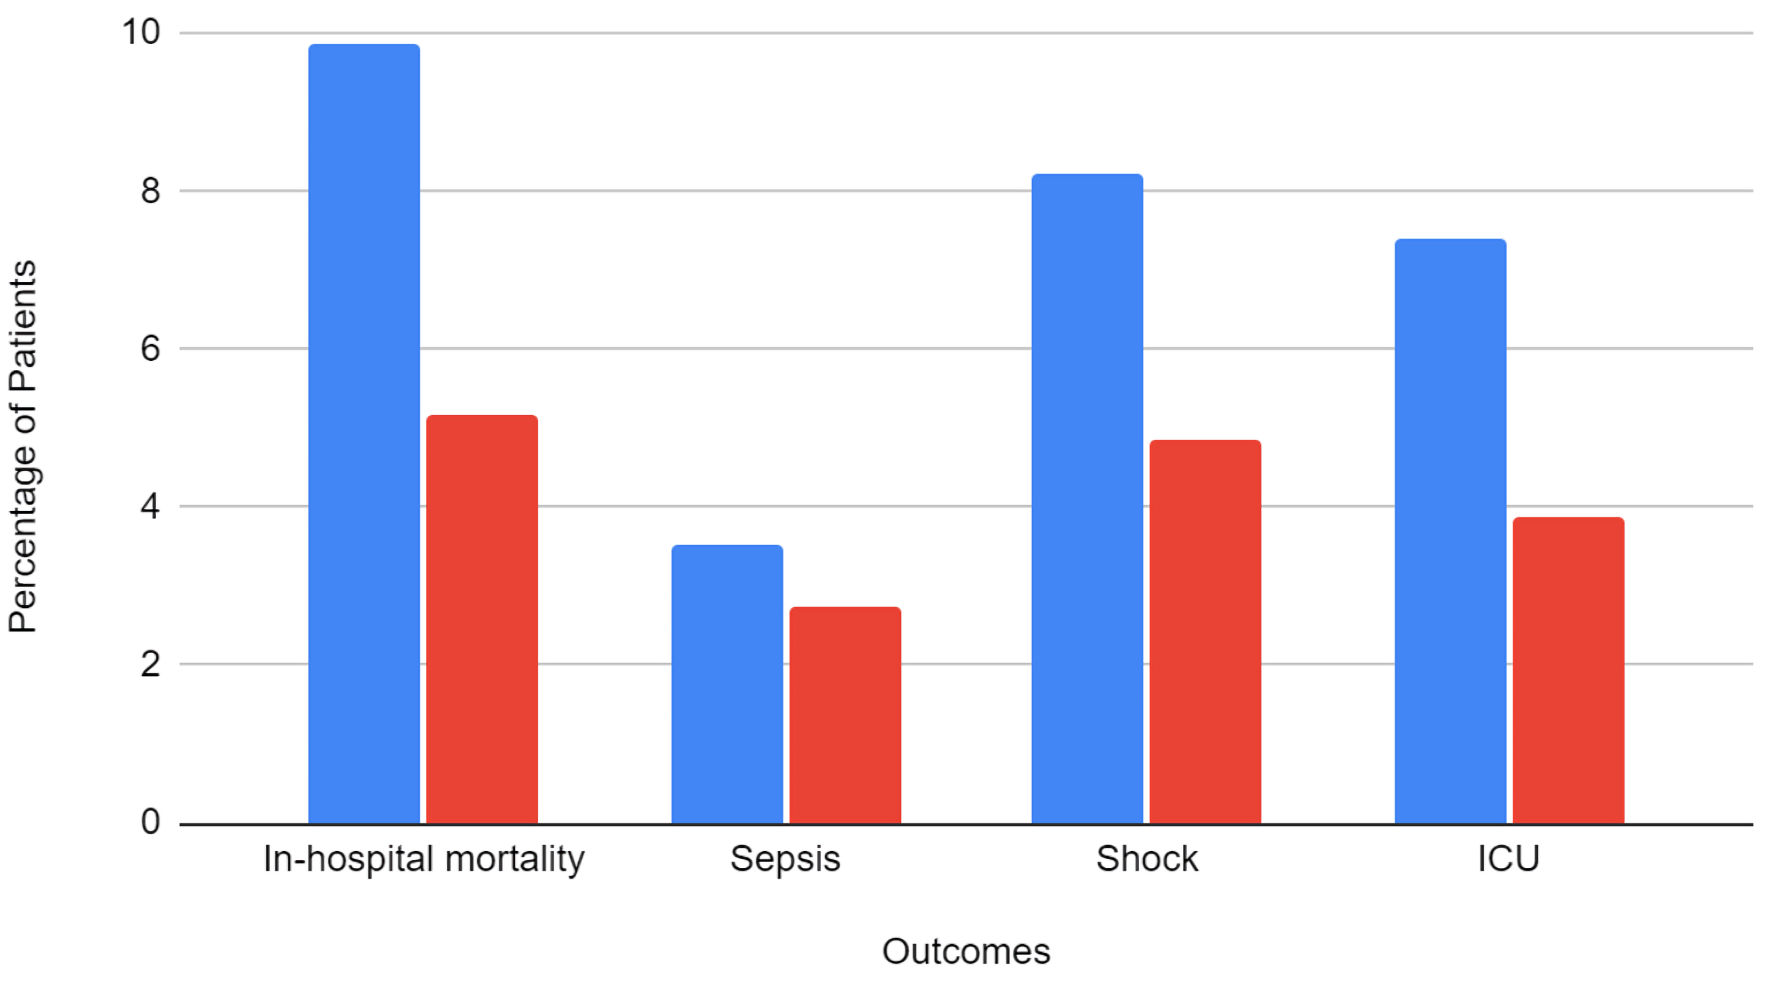
| Odds ratio | 95% confidence interval | P value | |
|---|---|---|---|
| *P < 0.05. AKI: acute kidney injury; ICU: intensive care unit. | |||
| Death | 0.7 | 0.60 - 0.82 | < 0.001* |
| Sepsis | 0.88 | 0.71 - 1.08 | 0.213 |
| Shock | 0.79 | 0.67 - 0.94 | 0.007* |
| AKI | 1.02 | 0.93 - 1.11 | 0.727 |
| ICU | 0.65 | 0.54 - 0.78 | < 0.001* |