Figures
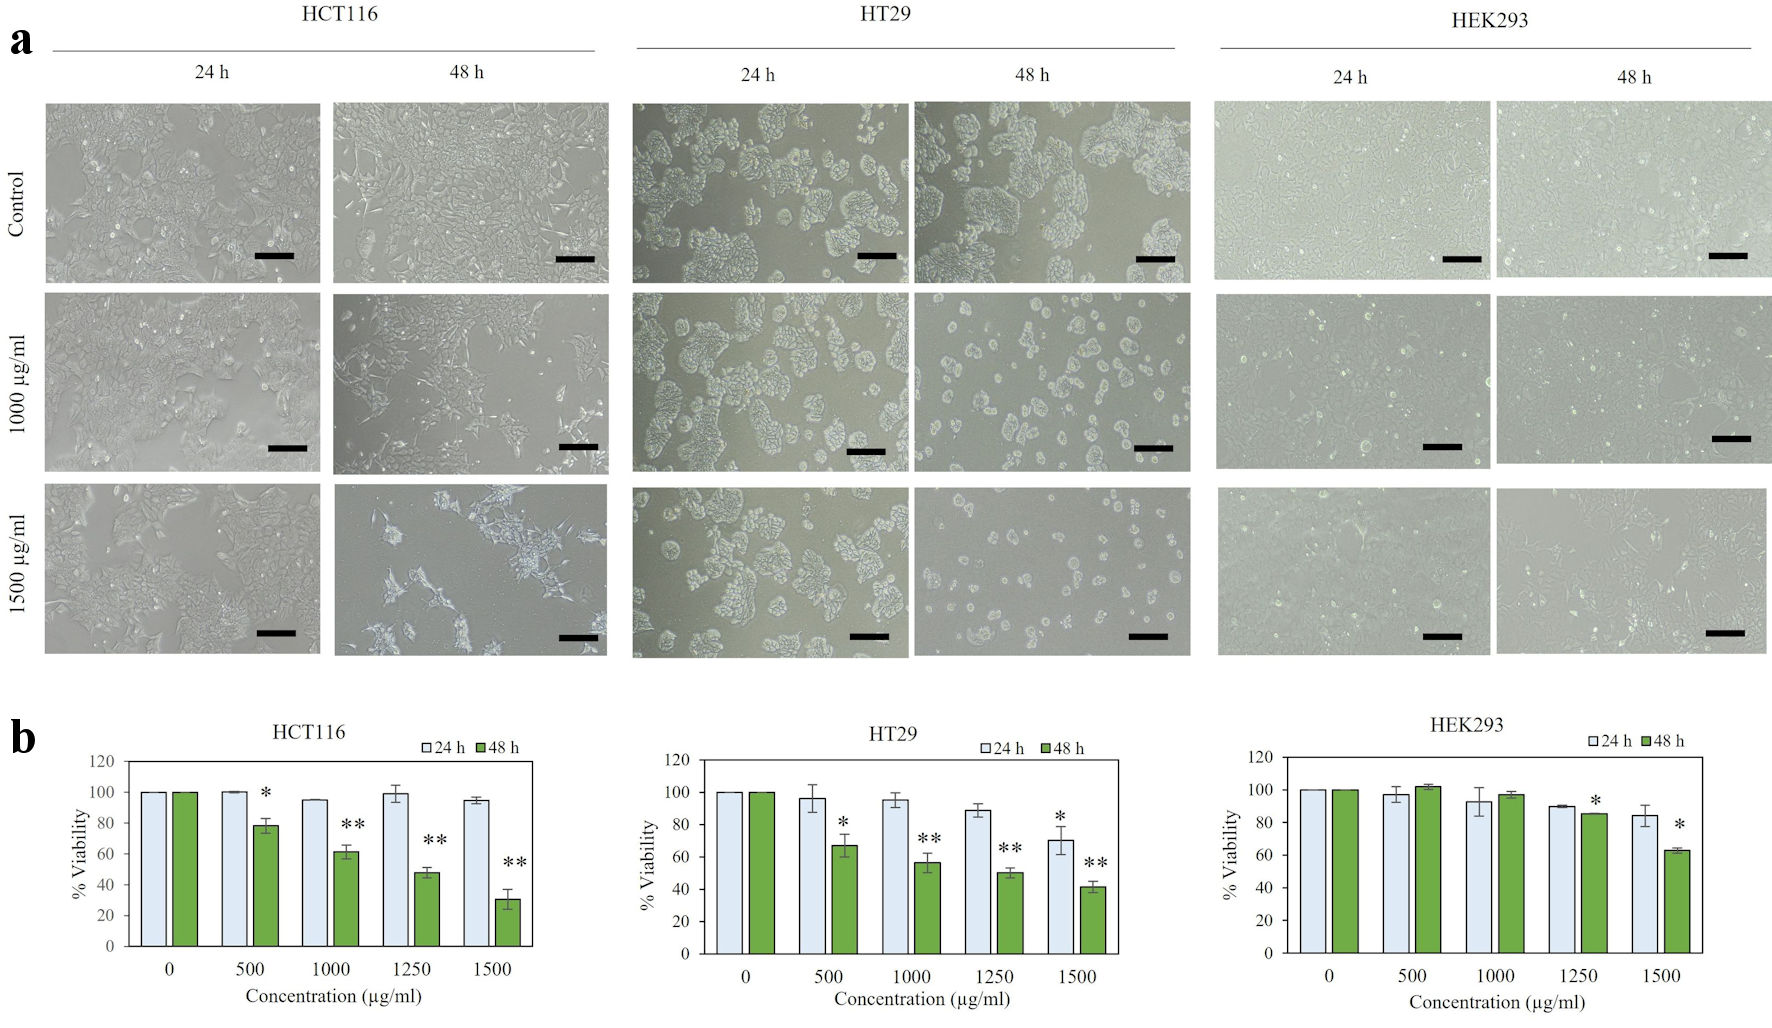
Figure 1. Viability of P. paniceum in HCT116, HT29, and HEK293 cells. (a) Representative images (scale bar = 50 µm) are shown. (b) Cells were treated for 24 and 48 h with P. paniceum, and cell viability was measured using trypan blue exclusion method. Data shown are mean ± SD. *P < 0.05, **P < 0.01, significantly different from control (untreated group). P. paniceum: Pogonatherum paniceum; SD: standard deviation.
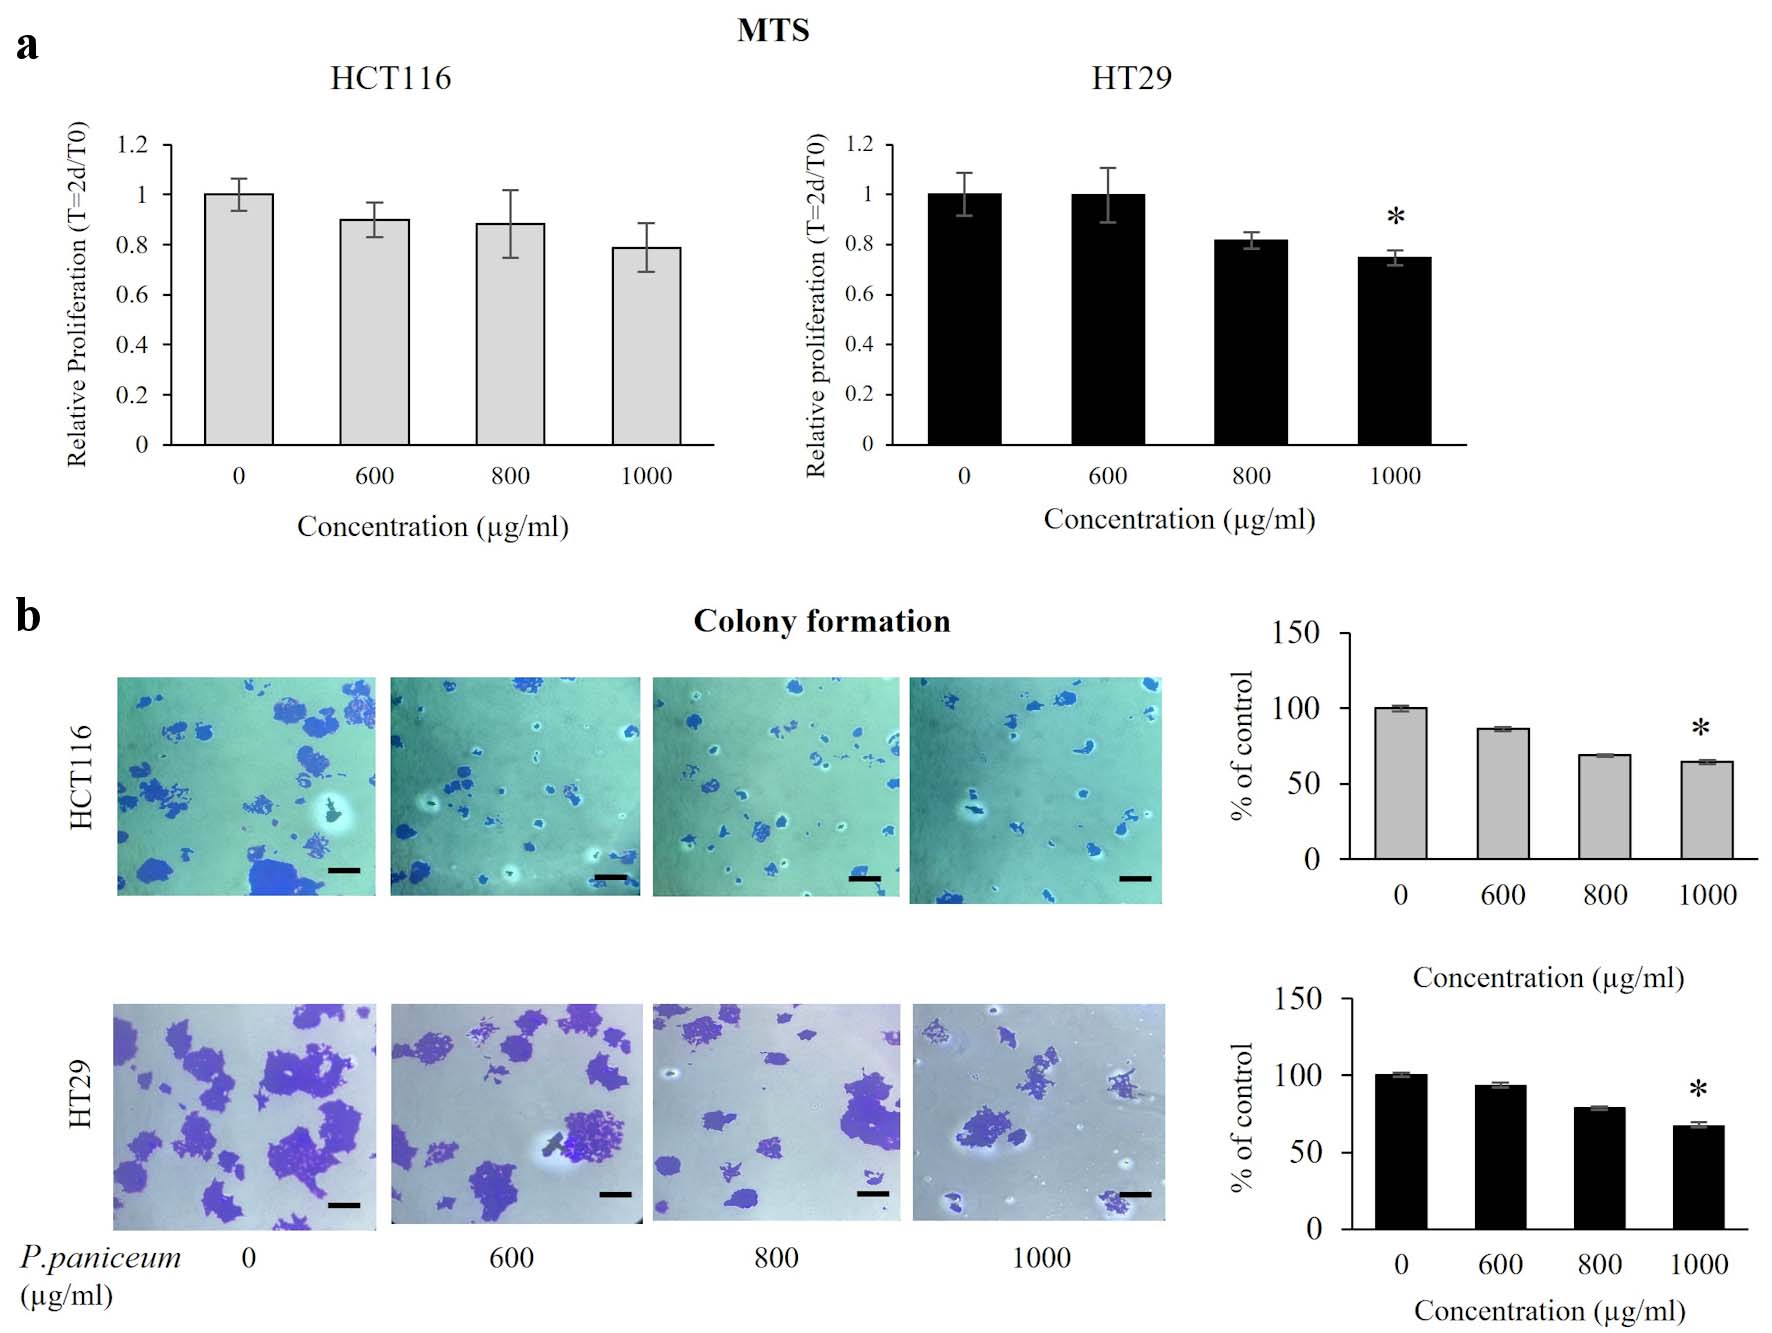
Figure 2. Proliferation and clonogenic property of HCT116 and HT29 cancer cells. (a) Cells were treated with varying doses of P. paniceum for 48 h, and proliferation was measured using MTS assay. (b) The anticolony formation activity of P. paniceum (48 h). The scale bar is 50 µm with magnification (× 20). The data shown are mean value ± SD. *P < 0.05, significantly different from control (untreated group). MTS: 3-(4,5-dimethylthiazol-2-yl)-5-(3-carboxymethoxyphenyl)-2-(4-sulfophenyl)-2H-tetrazolium; P. paniceum: Pogonatherum paniceum; SD: standard deviation.
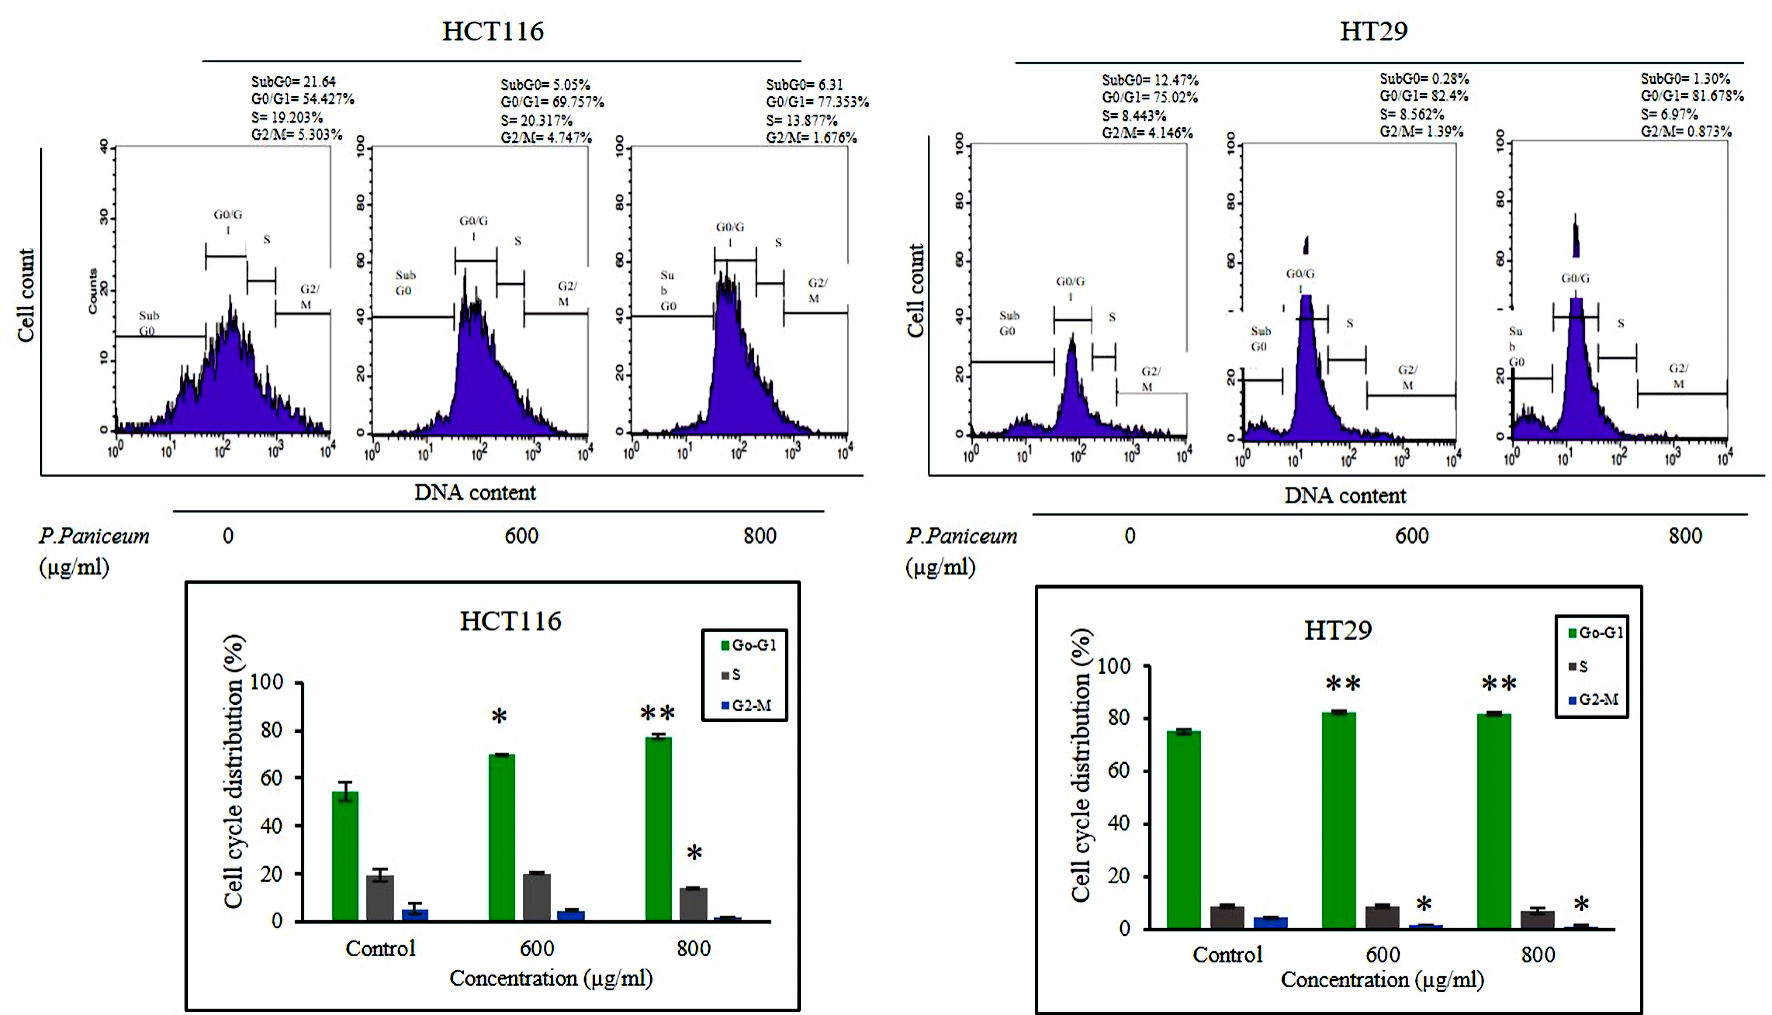
Figure 3. P. paniceum induced G0 - G1 cell cycle arrest of HCT116 and HT29 cancer cells. Cells were treated for 48 h with P. paniceum, and flow cytometry was used to determine the cell cycle distribution. All data are expressed as the mean ± SD. *P < 0.05, **P < 0.01 compared to the control. P. paniceum: Pogonatherum paniceum; SD: standard deviation.
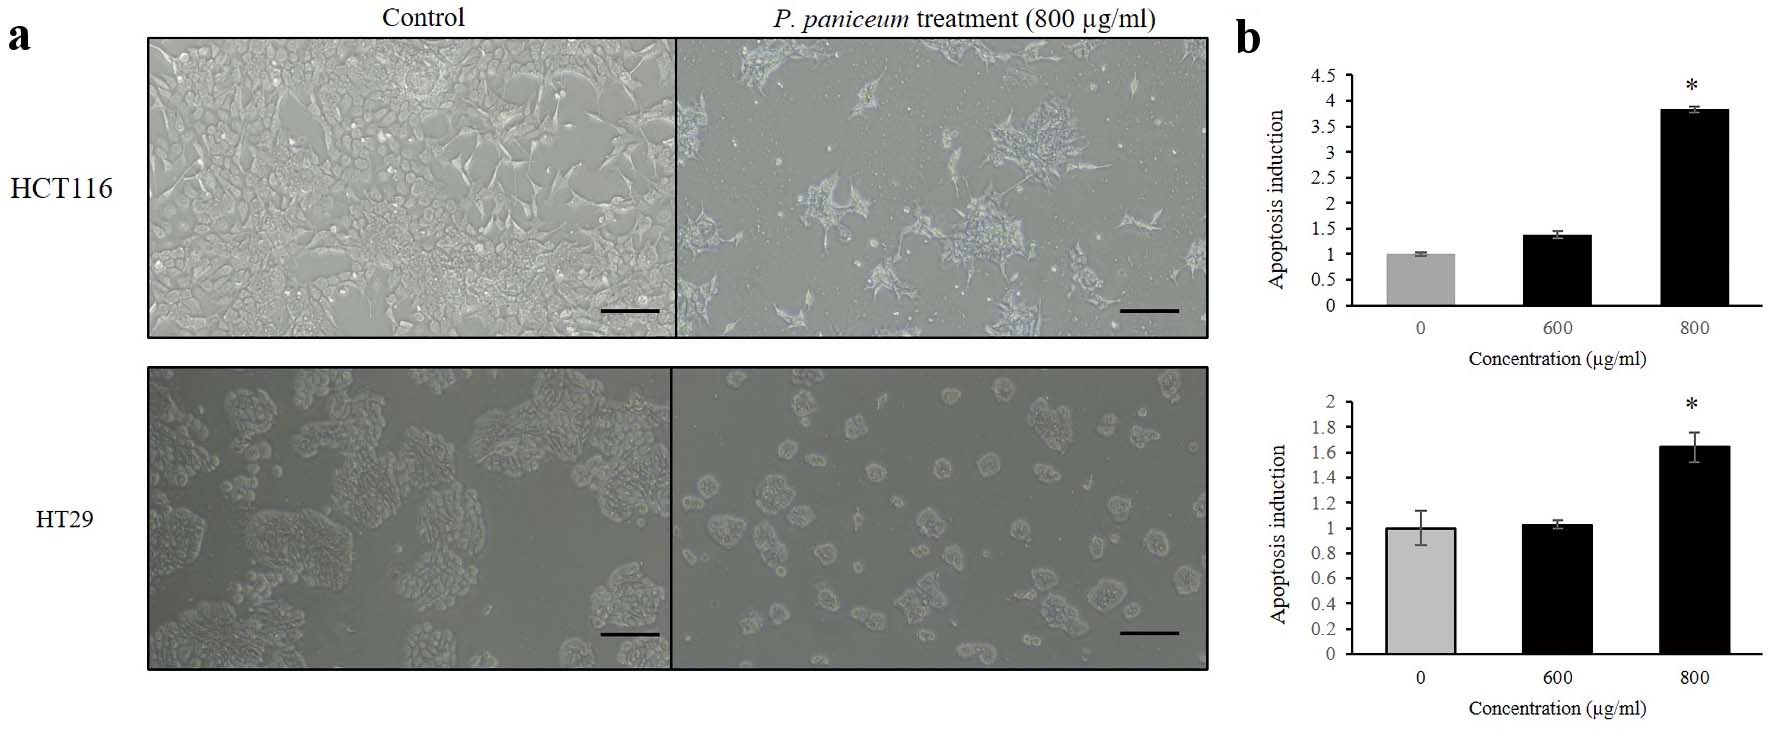
Figure 4. Apoptosis induction of HCT116 and HT29 cancer cells. (a) Cells were treated for 48 h with P. paniceum, and (b) apoptosis induction was measured using cell death detection ELISA (scale bar = 50 µm). The data shown are the mean value ± SD. *P < 0.05, significantly different from control (untreated group). P. paniceum: Pogonatherum paniceum; SD: standard deviation; ELISA: enzyme-linked immunoassay.
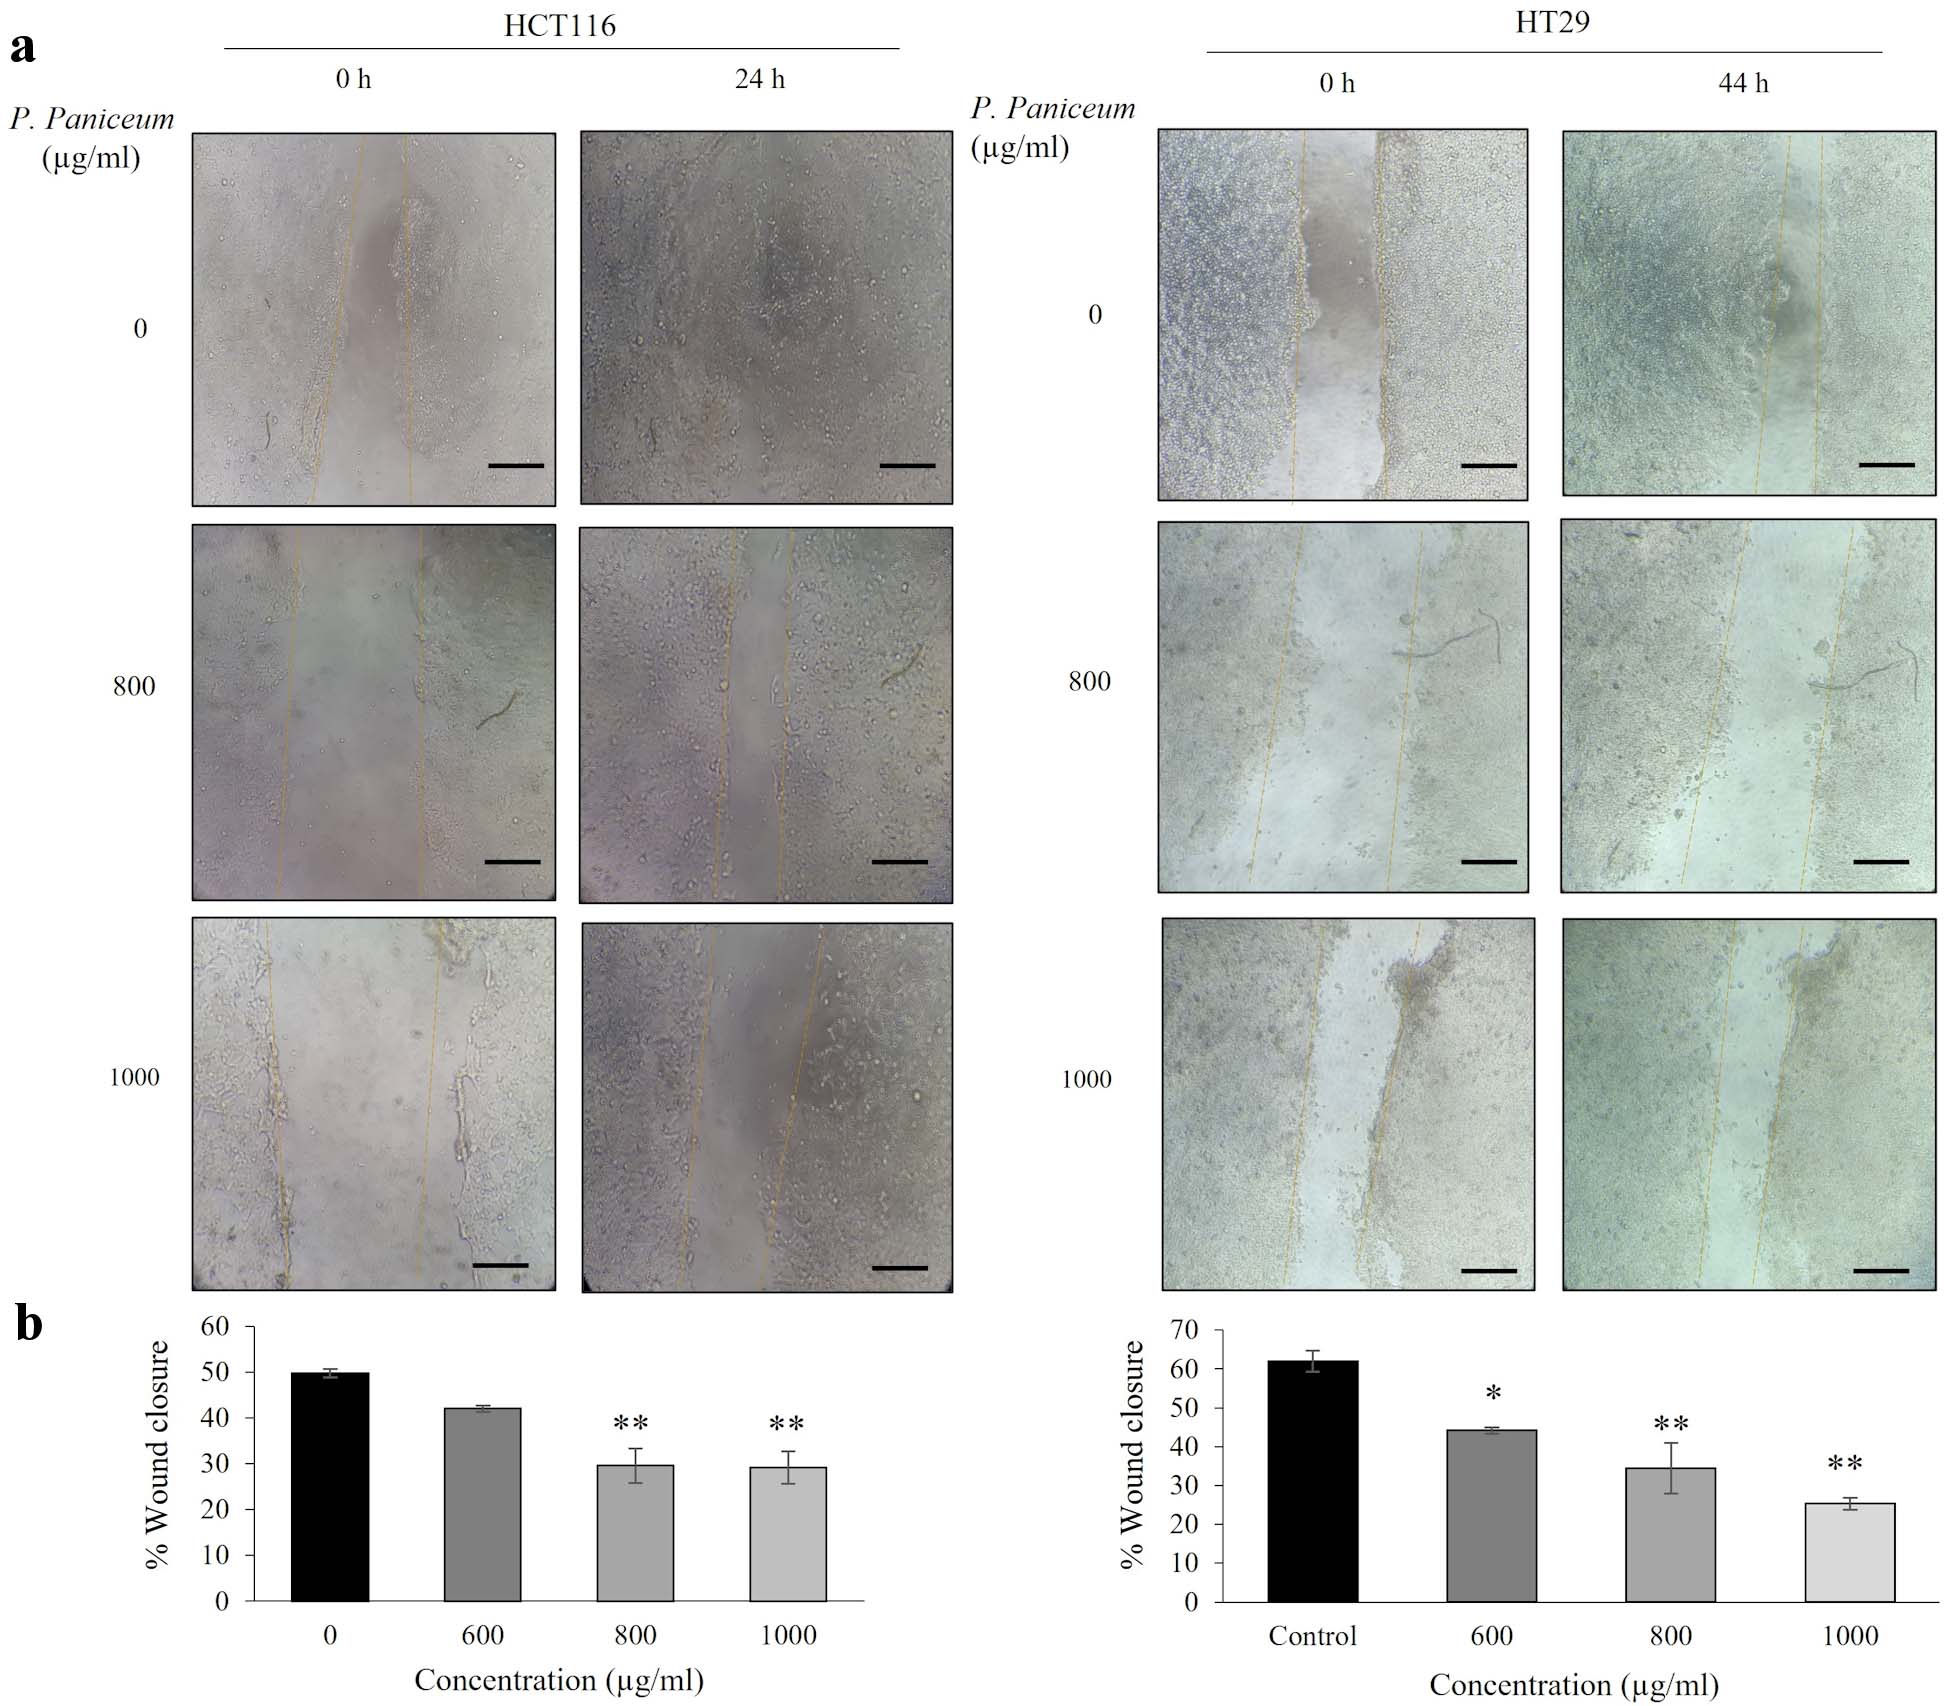
Figure 5. Migration of HCT116 and HT29 cancer cells following P. paniceum incubation for 24 and 44 h. (a) The photograph of migrating cells shown at magnification × 20 (scale bar = 50 µm). (b) The migration ability indicated as the percentage of wound healing. *P < 0.05, **P < 0.01 compared to the control. P. paniceum: Pogonatherum paniceum.
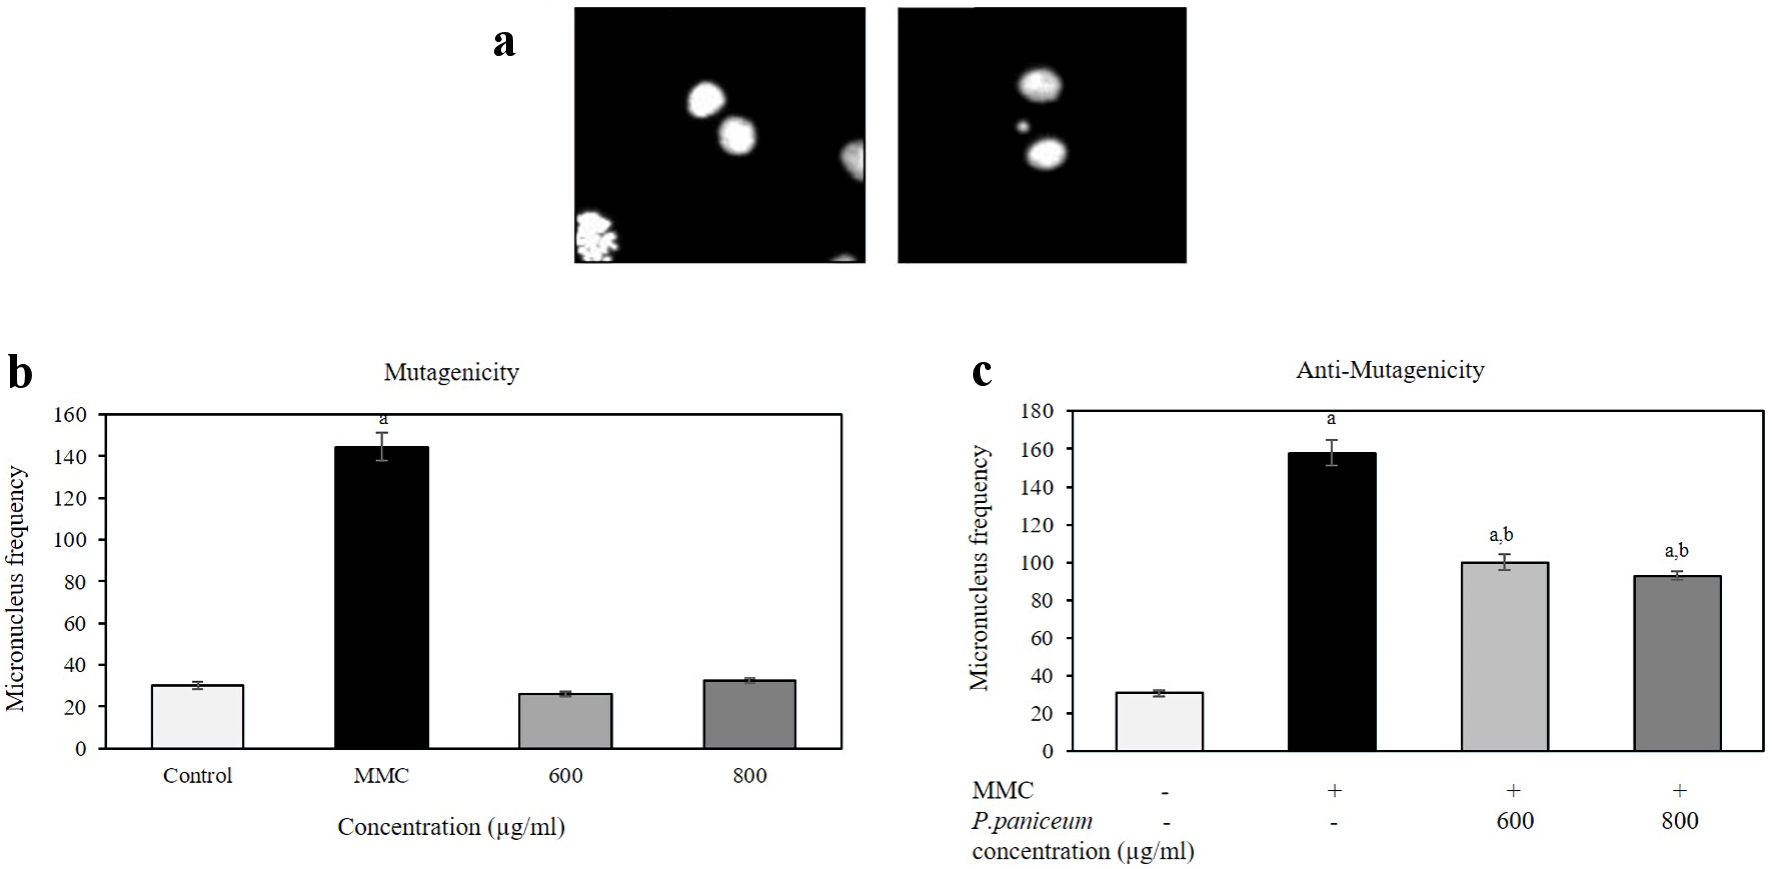
Figure 6. The frequency of micronuclei (MN) in V79 cells after the treatment of P. paniceum for 24 h. (a) Representative images shown binucleated cell (left) and MN in binucleated cell (right). (b) Cells were treated for 24 h with P. paniceum, and MN frequency was scored in 2,000 binucleated cells. (c) Cells were treated for 24 h with P. paniceum combined with mitomycin C ((MMC), 1.25 µg/mL). (a) and (b) significantly different from control (untreated group) and MMC, respectively. P. paniceum: Pogonatherum paniceum.
Tables
Table 1. HPLC Analysis Revealed the Presence of Phenolic Components in Aqueous Extract of P. paniceum
| Polyphenolic compound of P. paniceum (mg/kg) | |
|---|
| HPLC: high performance liquid chromatography; P. paniceum: Pogonatherum paniceum. |
| Tannic acid | 2,014 |
| Gallic acid | 1,101 |
| Rutin | 414.77 |
| Catechin | 308.29 |
| Quercetin | 195.50 |
Table 2. The Cytokinesis-Block Proliferation Index (CBPI) in V79 Cells After the Treatments With P. paniceum and P. paniceum Combination With MMC
| Treatments (µg/mL) | CBPI (mean ± SD) |
|---|
| P. paniceum | P. paniceum + MMC |
|---|
| aNot significant compared to negative control (P > 0.05). P. paniceum: Pogonatherum paniceum; MMC: mitomycin C. |
| Negative control | 1.13 ± 0.02 | 1.13 ± 0.02 |
| 600 | 1.15 ± 0.03a | 1.15 ± 0.03a |
| 800 | 1.13 ± 0.01a | 1.13 ± 0.01a |
| Positive control | 1.07 ± 0.04a | 1.07 ± 0.03a |