Figures
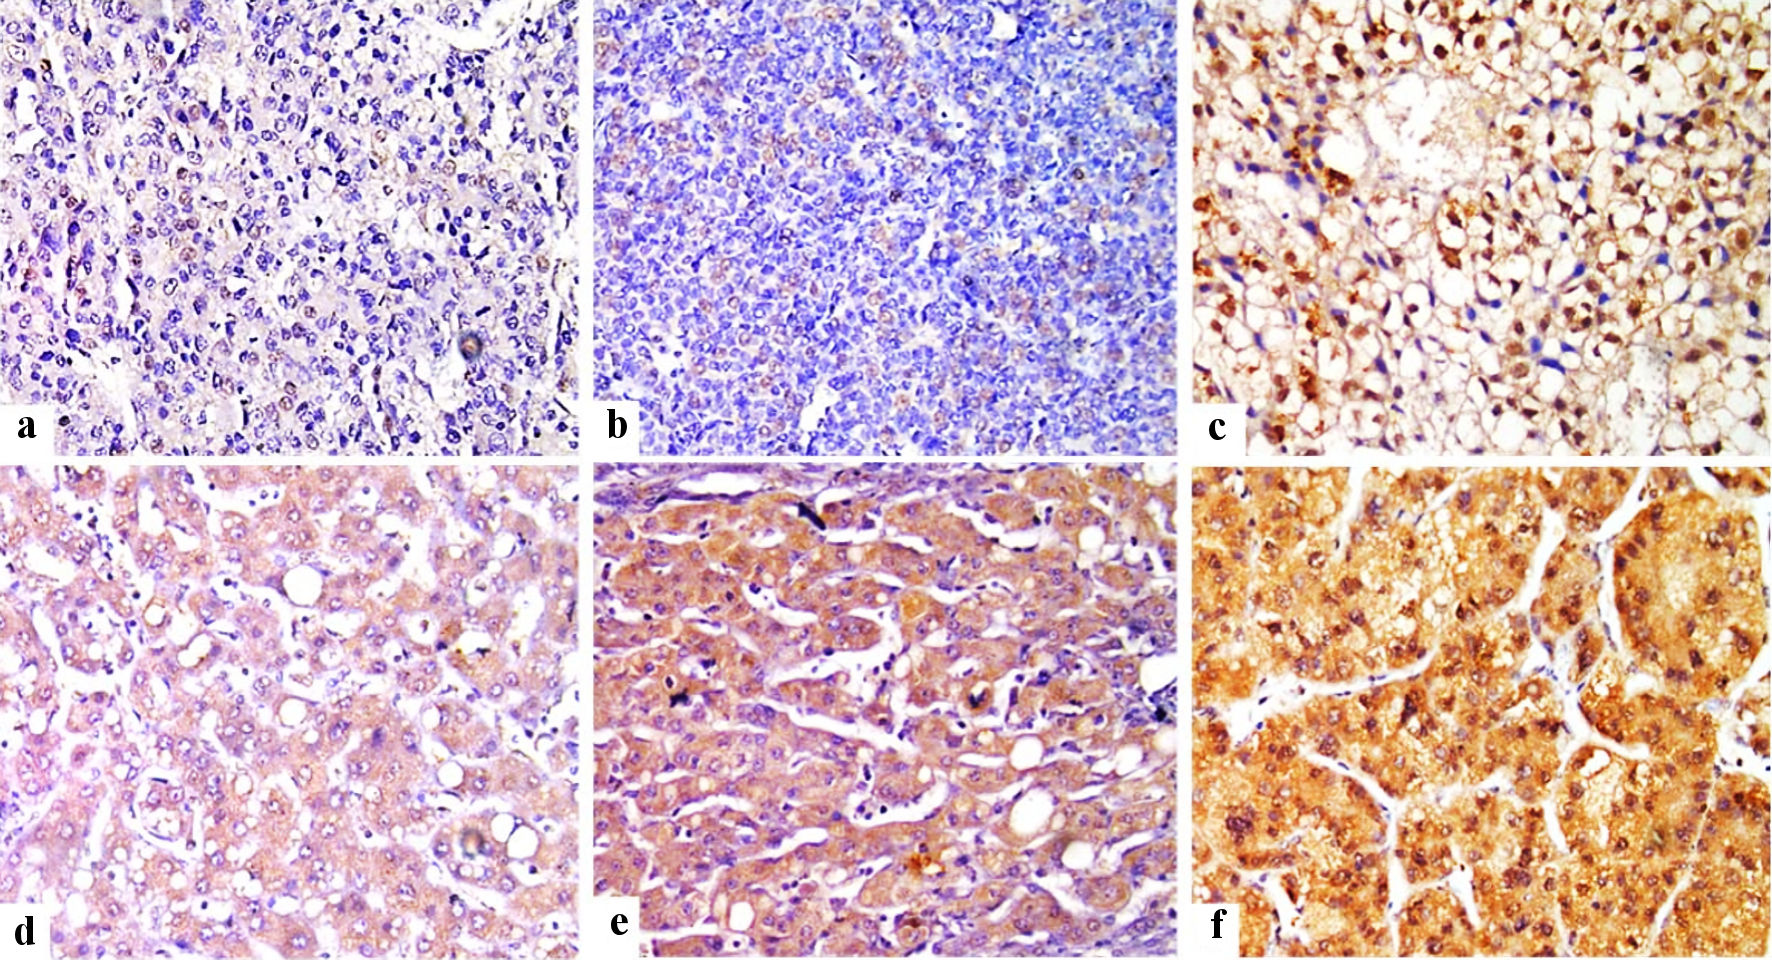
Figure 1. Immunohistochemical staining of FOSL1 in HCC tumor tissues (× 400) showed weak nuclear expression for FOSL1 (a), moderate nuclear expression (b), strong nuclear expression for FOSL1 (c), weak cytoplasmic expression for FOSL1 (d), moderate cytoplasmic expression (e), and strong cytoplasmic expression for FOSL1 (f). FOSL1: FOS-like antigen 1; HCC: hepatocellular carcinoma.
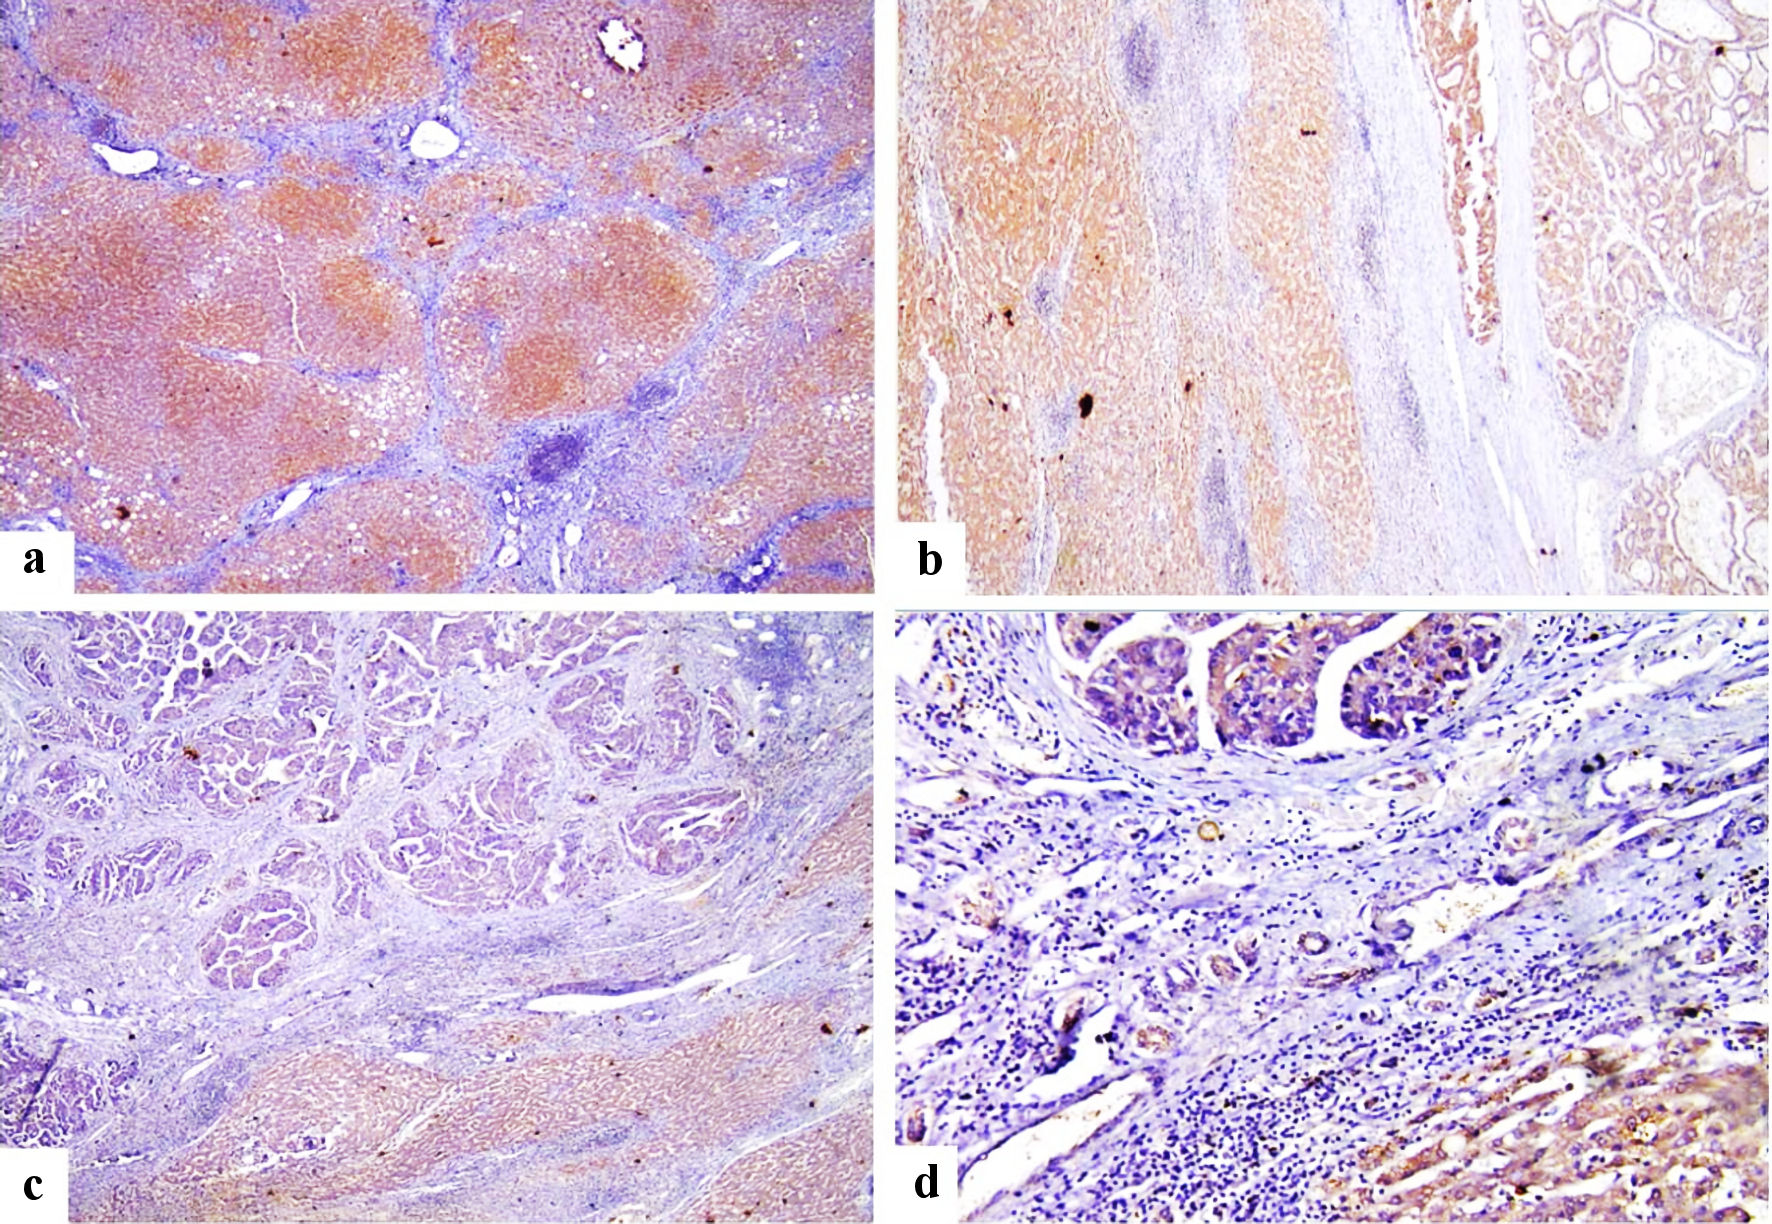
Figure 2. Immunohistochemical staining of FOSL1 showed strong cytoplasmic expression for FOSL1 in liver cirrhosis (a) (× 100 power magnification), strong cytoplasmic expression for FOSL1 for both liver cirrhosis and HCC (b) (× 100 power magnification), strong cytoplasmic expression for FOSL1 at liver cirrhosis and weak cytoplasmic expression for FOSL1 at HCC (c, d) (× 100 and × 200 power magnification). FOSL1: FOS-like antigen 1; HCC: hepatocellular carcinoma.
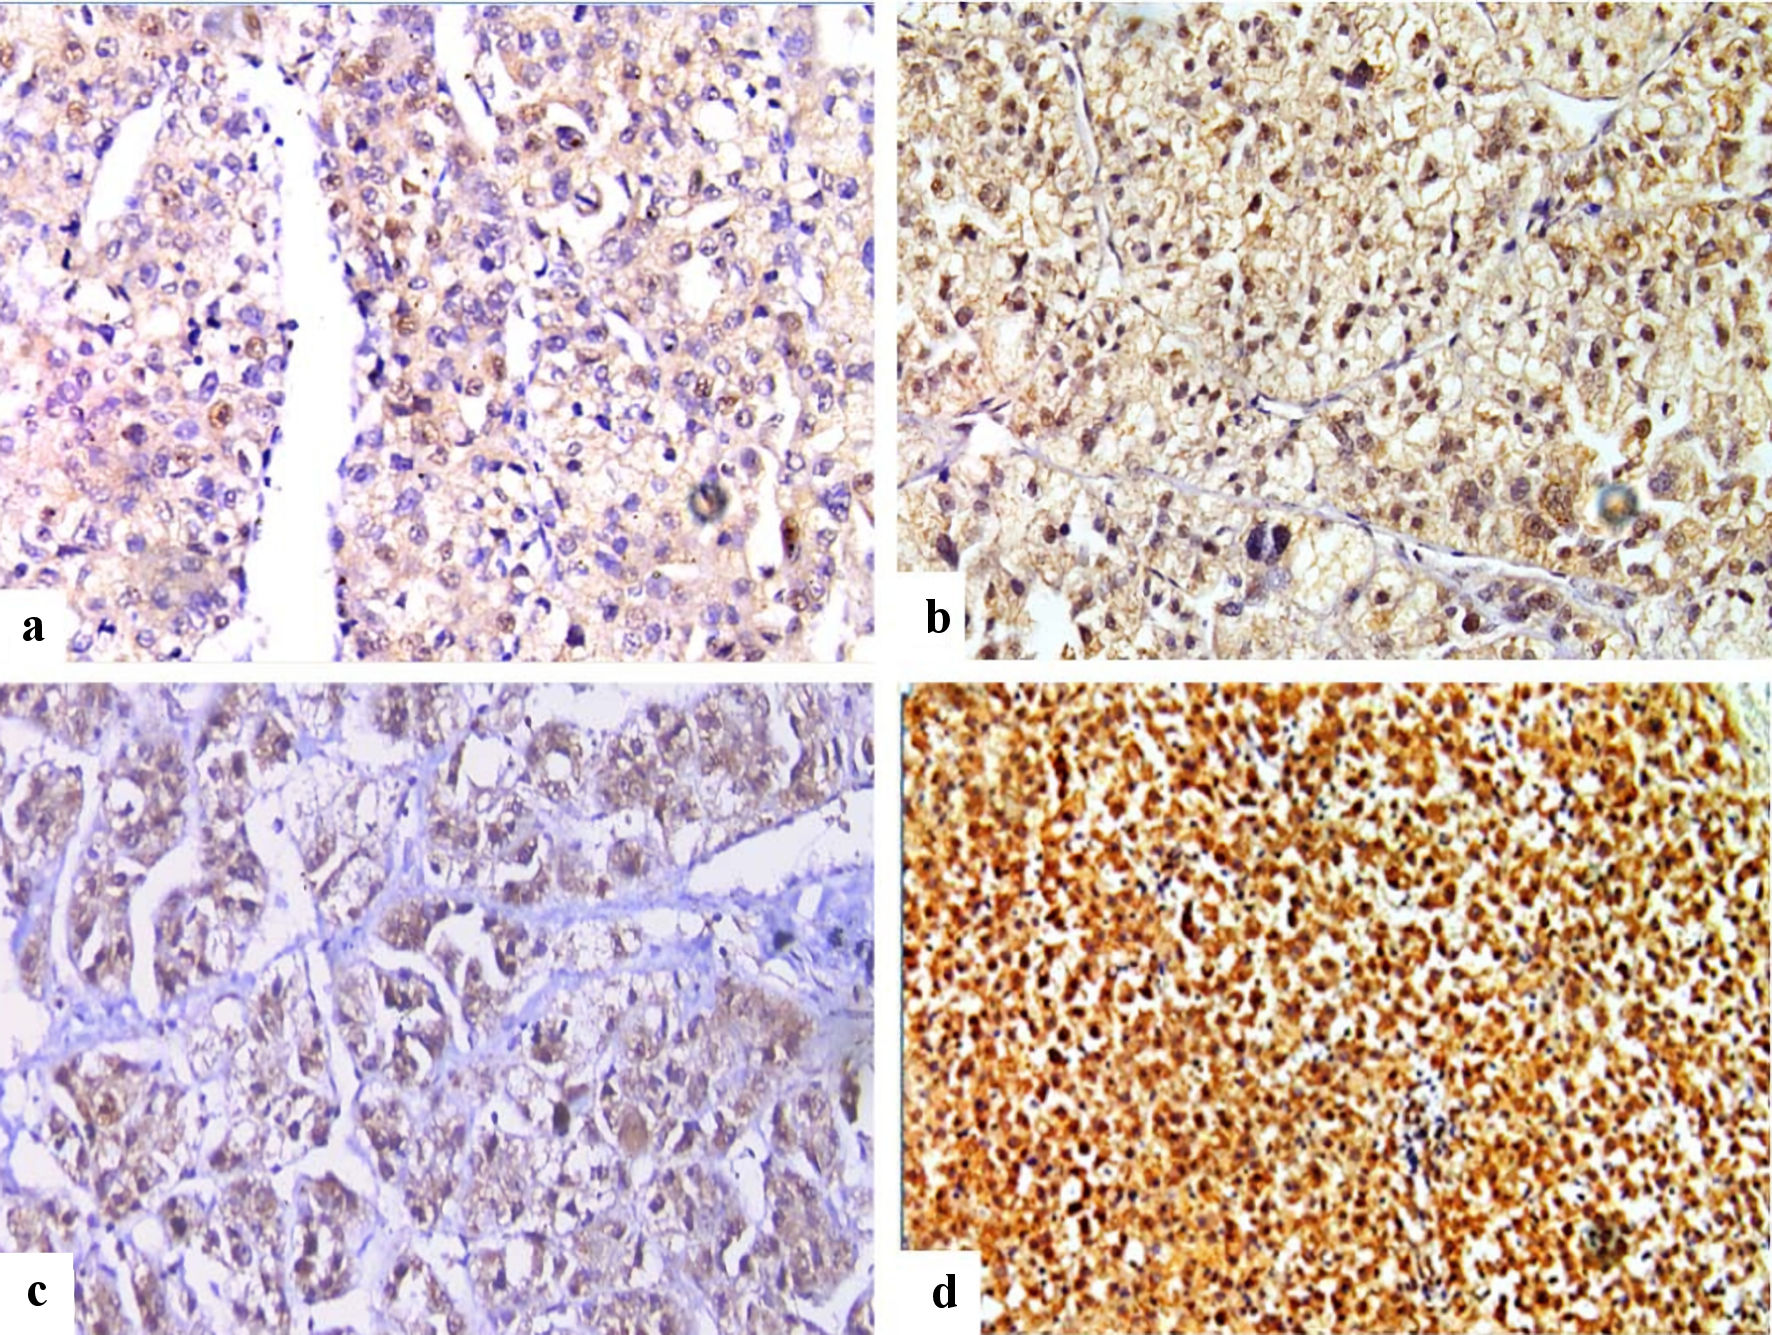
Figure 3. Immunohistochemical staining of FOSL1 in HCC (× 400), showed combined weak cytoplasmic and moderate nuclear expression for FOSL1 (a), combined moderate cytoplasmic and strong nuclear expression (b), combined moderate cytoplasmic and weak nuclear expression (c), and combined strong cytoplasmic expression and strong nuclear expression for FOSL1 (d). FOSL1: FOS-like antigen 1; HCC: hepatocellular carcinoma.
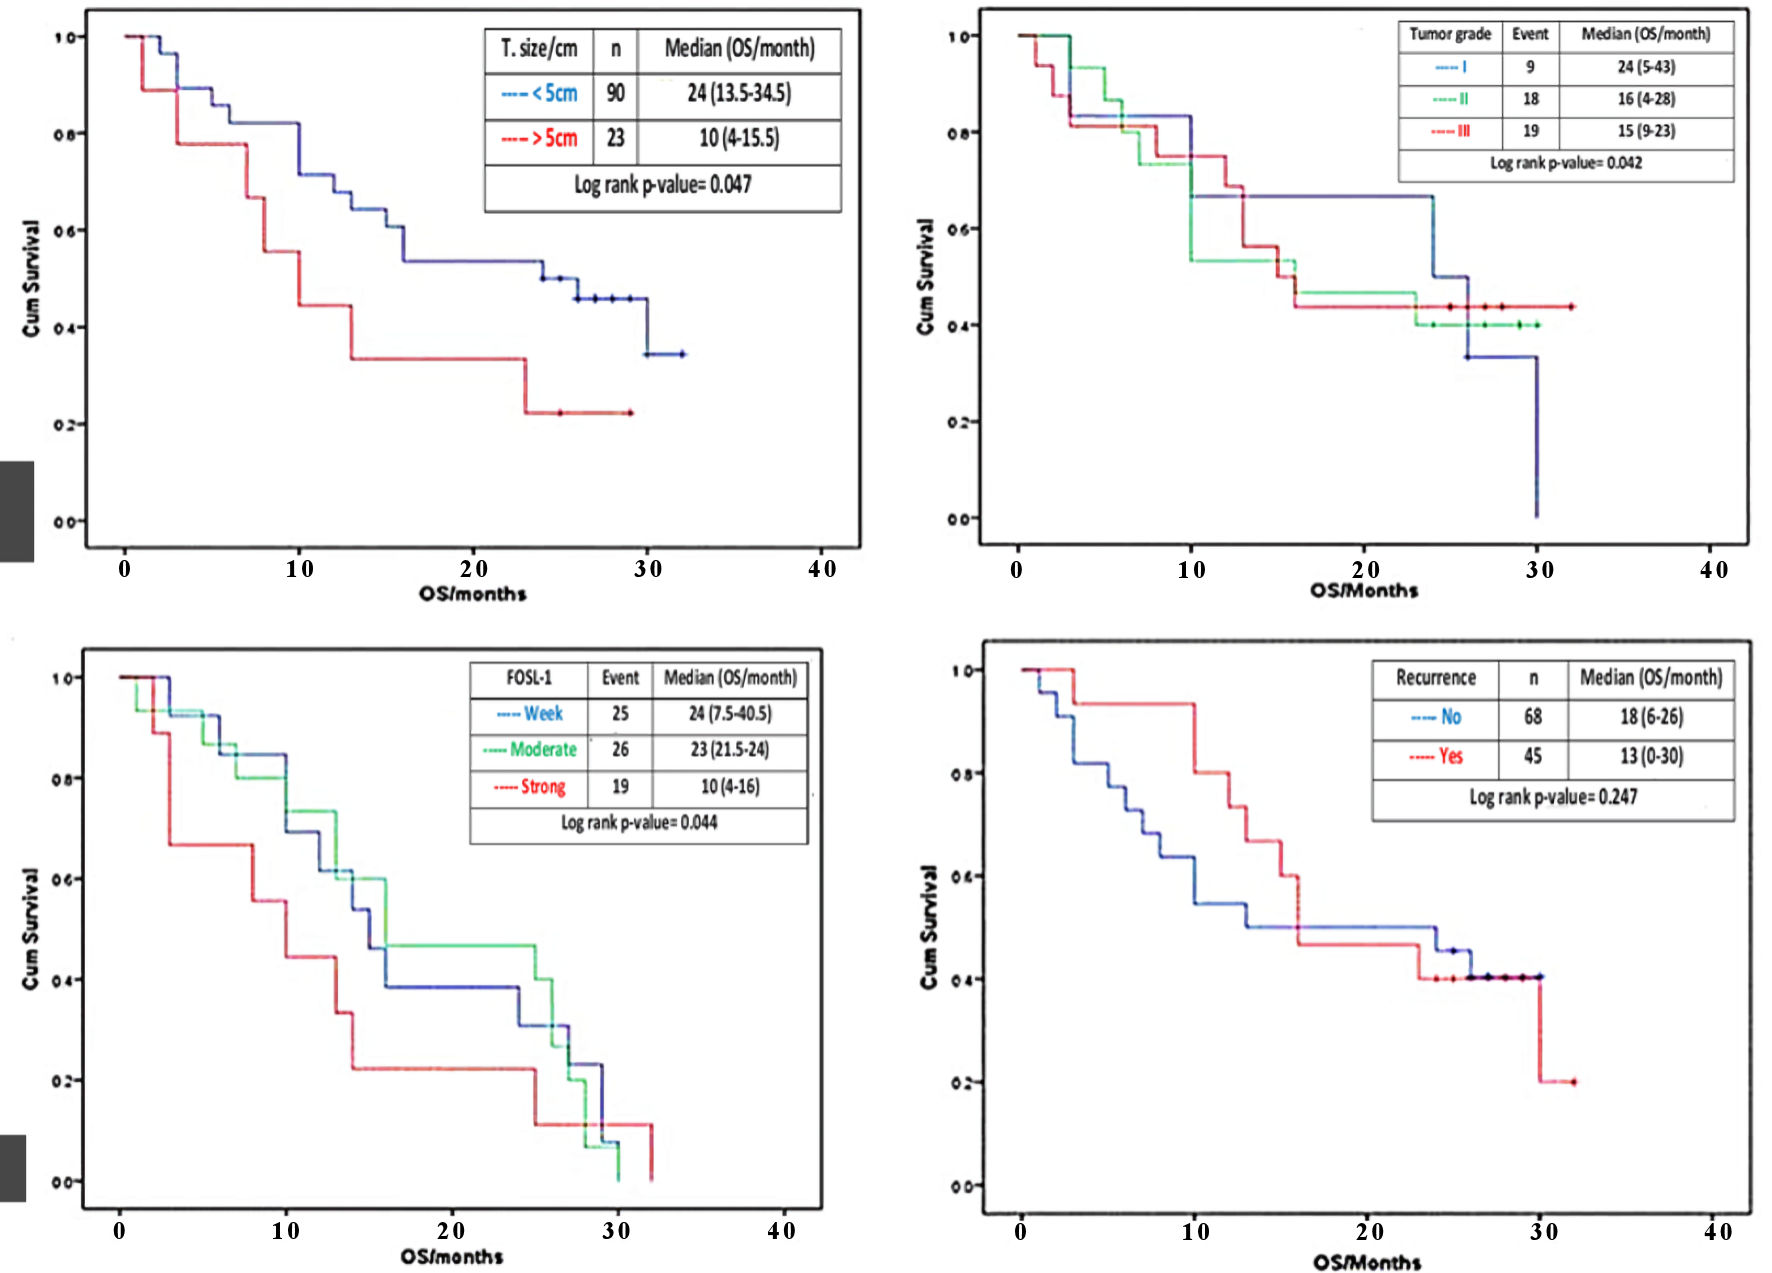
Figure 4. Effect of tumor size, histologic grade, FOSL1 expression and tumor recurrence on OS. Kaplan-Meier survival curves for the cumulative (cum) OS according to the log rank test. The OS rate of the HCC patients with tumor size > 5 cm (red line) was significantly lower than that of the patients with tumor size < 5 cm (blue line) (a). The OS rate of the HCC patients with histological grade II and III (red and green lines) were significantly lower than that of the patients with histological grade I (blue line) (b). The OS rate of the HCC patients with strong FOSL1 expression (red line) was significantly lower than that of the patients with moderate or weak FOSL1 expression (green and blue line) (c). The OS rate of the HCC patients with recurrence (red line) and with no recurrence (blue line) (d). FOSL1: FOS-like antigen 1; HCC: hepatocellular carcinoma; OS: overall survival.
Tables
Table 1. Baseline Demographic, Clinical and Characteristics of the Studied Cohort
| Variable | Category | N = 113 |
|---|
| TTT: treatment; AFP: alpha-fetoprotein; SD: standard deviation; HCC: hepatocellular carcinoma. |
| Age/years | Mean ± SD | 57.73 ± 7.3 |
| Median (range) | 56 (47 - 74) |
| Sex | Female | 26 (23.1%) |
| Male | 87 (76.9%) |
| Hepatitis infection | No | 19 (16.8%) |
| HBV | 7 (6.3%) |
| HCV | 87 (76.9%) |
| | |
| History of antiviral TTT | No | 8 (7.2%) |
| Yes | 18 (15.9%) |
| Unknown | 87 (76.9%) |
| HCC grade | Grade I | 20 (17.7%) |
| Grade II | 45 (39.8%) |
| Grade III | 48 (42.5%) |
| AFP (ng/mL) | Mean ± SD | 1,505.89 ± 391.3 |
| Median (range) | 116 (9 - 1,886) |
Table 2. Tumor-Related Factors Among the Studied Cohort
| Variable | Category | N = 113 |
|---|
| SD: standard deviation; LVE: lymphovascular embolization. |
| Tumor size (cm) | Mean ± SD | 3.35 ± 1.9 |
| Median (range) | 2.3 (1.5 - 8.2) |
| Tumor budding | Low | 39 (34.5%) |
| High | 74 (65.5%) |
| LVE | Positive | 72 (63.7%) |
| Necrosis | Positive | 30 (26.5%) |
| Recurrence | Yes | 45 (39.8%) |
| Mortality | Yes | 69 (61.1%) |
Table 3. Correlation Between FOSL1 Nuclear Expression and Clinicopathologic Features
| Correlate | H score (n) | P value | HR (95% CI) | P value |
|---|
| Low (n = 58) | High (n = 55) |
|---|
| *P < 0.05. AFP: alpha-fetoprotein; FOSL1: FOS-like antigen 1; LC: liver cirrhosis; HBV: hepatitis B virus; HCV: hepatitis C virus; LVE: lymphovascular embolization; HR: hazard ratio; CI: confidence interval; FOSL1 (C): FOSL1 cytoplasmic expression. |
| Age/year | | | | | |
| < 50 years | 10 (15.8%) | 14 (22.2%) | 0.288 | 1 | |
| > 50 years | 48 (84.2%) | 41 (77.8%) | | 0.66 (0.13 - 3.45) | 0.619 |
| Sex | | | | | |
| Female | 10 (15.8%) | 16 (27.8%) | 0.215 | 1 | |
| Male | 48 (84.2%) | 39 (72.2%) | | 0.49 (0.10 - 2.43) | 0.381 |
| Tumor size | | | | | |
| < 5 cm | 45 (78.9%) | 39 (27.8%) | 0.267 | 1 | |
| > 5 cm | 13 (21.1%) | 16 (27.8%) | | 1.44 (0.32 - 6.53) | 0.635 |
| AFP | | | | | |
| > 200 ng/mL | 24 (42.1%) | 27 (50%) | 0.630 | 1 | |
| < 200 ng/mL | 34 (57.9%) | 28 (50%) | | 0.73 (0.20 - 2.66) | 0.684 |
| Histological grade | | | | | |
| Grade I | 15 (26.3%) | 5 (9.1%) | 0.075 | 1 | |
| Grade II/III | 43 (73.7%) | 50 (90.9%) | | 6.07 (1.01 - 8.22) | 0.038* |
| Hepatitis infection | | | | | |
| No | 6 (10.5%) | 2 (3.6%) | 0.225 | 1 | |
| HCV/HBV | 52 (89.5%) | 53 (96.4%) | | 0.41 (0.07 - 2.59) | 0.344 |
| LC | | | | | |
| Negative | 13 (22.4%) | 9 (16.7%) | 0.246 | 1 | |
| Positive | 45 (77.6%) | 46 (83.3%) | | 1.79 (0.36 - 8.90) | 0.479 |
| LVE | | | | | |
| Negative | 31 (52.6%) | 10 (18.2%) | 0.022* | 1 | |
| Positive | 27 (47.4%) | 45 (81.8%) | | 5.56 (1.20 - 9.71) | 0.028* |
| Necrosis | | | | | |
| Negative | 43 (73.7%) | 40 (72.2%) | 0.605 | 1 | |
| Positive | 15 (26.3%) | 15 (27.8%) | | 1.08 (0.25 - 4.60) | 0.847 |
| Tumor budding | | | | | |
| Low | 31 (52.6%) | 8 (14.5%) | 0.020* | 1 | |
| High | 27 (47.4%) | 47 (85.5%) | | 5.56 (1.20 - 9.71) | 0.026* |
| FOSL1 (C) | | | | | |
| Low | 38 (65.5%) | 11 (20%) | 0.001* | 1 | |
| High | 20 (34.5%) | 44 (80%) | | 18.0 (1.96 - 34.9) | 0.011* |
| Recurrence | | | | | |
| No | 37 (63.2%) | 31 (55.6%) | 0.235 | 1 | |
| Yes | 21 (36.8%) | 24 (44.4%) | | 1.38 (0.37 - 5.19) | 0.630 |
| Mortality | | | | | |
| Alive | 22 (36.8%) | 22 (40%) | 0.898 | 1 | |
| Dead | 36 (63.2%) | 33 (60%) | | 0.92 (0.24 - 3.46) | 0.904 |
Table 4. Correlation Between FOSL1 Cytoplasmic Expression and Clinicopathologic Features
| Correlate | H score (n) | P value | HR (95% CI) | P value |
|---|
| Low (n = 58) | High (n = 55) |
|---|
| *P < 0.05. AFP: alpha-fetoprotein; FOSL1: FOS-like antigen 1; LC: liver cirrhosis; HBV: hepatitis B virus; HCV: hepatitis C virus; LVE: lymphovascular embolization; HR: hazard ratio; CI: confidence interval; FOSL1 (N): FOSL1 nuclear expression. |
| Age/years | | | | | |
| < 50 years | 13 (25%) | 11 (17.2%) | 0.235 | 1 | |
| > 50 years | 36 (75%) | 53 (82.8%) | | 2.01 (0.38 - 9.58) | 0.415 |
| Sex | | | | | |
| Female | 10 (18.7%) | 16 (25%) | 0.517 | 1 | |
| Male | 39 (81.3%) | 48 (75%) | | 0.74 (0.15 - 3.69) | 0.712 |
| Tumor size | | | | | |
| < 5 cm | 34 (68.7%) | 50 (78.1%) | 0.210 | 1 | |
| > 5 cm | 15 (31.3%) | 14 (21.9%) | | 0.52 (0.11 - 2.36) | 0.395 |
| AFP | | | | | |
| > 200 ng/mL | 25 (50.1%) | 26 (40.6%) | 0.460 | 1 | |
| < 200 ng/mL | 24 (49.9%) | 38 (59.4%) | | 1.33 (0.36 - 4.93) | 0.666 |
| Histological grade | | | | | |
| Grade I | 10 (18.7%) | 10 (15.6%) | 0.528 | 1 | |
| Grade II/III | 39 (81.3%) | 54 (84.4%) | | 1.39 (0.24 - 7.99) | 0.716 |
| Hepatitis infection | | | | | |
| No | 2 (4.1%) | 6 (9.4%) | 0.528 | 1 | |
| HCV/HBV | 47 (95.9%) | 58 (90.6%) | | 1.39 (0.24 - 7.99) | 0.716 |
| LC | | | | | |
| Negative | 13 (25%) | 9 (14.1%) | 0.483 | 1 | |
| Positive | 36 (75%) | 55 (85.9%) | | 1.42 (0.30 - 6.81) | 0.664 |
| LVE | | | | | |
| Negative | 21(42.6%) | 20 (31.2%) | 0.174 | 1 | |
| Positive | 28 (57.1%) | 44 (68.8%) | | 1.94 (0.50 - 7.64) | 0.341 |
| Necrosis | | | | | |
| Negative | 40 (81.6%) | 43 (67.2%) | 0.187 | 1 | |
| Positive | 9 (18.4%) | 21 (32.8%) | | 2.17 (0.46 - 9.20) | 0.328 |
| Tumor budding | | | | | |
| Low | 22 (43.8%) | 17 (26.6%) | 0.174 | 1 | |
| High | 27 (56.2%) | 47 (70.3%) | | 1.94 (0.50 - 7.64) | 0.341 |
| FOSL1 (N) | | | | | |
| Low | 38 (77.6%) | 20 (31.2%) | 0.008* | 1 | |
| High | 11 (22.4%) | 44 (68.8%) | | 0.11 (0.02 - 0.61) | 0.012* |
| Recurrence | | | | | |
| No | 34 (68.8%) | 34 (53.1%) | 0.253 | 1 | |
| Yes | 15 (31.2%) | 30 (48.4%) | | 2.02 (0.51 - 7.80) | 0.318 |
| Mortality | | | | | |
| Alive | 19 (37.5%) | 25 (38.1%) | 0.267 | 1 | |
| Dead | 30 (62.5%) | 39 (61.9%) | | 0.98 (0.26 - 3.73) | 0.970 |
Table 5. Correlation Between Combined (N + C) FOSL1 Expression and Clinicopathological Features
| Correlate | H score (N + C) | P value | HR (95% CI) | P value |
|---|
| Low (n = 27) | High (n = 86) |
|---|
| *P < 0.05. AFP: alpha-fetoprotein; FOSL1: FOS-like antigen 1; LC: liver cirrhosis; HBV: hepatitis B virus; HCV: hepatitis C virus; LVE: lymphovascular embolization; HR: hazard ratios; CI: confidence interval; N + C: nuclear and cytoplasmic expression. |
| Age/years | | | | | |
| < 50 years | 6 (22.2%) | 18 (20.9%) | 0.771 | 1 | |
| > 50 years | 21 (77.8%) | 68 (79.1%) | | 1.31 (0.21 - 8.32) | 0.845 |
| Sex | | | | | |
| Female | 3 (11.1%) | 23 (26.7%) | 0.379 | 1 | |
| Male | 24 (88.9%) | 63 (73.3%) | | 0.38 (0.04 - 3.55) | 0.682 |
| Tumor size | | | | | |
| < 5 cm | 21 (77.8%) | 63 (73.3%) | 0.806 | 1 | |
| > 5 cm | 6 (22.2%) | 23 (26.7%) | | 1.17 (0.96 - 6.89) | 0.784 |
| AFP | | | | | |
| > 200 ng/mL | 12 (44.4%) | 39 (45.3%) | 0.612 | 1 | |
| < 200 ng/mL | 15 (55.6%) | 47 (54.7%) | | 0.92 (0.21 - 4.18) | 0.782 |
| Histological grade | | | | | |
| Grade I | 15 (55.6%) | 5 (5.8%) | 0.028* | 1 | |
| Grade II/III | 12 (44.4%) | 81 (94.2%) | | 1.73 (0.36 - 8.35) | 0.034* |
| Hepatitis infection | | | | | |
| No | 6 (22.2%) | 2 (2.3%) | 0.457 | 1 | |
| HCV/HBV | 21 (77.8%) | 84 (97.7%) | | 1.71 (0.26 - 9.41) | 0.574 |
| LC | | | | | |
| Negative | 9 (33.3%) | 13 (15.1%) | 0.293 | 1 | |
| Positive | 18 (66.7%) | 73 (84.9%) | | 2.31 (0.42 - 8.74) | 0.237 |
| LVE | | | | | |
| Negative | 18 (66.7%) | 23 (26.7%) | 0.023* | 1 | |
| Positive | 9 (33.3%) | 63 (73.3%) | | 6.01 (1.18 - 14.58) | 0.031* |
| Necrosis | | | | | |
| Negative | 21 (77.8%) | 62 (72.1%) | 0.537 | 1 | |
| Positive | 6 (22.2%) | 24 (27.9%) | | 1.41 (0.24 - 8.24) | 0.709 |
| Bile duct proliferation | | | | | |
| Mild/moderate | 18 (66.7%) | 61 (70.9%) | 0.546 | 1 | |
| Severe | 9 (33.3%) | 25 (29.1%) | | 0.81 (0.16 - 4.01) | 0.765 |
| Tumor budding | | | | | |
| Low | 15 (55.6%) | 24 (27.9%) | 0.040* | 1 | |
| High | 12 (44.4%) | 62 (72.1%) | | 3.17 (1.05 - 9.72) | 0.046* |
| Recurrence | | | | | |
| No | 21 (77.8%) | 47 (54.7%) | 0.186 | 1 | |
| Yes | 6 (22.2%) | 39 (45.3%) | | 3.03 (0.53 - 7.25) | 0.120 |
| Mortality | | | | | |
| Alive | 21 (77.8%) | 23 (26.7%) | 0.034* | 1 | |
| Dead | 6 (22.2%) | 64 (73.3%) | | 1.44 (0.31 - 6.62) | 0.035* |
Table 6. Correlation Between Clinicopathologic Features and Overall Survival Rate
| Predictor | SR% | P value | HR (95% CI) | P value |
|---|
| *P < 0.05. SR%: survival rate percentages; HR: hazard ratio; 95% CI: 95% confidence intervals for risk of all causes; AFP: alpha-fetoprotein; LC: liver cirrhosis; HBV: hepatitis B virus; HCV: hepatitis C virus; LVE: lymphovascular embolization; FOSL1: FOS-like antigen 1. |
| Age/years | | | | |
| < 50 years | 42.9% | 0.313 | 1 | |
| > 50 years | 36.7% | | 1.468 (0.498 - 4.329) | 0.428 |
| Sex | | | | |
| Female | 62.5% | 0.092 | 1 | |
| Male | 31% | | 2.384 (0.707 - 8.034) | 0.161 |
| Tumor size | | | | |
| < 5 cm | 42.9% | 0.034* | 1 | |
| > 5 cm | 22.2% | | 2.078 (1.041 - 5.138) | 0.043* |
| AFP | | | | |
| > 200 ng/mL | 35.3% | 0.255 | 1 | |
| < 200 ng/mL | 40% | | 0.889 (0.391 - 2.022) | 0.779 |
| Histological grade | | | | |
| Grade I | 41.9% | 0.041* | 1 | |
| Grade II/III | 16.7% | | 3.621 (1.077 - 6.118) | 0.046* |
| Hepatitis infection | | | | |
| No | 33.3% | 0.593 | 1 | |
| HCV/HBV | 38.7% | | 0.730 (0.246 - 2.163) | 0.570 |
| LC | | | | |
| Negative | 50% | 0.230 | 1 | |
| Positive | 34.5% | | 1.394 (0.470 - 4.137) | 0.549 |
| LVE | | | | |
| Negative | 38.5% | 0.613 | 1 | |
| Positive | 37.5% | | 0.871 (0.364 - 2.082) | 0.756 |
| Necrosis | | | | |
| Negative | 40.7% | 0.256 | 1 | |
| Positive | 30% | | 1.335 (0.542 - 3.292) | 0.530 |
| Bile duct proliferation | | | | |
| Mild/moderate | 42.9% | 0.421 | 1 | |
| Severe | 34.7% | | 1.079 (0.648 - 1.798) | 0.770 |
| FOSL1 | | | | |
| Low | 46.8% | 0.044* | 1 | |
| High | 33.1% | | 4.112 (1.057 - 8.091) | 0.039* |
| Recurrence | | | | |
| Negative | 59.1% | 0.454 | 1 | |
| Positive | 66.7% | | 1.943 (0.412 - 2.160) | 0.302 |