World Journal of Oncology, ISSN 1920-4531 print, 1920-454X online, Open Access
Article copyright, the authors; Journal compilation copyright, World J Oncol and Elmer Press Inc
Journal website https://www.wjon.org

Original Article

Volume 14, Number 4, August 2023, pages 277-284


Association Between Telomere Length and Risk of Lung Cancer in an Asian Population: A Mendelian Randomization Study

Figures

Figure 1.
Figure 1. Description of the study design in this two-sample MR study. (a) MR analyses depend on three core assumptions. (b) Sketch of the study design. LTL: leucocyte telomere length; MR: Mendelian randomization; SNPs: single nucleotide polymorphisms.
Figure 2.
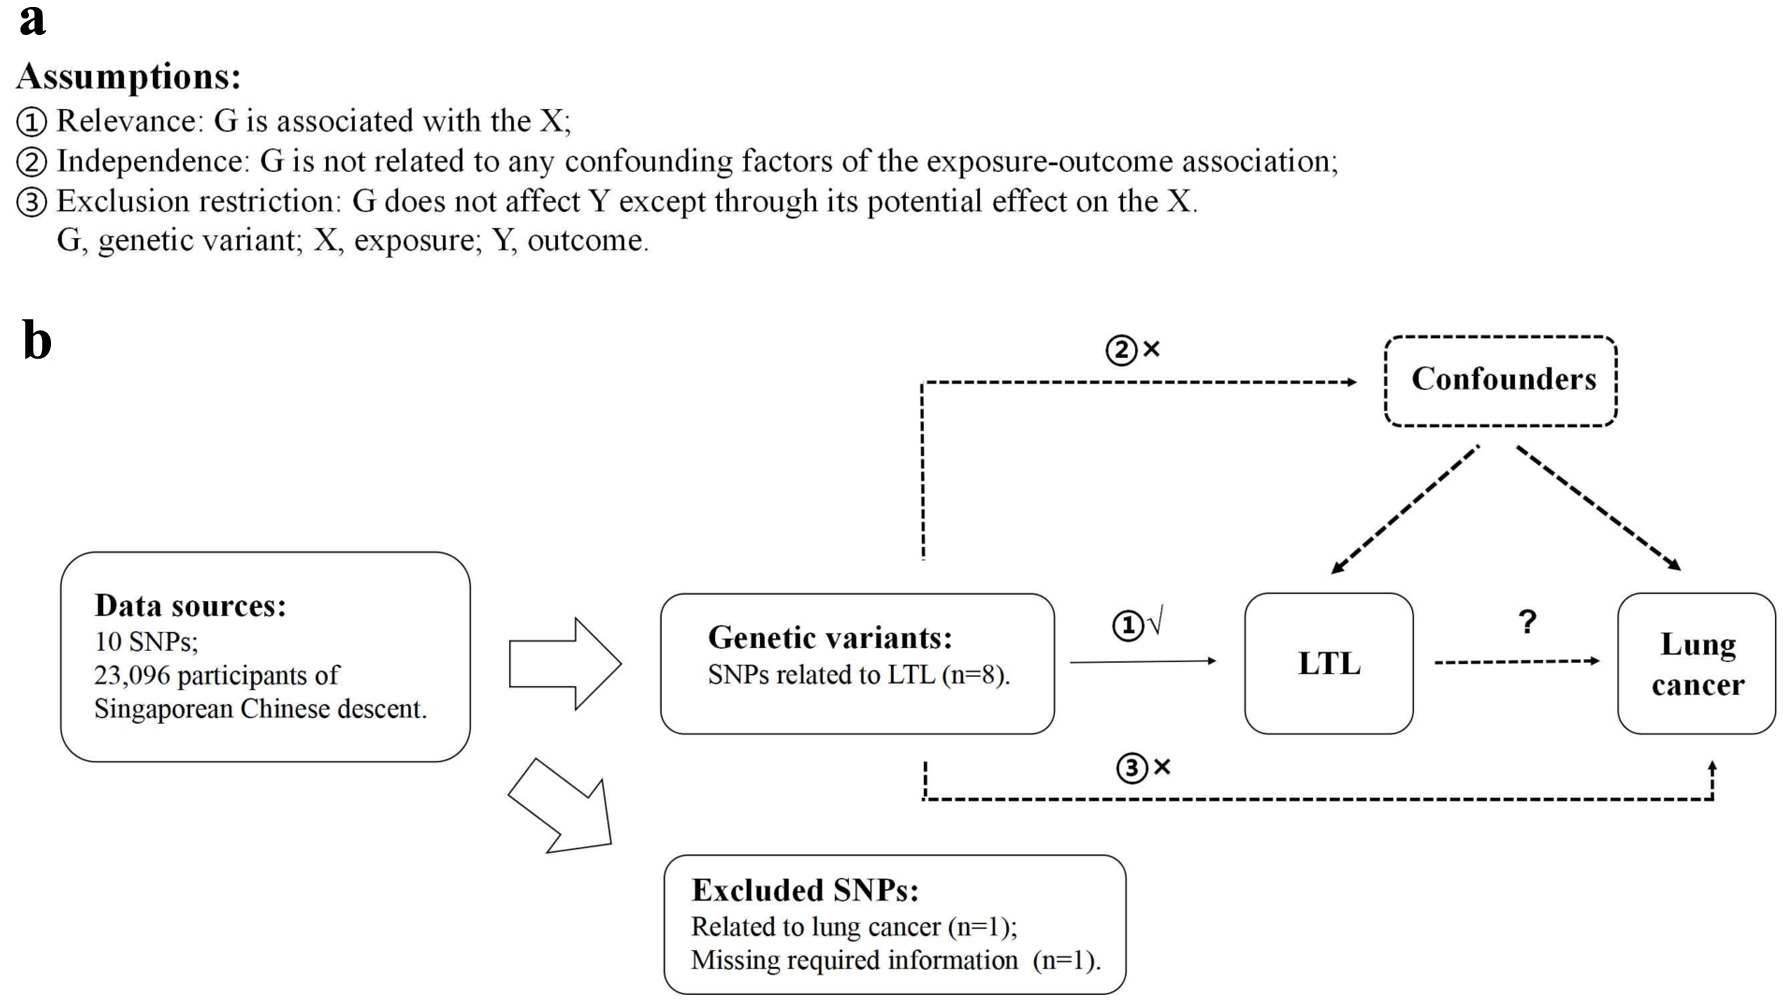
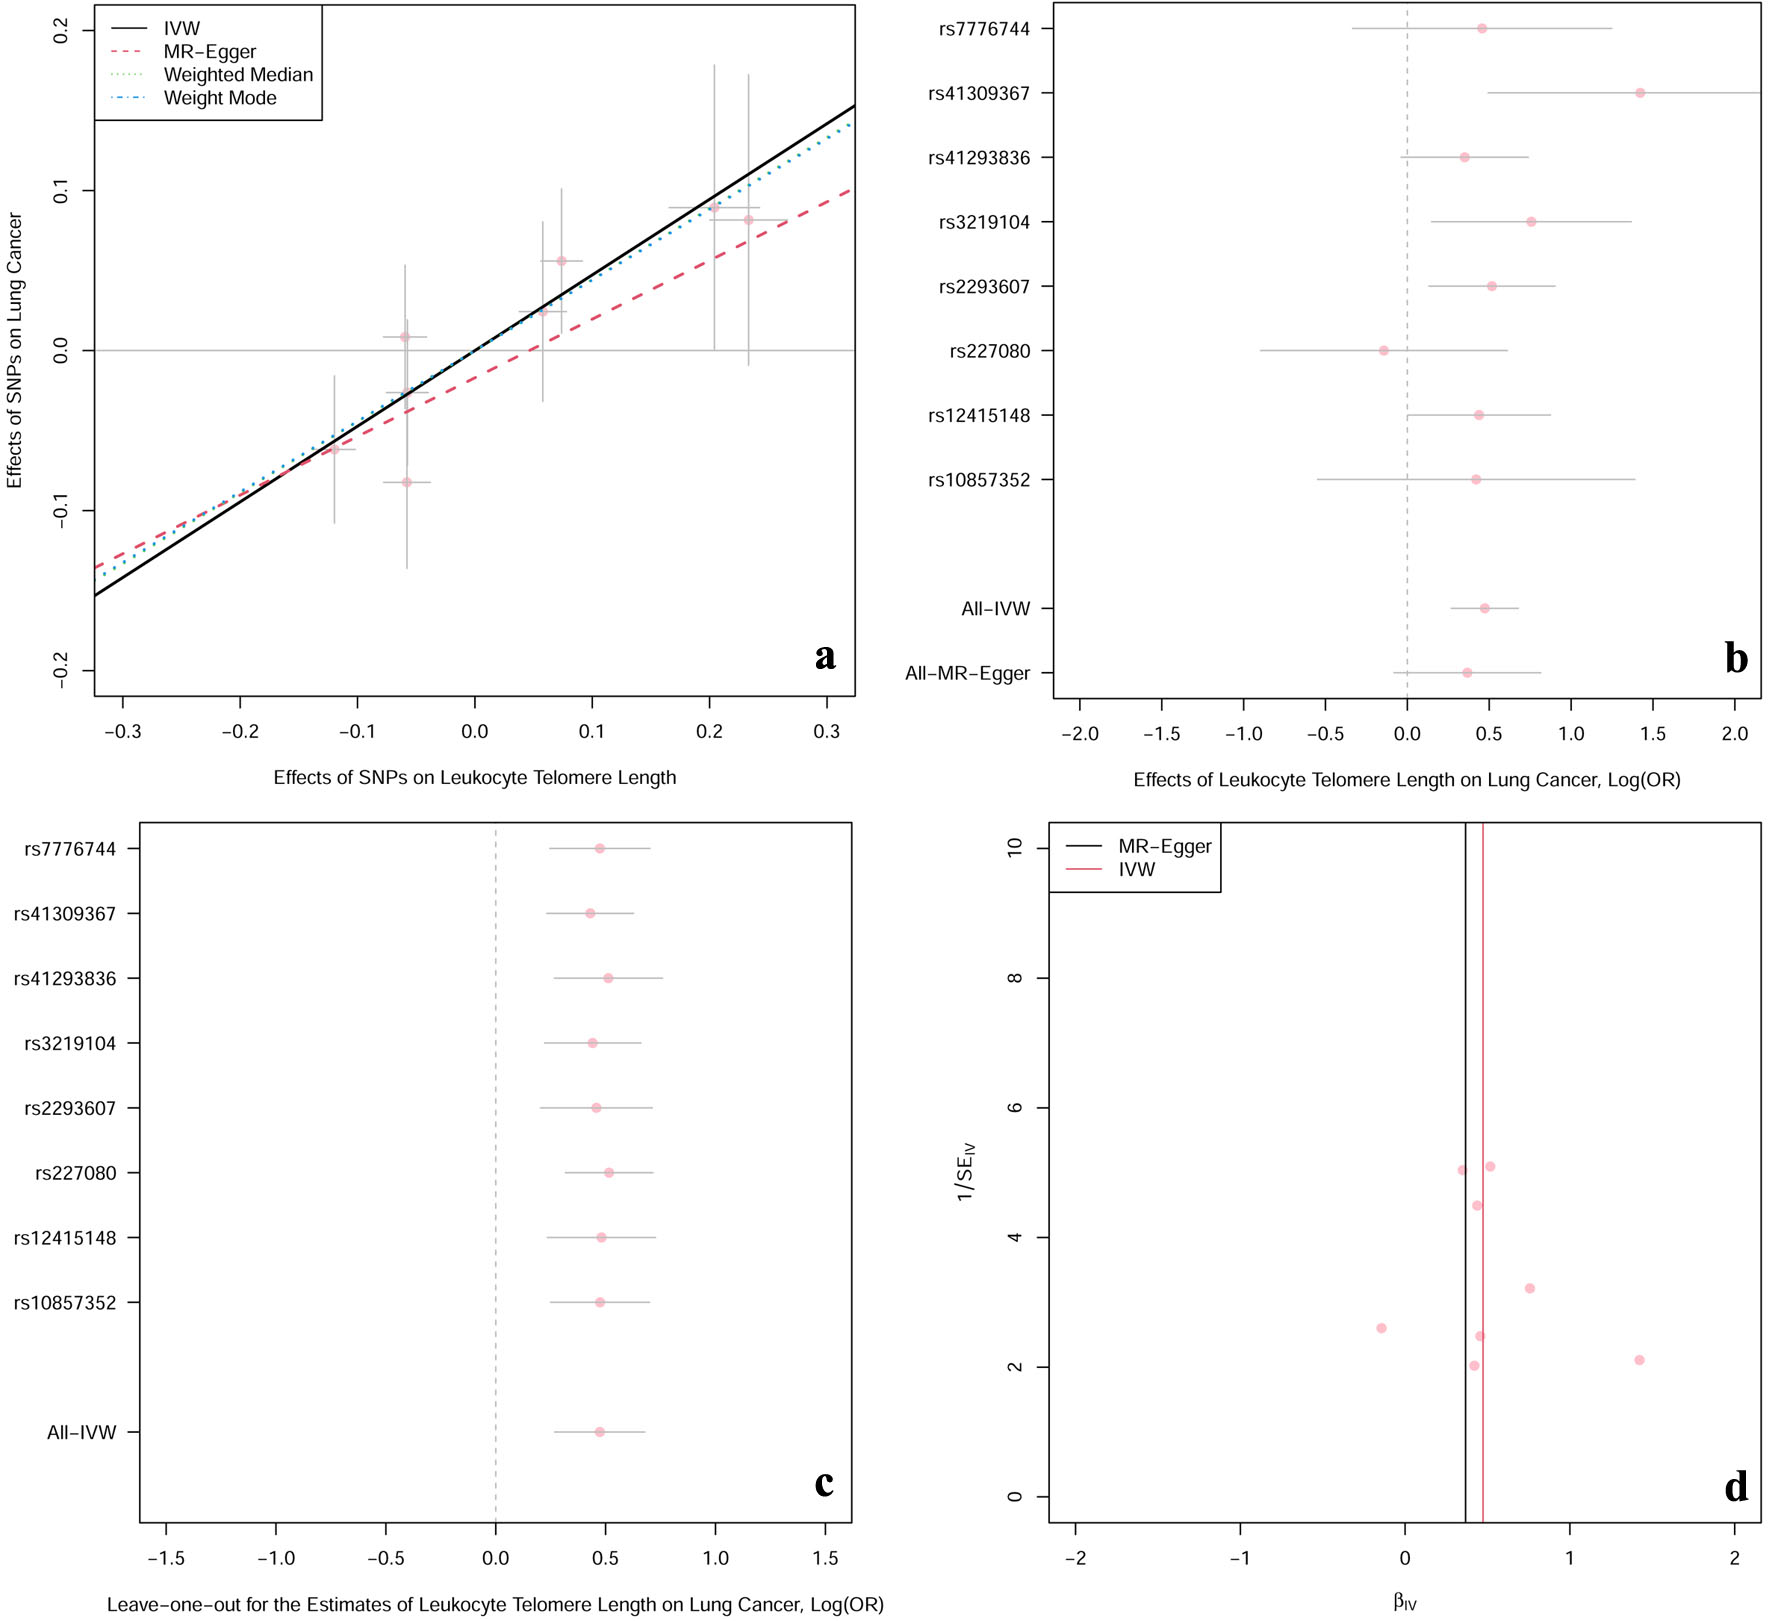
Figure 2. The casual effect of LTL on lung cancer. (a) Scatter plot of the association between LTL and risk of lung cancer. The four methods applied in the current manuscript were all depicted. Lines in black, red, green and blue represent for IVW, MR-Egger, weighted median and weighted mode models. (b) Forest plot was used to show the MR estimates and 95% CI values (gray line segment) for each SNP. As well, it also showed the IVW and MR-Egger MR results in the bottom. (c) Leave-one-out analysis was applied to evaluate whether any single instrumental variable was driving the causal effect. (d) Funnel plot was applied to detect whether the observed association was along with obviously heterogeneity. β: beta estimate; CI: confidence interval; IVW: inverse-variance weighted; LTL: leucocyte telomere length; OR: odds ratio; SE: standard error of the beta; SNPs: single nucleotide polymorphisms.

Tables

Table 1. Genetic Variants (n = 10) Applied to Estimate the Effect of LTL on Lung Cancer in MR Analyses
 
rsIDChrPosEffect alleleOther allelesP for exposureβSEP for outcome
β: beta estimate; Chr: chromosome number; LTL: leucocyte telomere length; MR: Mendelian randomization; Pos: chromosomal position; rsID: reference SNP ID; SE: standard error of the beta.
rs412938361424721327TC1.00 × 10-2000.2330.0177.78 × 10-2
rs770552651285974AC2.61 × 10-380.1180.0102.83 × 10-13
rs22936073169482335CT1.00 × 10-200-0.1200.0108.49 × 10-3
rs1241514810105680586CT2.78 × 10-250.2040.0204.92 × 10-2
rs32191041226562621CA2.43 × 10-160.0740.0091.49 × 10-2
rs28365964873920883CT6.96 × 10-150.2700.035NA
rs108573524164101482GA1.60 × 10-80.0580.0103.95 × 10-1
rs413093672062309554TC1.16 × 10-8-0.0580.0102.69 × 10-3
rs22708011108247888GA1.87 × 10-10-0.0600.0097.10 × 10-1
rs77767447124599749GA2.51 × 10-10-0.0580.0092.58 × 10-1


Table 2. Genetic Predicted the Association Between LTL and Lung Cancer in the MR Analyses
 
ExposureOutcomeNo. of SNPsMethodsOR (95% CI)β (SE)P
β: beta estimate; CI: confidence interval; IVW: inverse-variance weighted; LTL: leucocyte telomere length; MR: Mendelian randomization; OR: odds ratio; SE: standard error of the beta; SNPs: single nucleotide polymorphisms.
LTLLung cancer8IVW1.60 (1.31 - 1.97)0.473 (0.104)5.96 × 10⁻⁶
MR-Egger1.44 (0.92 - 2.26)0.367 (0.228)1.60 × 10⁻¹
Weighted median1.56 (1.21 - 2.01)0.444 (0.129)5.99 × 10⁻⁴
Weighted mode1.55 (1.19 - 2.04)0.441 (0.139)1.54 × 10⁻²


Table 3. Pleiotropy and Heterogeneity Analyses
 
ExposureOutcomeMR-Egger regressionMR-PRESSOHeterogeneity analyses
InterceptP_interceptGlobal test PCorrect P*MethodQP_Q
IVW: inverse-variance weighted; LTL: leucocyte telomere length; MR: Mendelian randomization.
LTLLung cancer0.0120.6150.448NAIVW7.8860.343
MR-Egger7.5320.274


Table 4. Genetic Predicted the Association Between LTL and Lung Cancer in the Multivariable MR Analyses
 
ExposureOutcomeNo. of SNPsMethodsOR (95% CI)P
LTLLung cancer8IVW1.93 (1.37 - 2.73)0.0002
MR-Egger1.81 (0.80 - 4.07)0.1945
Weighted median1.57 (1.22 - 2.04)0.0006
Weighted mode1.55 (1.20 - 2.00)0.0093