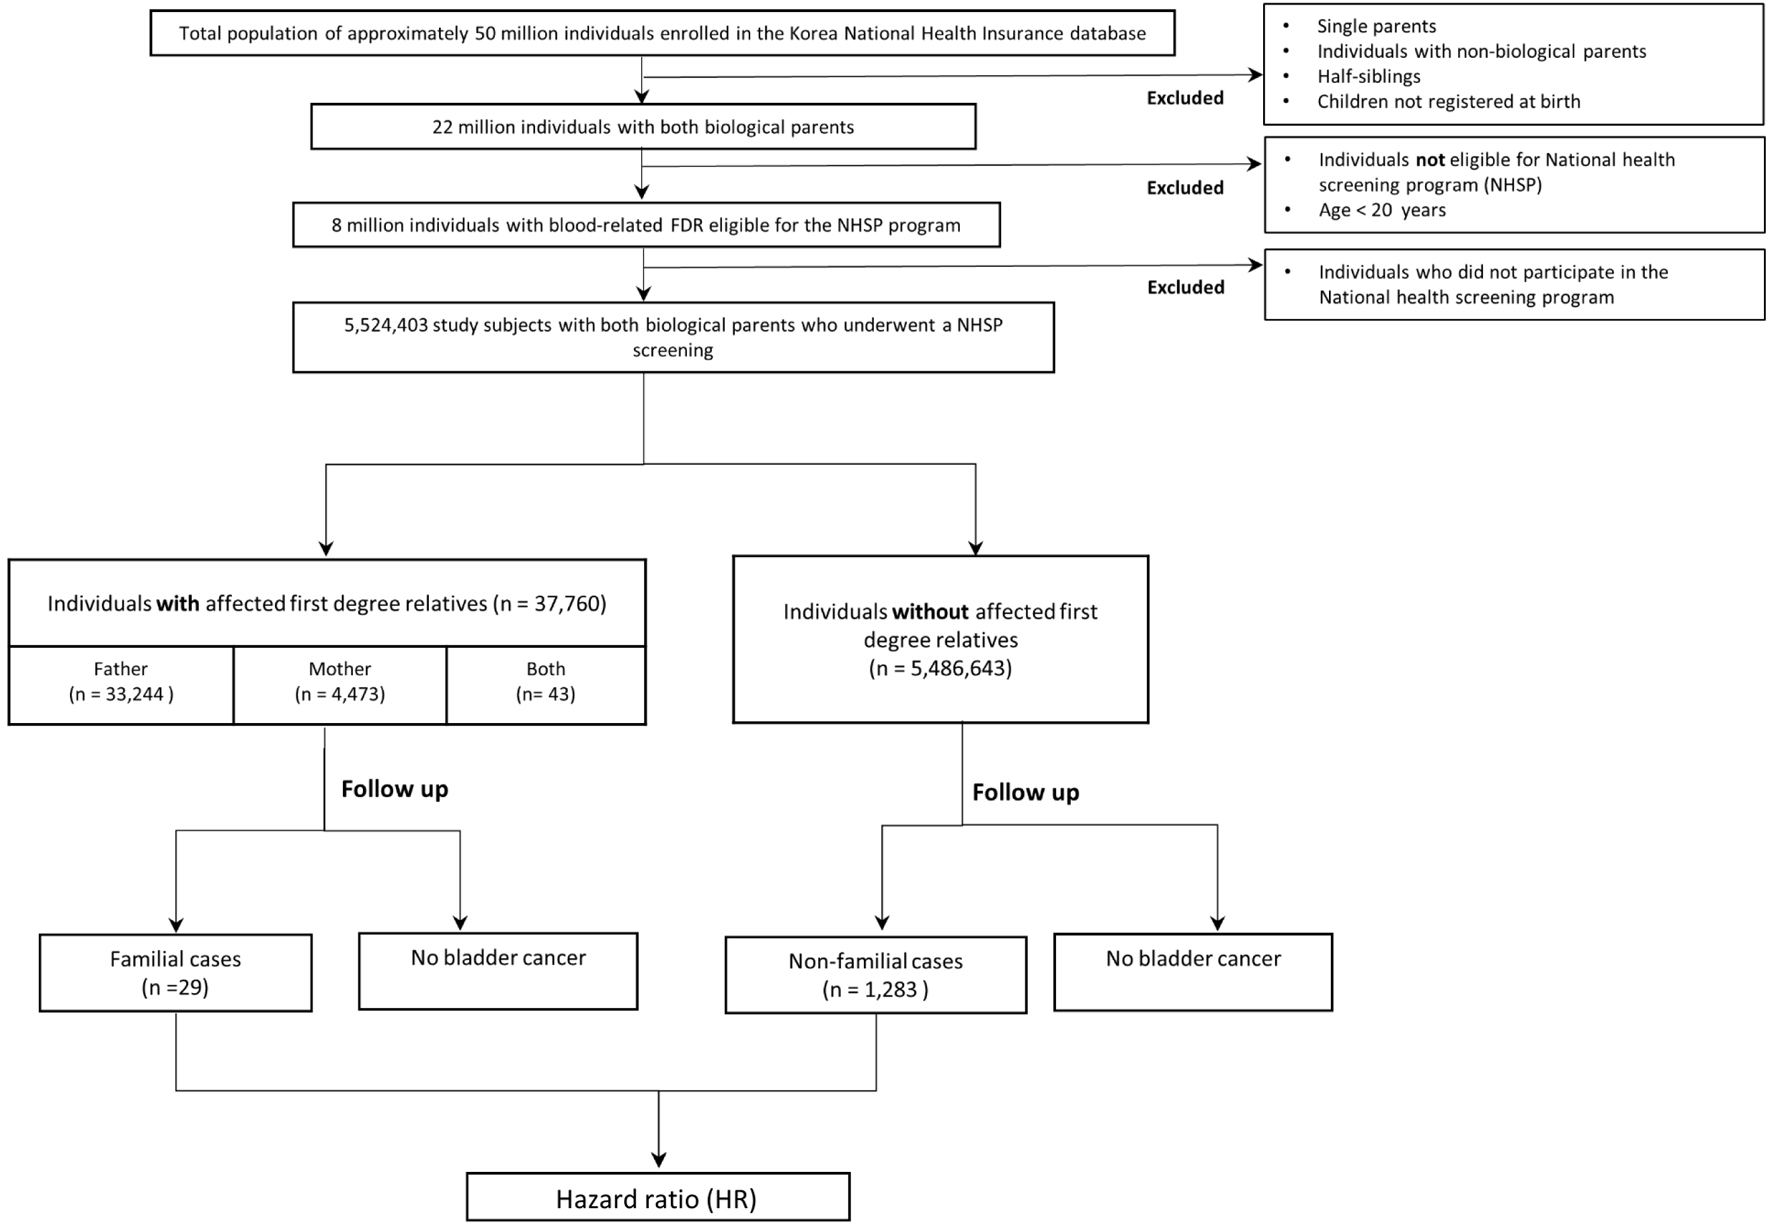
Figure 1. Study flow diagram.
| World Journal of Oncology, ISSN 1920-4531 print, 1920-454X online, Open Access |
| Article copyright, the authors; Journal compilation copyright, World J Oncol and Elmer Press Inc |
| Journal website https://www.wjon.org |
Original Article
Volume 14, Number 5, October 2023, pages 382-391
Familial Risk and Interaction With Smoking and Alcohol Consumption in Bladder Cancer: A Population-Based Cohort Study
Figures
Tables
| With affected parents | Without affected parents | Total | Standardized difference | ||||
|---|---|---|---|---|---|---|---|
| n | % | n | % | n | % | ||
| DBP: diastolic blood pressure; SBP: systolic blood pressure. | |||||||
| Total | 37,760 | 5,486,643 | 5,524,403 | ||||
| Sex | |||||||
| Male | 26,608 | 70.4 | 3,542,561 | 64.6 | 3,569,169 | 64.6 | 0.13 |
| Female | 11,152 | 29.5 | 1,955,234 | 35.4 | 1,955,234 | 35.4 | |
| Year of birth | |||||||
| ∼1971 | 15,013 | 39.8 | 1,082,427 | 19.7 | 1,097,440 | 19.9 | 0.61 |
| 1972 - 1981 | 16,282 | 43.1 | 2,155,959 | 39.3 | 2,172,241 | 39.3 | |
| 1982 - 1991 | 6,120 | 16.2 | 2,039,026 | 37.2 | 2,045,146 | 37.0 | |
| 1992 - 2001 | 345 | 0.9 | 209,231 | 3.8 | 209,576 | 3.8 | |
| Smoking intensity (pack-years) | |||||||
| Non-smoker | 15,142 | 40.1 | 2,638,151 | 48.1 | 2,653,293 | 48.0 | 0.27 |
| < 10 | 11,360 | 30.1 | 1,821,137 | 33.2 | 1,832,497 | 33.2 | |
| 10 to < 20 | 7,168 | 19.0 | 714,447 | 13.0 | 721,615 | 13.1 | |
| ≥ 20 | 4,090 | 10.8 | 312,908 | 5.7 | 316,998 | 5.7 | |
| Alcohol consumption | |||||||
| Non-drinker | 6,377 | 16.9 | 1,067,761 | 19.5 | 1,074,138 | 19.4 | 0.13 |
| < 5 drinks (males), < 4 drinks (females) per week or < twice/week | 24,648 | 65.3 | 3,434,680 | 62.6 | 3,459,328 | 62.6 | |
| ≥ 5 drinks (males), ≥ 4 drinks (females) per week and ≥ twice/week | 4,555 | 12.1 | 783,988 | 14.3 | 788,543 | 14.3 | |
| Body mass index (kg/m2) | |||||||
| < 18.5 | 2,000 | 5.3 | 388,834 | 7.1 | 390,834 | 7.1 | 0.14 |
| 18.5 to < 23 | 14,999 | 39.7 | 2,426,300 | 44.2 | 2,441,299 | 44.2 | |
| 23 to < 25 | 8,180 | 21.7 | 1,095,343 | 20.0 | 1,103,523 | 20.0 | |
| ≥ 25 | 12,581 | 33.3 | 1,576,166 | 28.7 | 1,588,747 | 28.8 | |
| Blood pressure (mm Hg) | |||||||
| SBP < 120 and DBP < 80 (reference) | 15,008 | 39.7 | 2,475,675 | 45.1 | 2,490,683 | 45.1 | 0.14 |
| SBP ≥ 120 and SBP < 130 and DBP < 80 | 4,377 | 11.6 | 656,293 | 12.0 | 660,670 | 12.0 | |
| SBP ≥ 130 and SBP < 140 or DBP ≥ 80 and DBP < 90 | 13,326 | 35.3 | 1,830,605 | 33.4 | 1,843,931 | 33.4 | |
| SBP ≥ 140 and SBP < 180 or DBP ≥ 90 | 4,948 | 13.1 | 513,569 | 9.4 | 518,517 | 9.4 | |
| SBP ≥ 180 and/or DBP ≥ 120 | 93 | 0.2 | 9,939 | 0.2 | 10,032 | 0.2 | |
| Fasting blood glucose (mg/dL) | |||||||
| < 100 | 34,152 | 90.4 | 5,109,735 | 93.1 | 5,143,887 | 93.1 | 0.10 |
| 100 to < 126 | 2,233 | 5.9 | 247,299 | 4.5 | 249,532 | 4.5 | |
| ≥ 126 | 1,365 | 3.6 | 128,495 | 2.3 | 129,860 | 2.4 | |
| Cholesterol (mg/dL) | |||||||
| < 200 | 24,166 | 64.0 | 3,817,195 | 69.6 | 3,841,361 | 69.5 | 0.12 |
| 200 to < 240 | 10,204 | 27.0 | 1,286,276 | 23.4 | 1,296,480 | 23.5 | |
| ≥ 240 | 3,340 | 8.8 | 372,707 | 6.8 | 376,047 | 6.8 | |
| With affected parents | Without affected parents | |||
|---|---|---|---|---|
| Father | Mother | Total | ||
| aRisk factors include: age, sex, body mass index, blood pressure, cholesterol, fasting blood sugar, pulse pressure, proteinuria, drinking and smoking. HR: hazard ratio; CI: confidence interval. | ||||
| Number of people at risk | 33,244 | 4,473 | 37,760 | 5,486,643 |
| Male | 23,358 | 3,221 | 26,608 | 3,542,561 |
| Female | 9,886 | 1,252 | 11,152 | 1,944,082 |
| Number of cases | 25 | 4 | 29 | 1,283 |
| Person-years | 585,412 | 78,679 | 664,850 | 96,707,652 |
| Incidence/10,000 person-years (95% CI) | 0.43 (0.29 - 0.63) | 0.51 (0.19 - 1.35) | 0.44 (0.30 - 0.63) | 0.13 (0.13 - 0.14) |
| Crude HRs (95% CI) | 3.32 (2.21 - 4.97) | 2.02 (0.51 - 8.10) | 3.16 (2.14 - 4.66) | 1 |
| HRs (95% CI) adjusted for age and sex | 2.26 (1.51 - 3.39) | 1.10 (0.27 - 4.41) | 2.09 (1.41 - 3.08) | 1 |
| HRs (95% CI) adjusted for risk factorsa | 2.20 (1.47 - 3.30) | 1.09 (0.27 - 4.38) | 2.04 (1.38 - 3.01) | 1 |