Figures
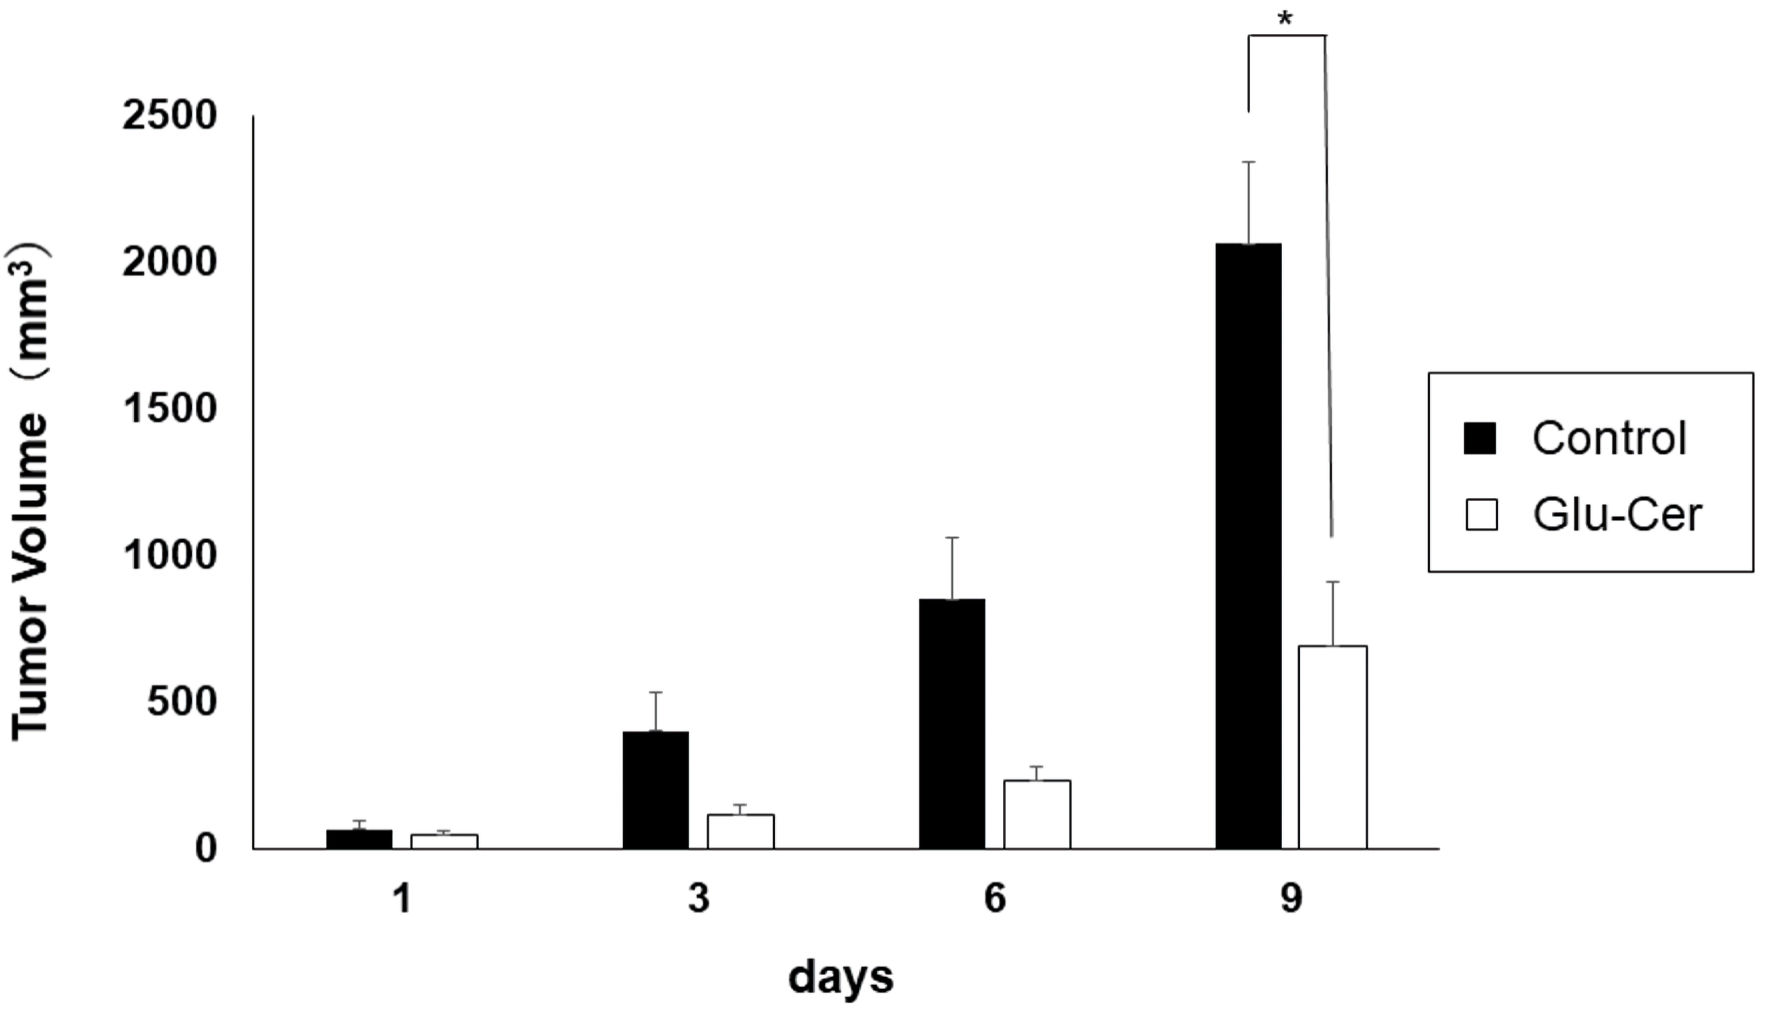
Figure 1. Inhibition of tumor growth in xenograft mice by oral administration of glucosylceramide (Glu-Cer). Data are shown as the mean (n = 10) on days 1, 3, 6, and 9. The Mann-Whitney U test was performed for statistical analysis, all tests were two-tailed, and P < 0.05 was considered significant (shown in asterisk). Glu-Cer: the group treated with Glu-Cer; control: the control group.
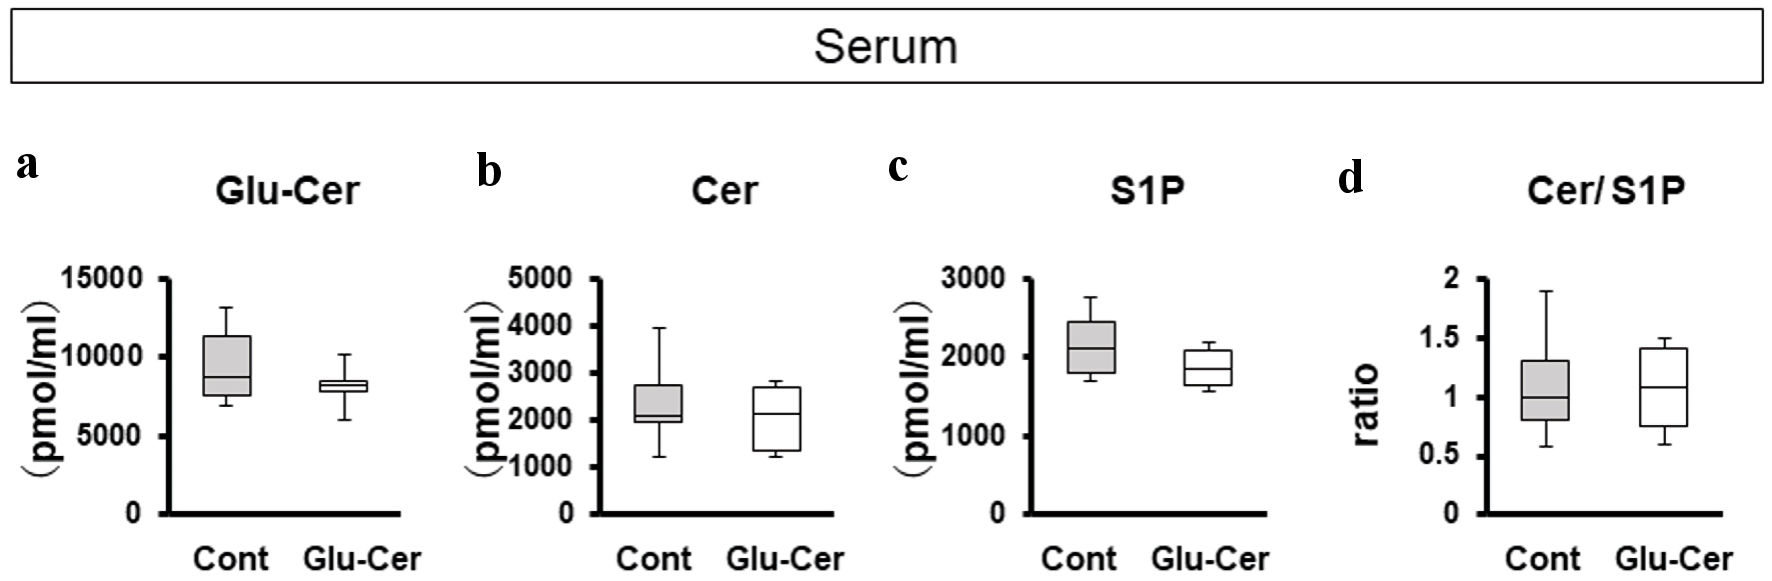
Figure 2. Comparison of serum concentrations of sphingolipids between the glucosylceramide (Glu-Cer) group and the control group. The sphingolipid concentrations in mouse serum (a-d) were determined by mass spectrometry. (a) The concentrations of Glu-Cer, (b) ceramide (Cer), (c) sphingosine-1-phosphate (S1P), and (d) the ratio of the Cer concentration to that of S1P (Cer/S1P) were compared between the Glu-Cer group and the control group. Mean values are shown as horizontal lines. The Mann-Whitney U test was performed for statistical analysis, all tests were two-tailed, and P < 0.05 was considered significant. Glu-Cer: the group treated with Glu-Cer; Cont: the control group.
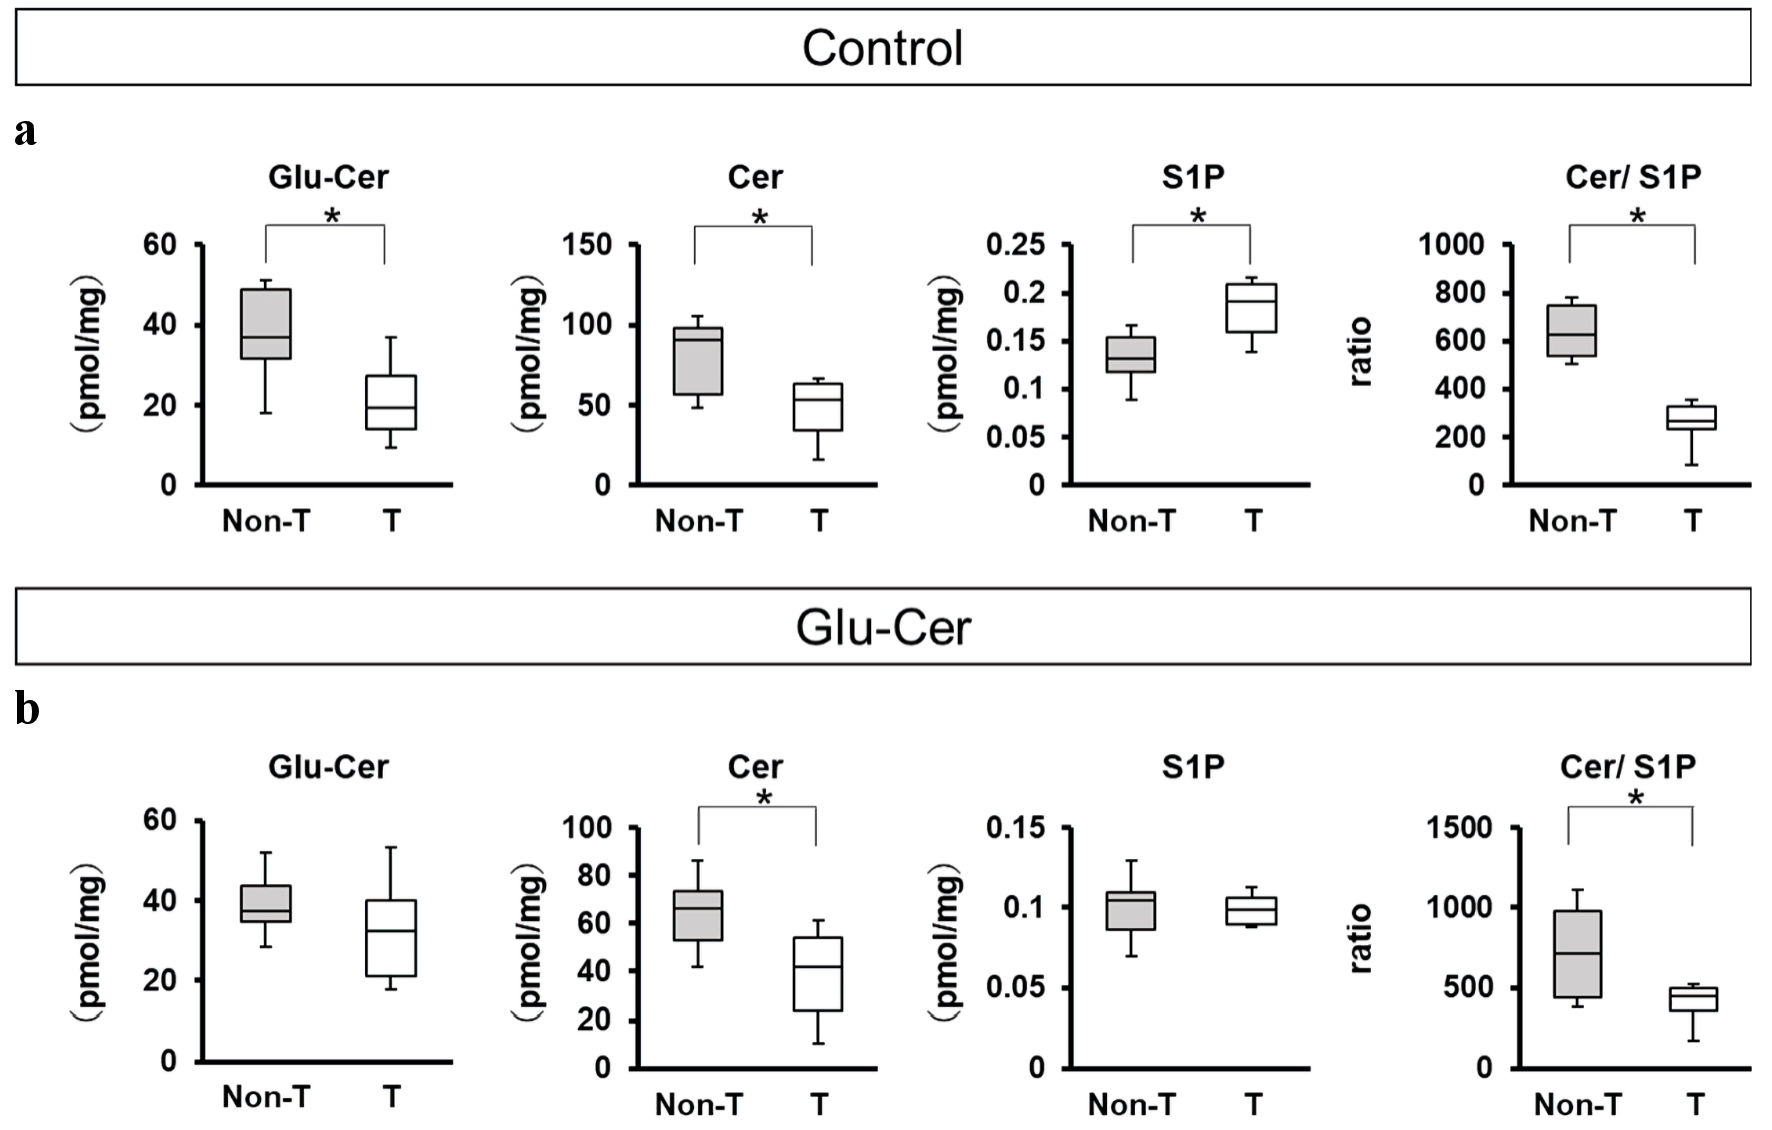
Figure 3. Comparison of sphingolipid concentrations between paired tumor and non-tumor tissues. The sphingolipids concentrations of mice treated without glucosylceramide (Glu-Cer) (n = 10) (a) and mice treated with Glu-Cer (n = 10) (b) were determined by mass spectrometry (n = 10 for each group). The concentrations of Glu-Cer, ceramide (Cer), and sphingosine-1-phosphate (S1P) and the ratio of the Cer concentration to that of S1P (Cer/S1P) were compared between paired mouse breast cancer tissue and normal breast tissue. Mean values are shown as horizontal lines. The Mann-Whitney U test was performed for statistical analysis, all tests were two-tailed, and P < 0.05 was considered significant (shown as an asterisk). T: the tumor group; Non-T: the non-tumor group.
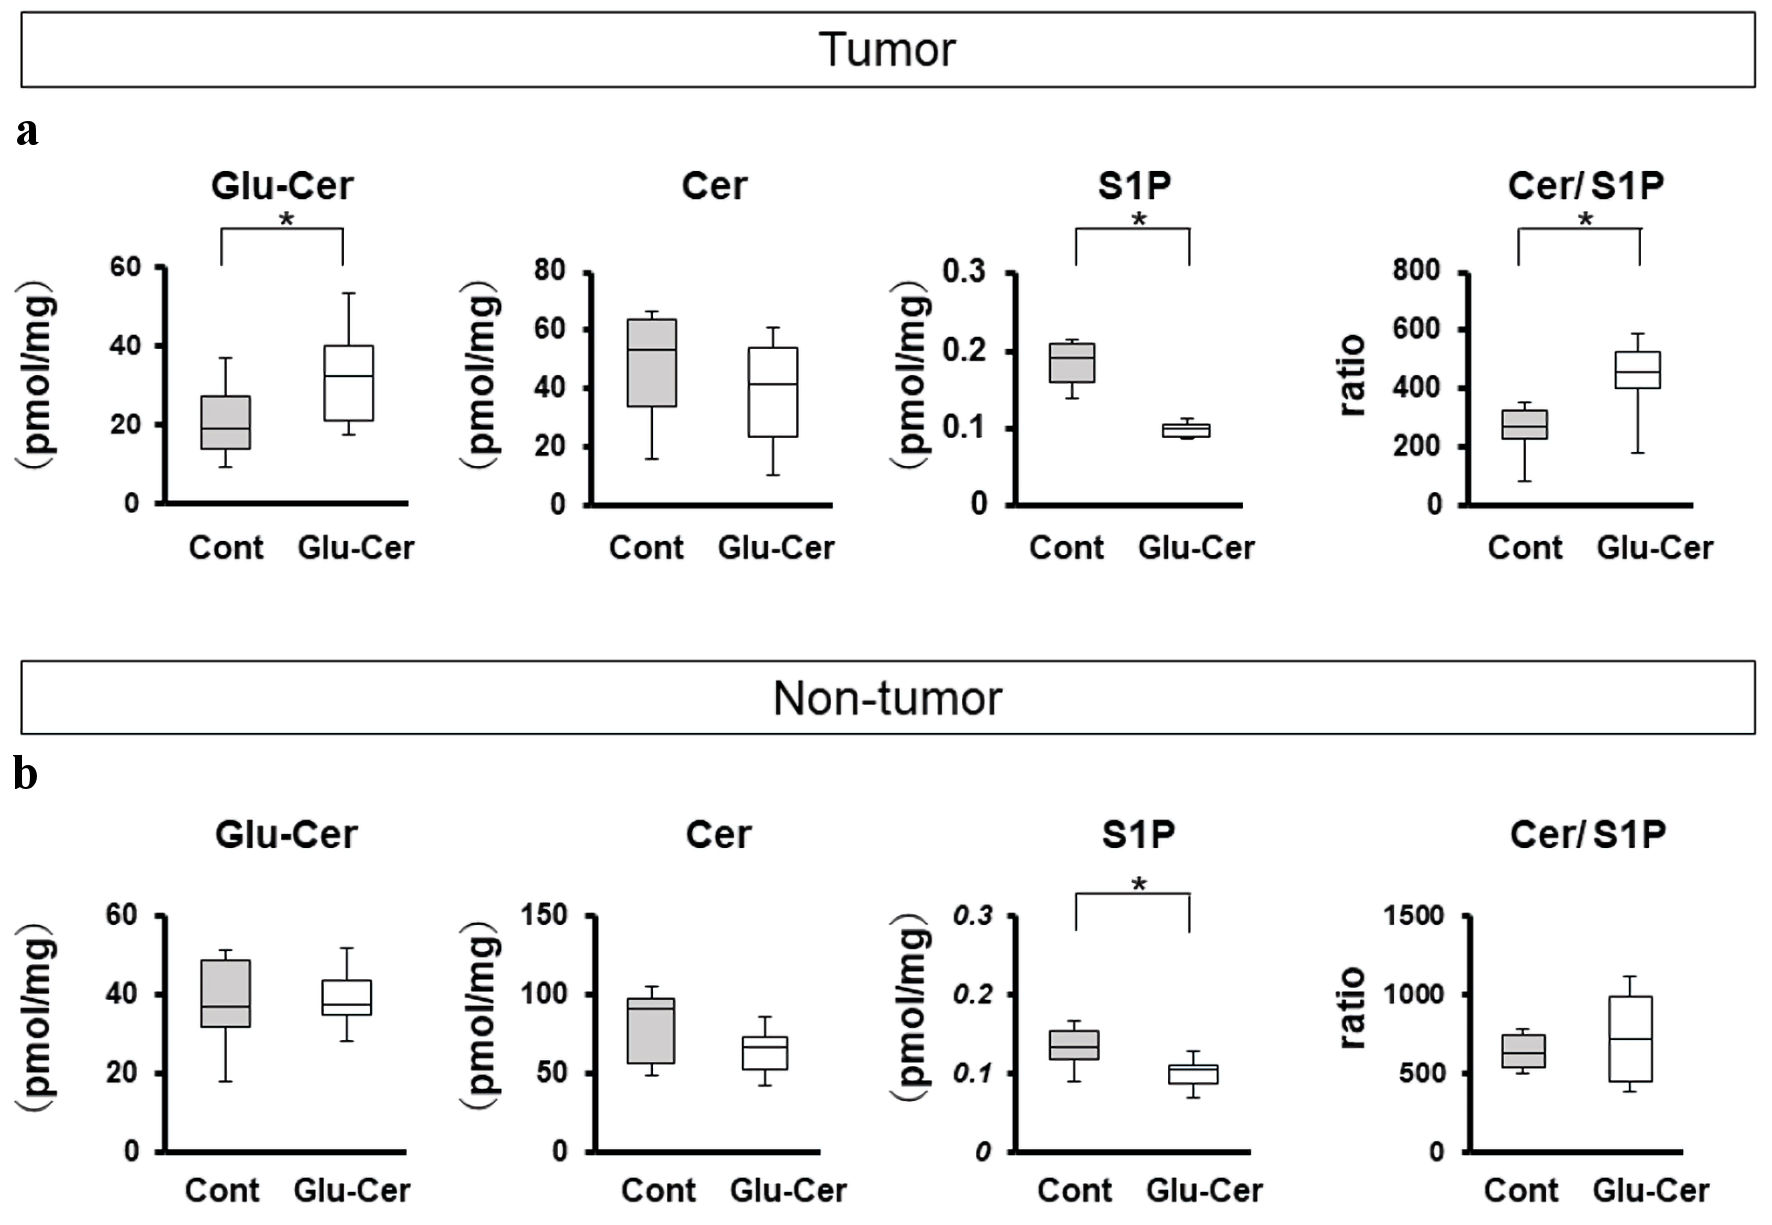
Figure 4. Comparison of sphingolipid concentrations between the Glu-Cer group and the control group. The sphingolipid concentrations in tumor (a) and non-tumor tissues (b) were determined by mass spectrometry. The concentrations of glucosylceramide (Glu-Cer), ceramide (Cer), and sphingosine-1-phosphate (S1P), and the ratio of the Cer concentration to that of S1P (Cer/S1P) were compared between the Glu-Cer group and the control group Mean values are shown as horizontal lines. The Mann-Whitney U test was performed for statistical analysis, all tests were two-tailed, and P < 0.05 was considered significant (indicated by an asterisk). Glu-Cer: the group treated with Glu-Cer; Cont: the control group.
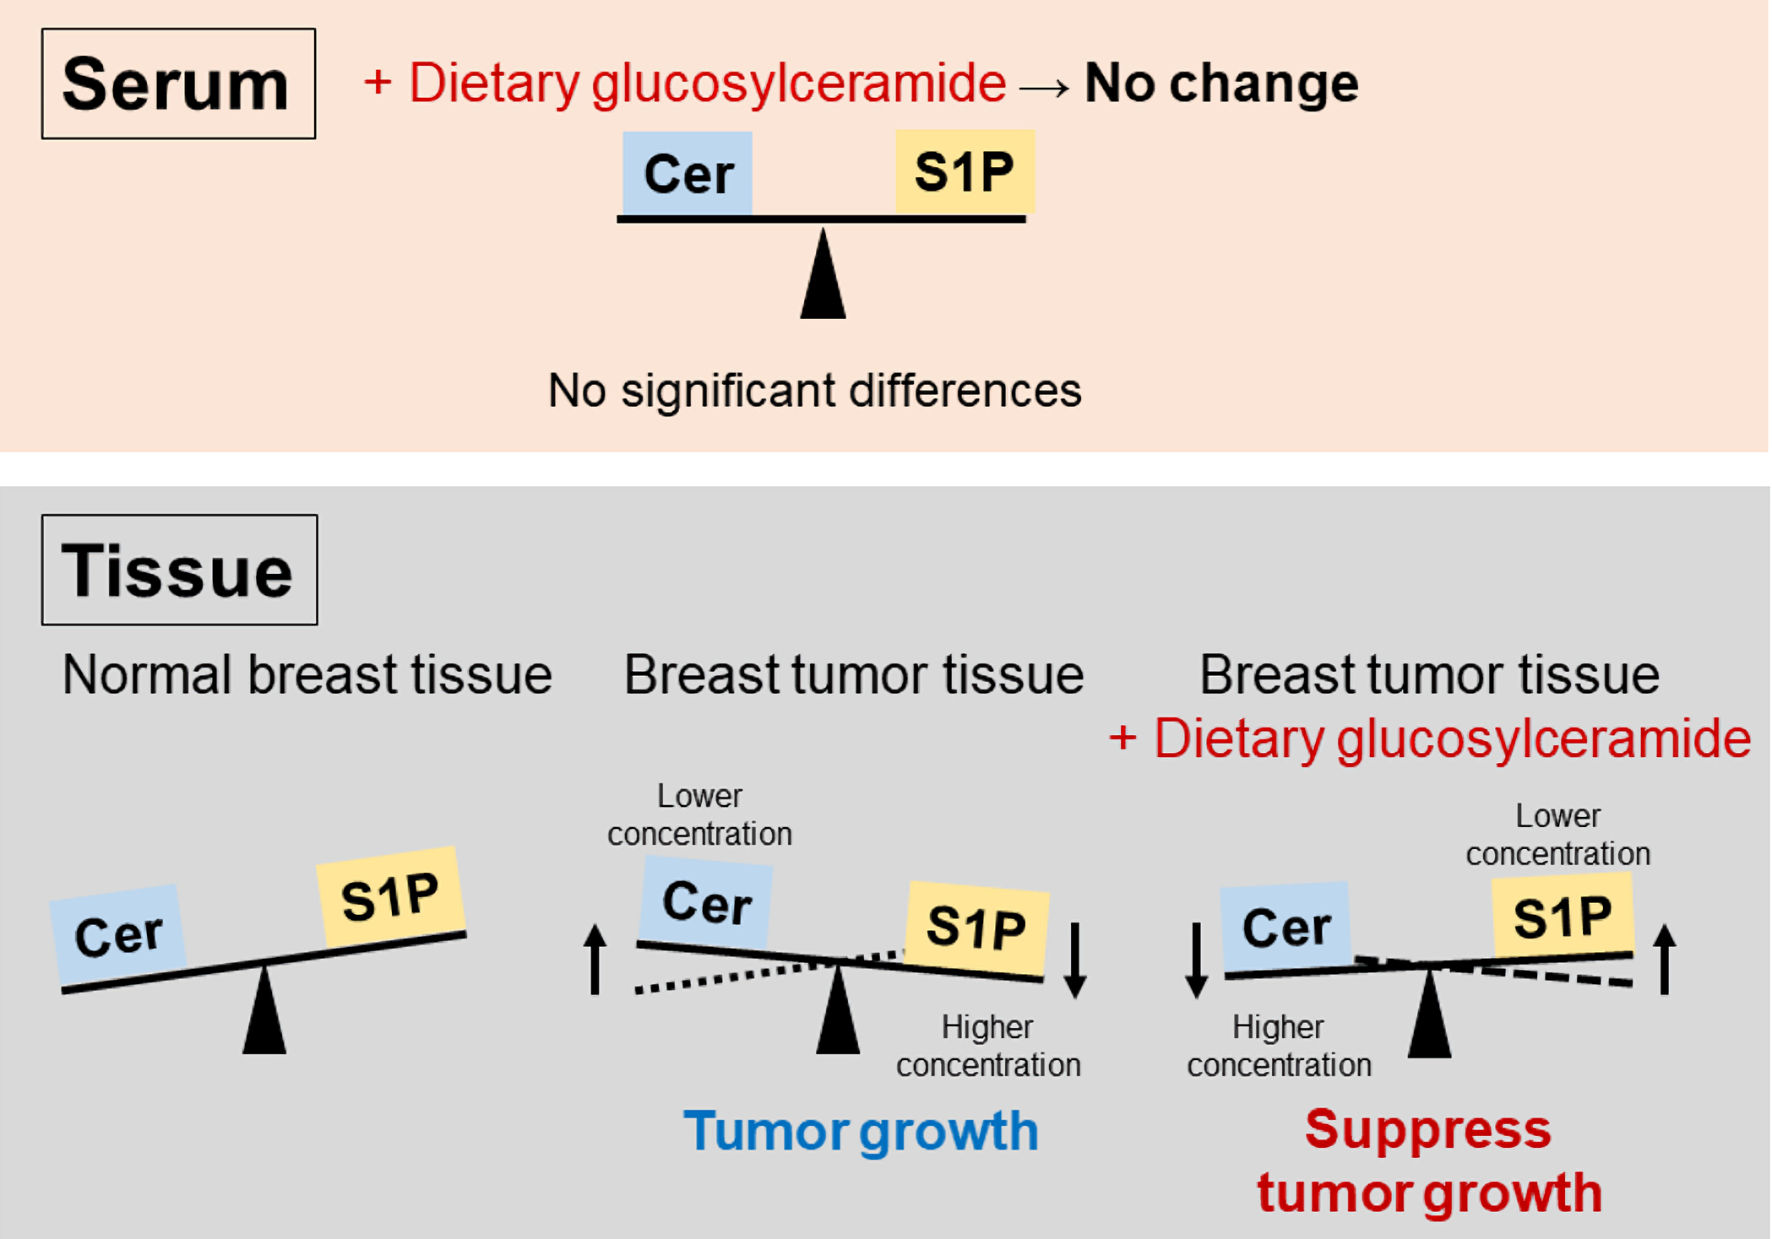
Figure 5. Scheme highlighting the importance of the sphingolipid rheostat in breast tumors. Ceramide (Cer) induces cell death, whereas sphingosine-1-phosphate (S1P) promotes cell survival. Tumor cell survival was supported by S1P generation from Cer, leading to tumor growth. Tumor growth could be suppressed by Cer conversion from S1P. There were no significant differences in serum.