Figures
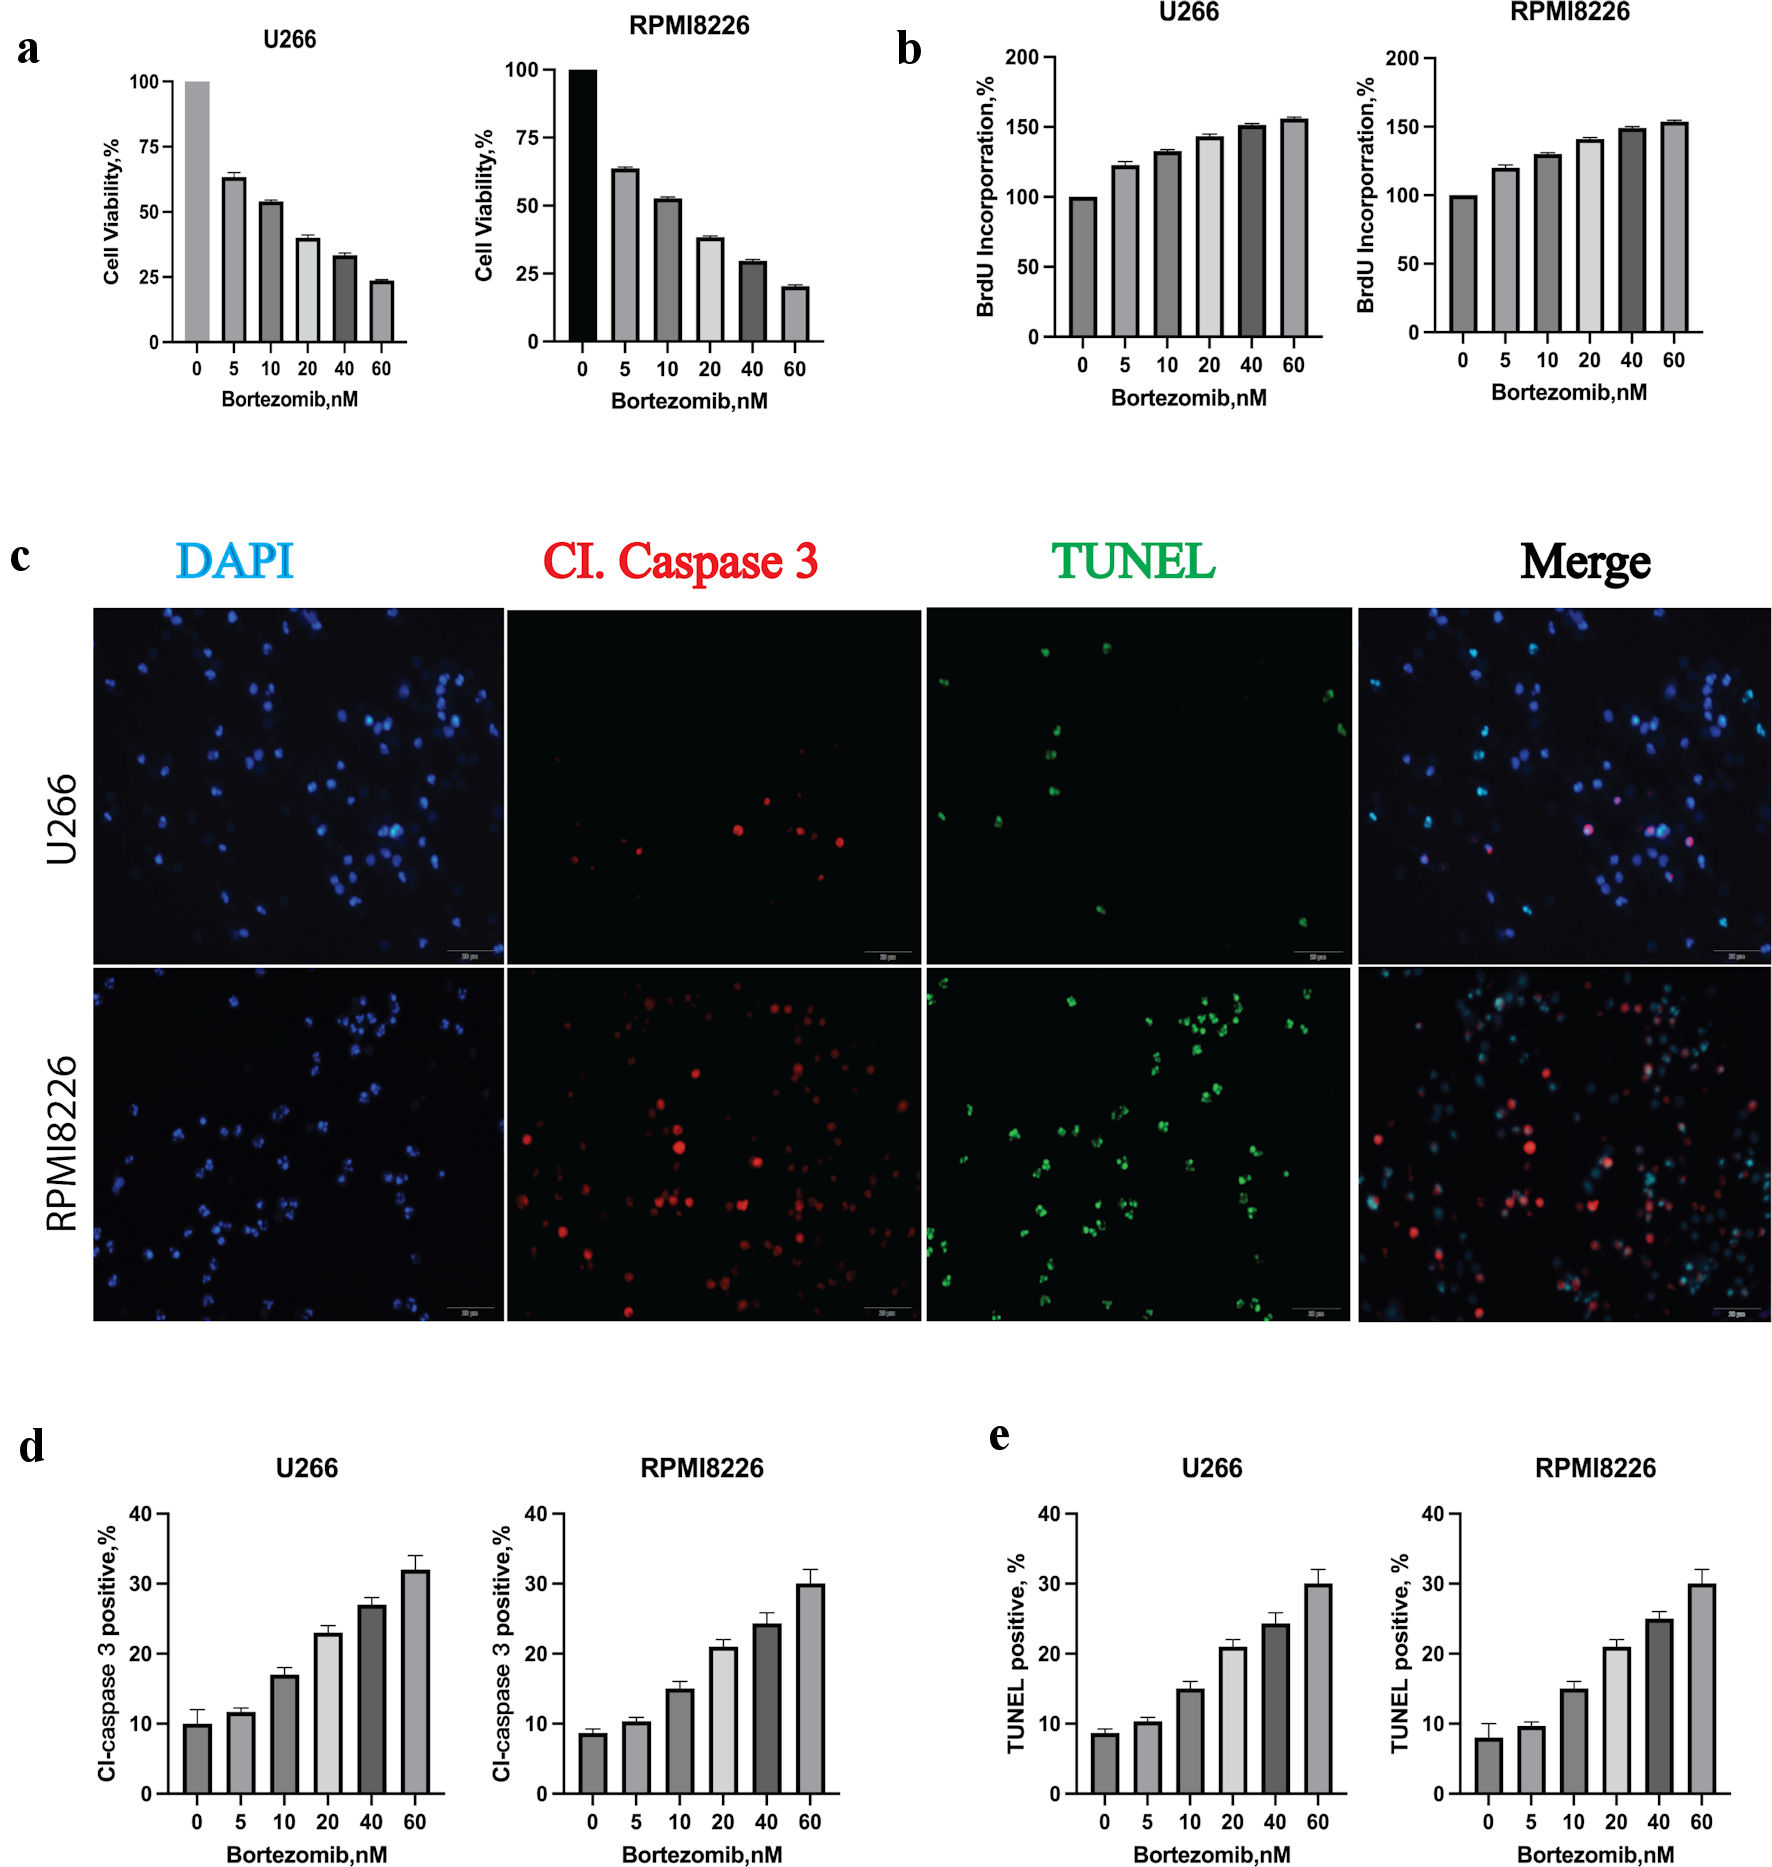
Figure 1. Bortezomib decreased multiple myeloma (MM) cell viability, proliferation rate and induced apoptosis. (a) Bortezomib decreased the viability of U266 and RPMI8226 at indicated concentrations with the CCK8 assay. Error bars represent SD values determined from triplicate measurements. (b) Bortezomib decreased cell proliferation of U266 and RPMI8226. Cells were incubated with bortezomib at indicated concentrations for 24 h and BrdU for 2 h. BrdU incorporation was determined relative to untreated cells. Error bars represent SD values determined from triplicate measurements. (c) Bortezomib induced apoptosis in U266 cell line. U266 cells were incubated with bortezomib, caspase 3 and TUNEL for 24 h. MM cells were then visualized by staining and confocal microscopy for caspase 3 (red) and TUNEL (green) to label apoptosis. (d) The relative amount of caspase 3 (red) fluorescence was determined using ImageJ software (National Institutes of Health, Bethesda, MD, USA). Error bars represent SD values from triplicate measurements. (e) The relative amount of TUNEL (green) fluorescence was determined using ImageJ software (National Institutes of Health, Bethesda, MD, USA). Error bars represent SD values from triplicate measurements. CCK8: cell counting kit-8; SD: standard deviation; DAPI: 4’,6-diamidino-2-phenylindole; TUNEL: terminal deoxynucleotidyltransferase-mediated dUTP nick end-labeling.
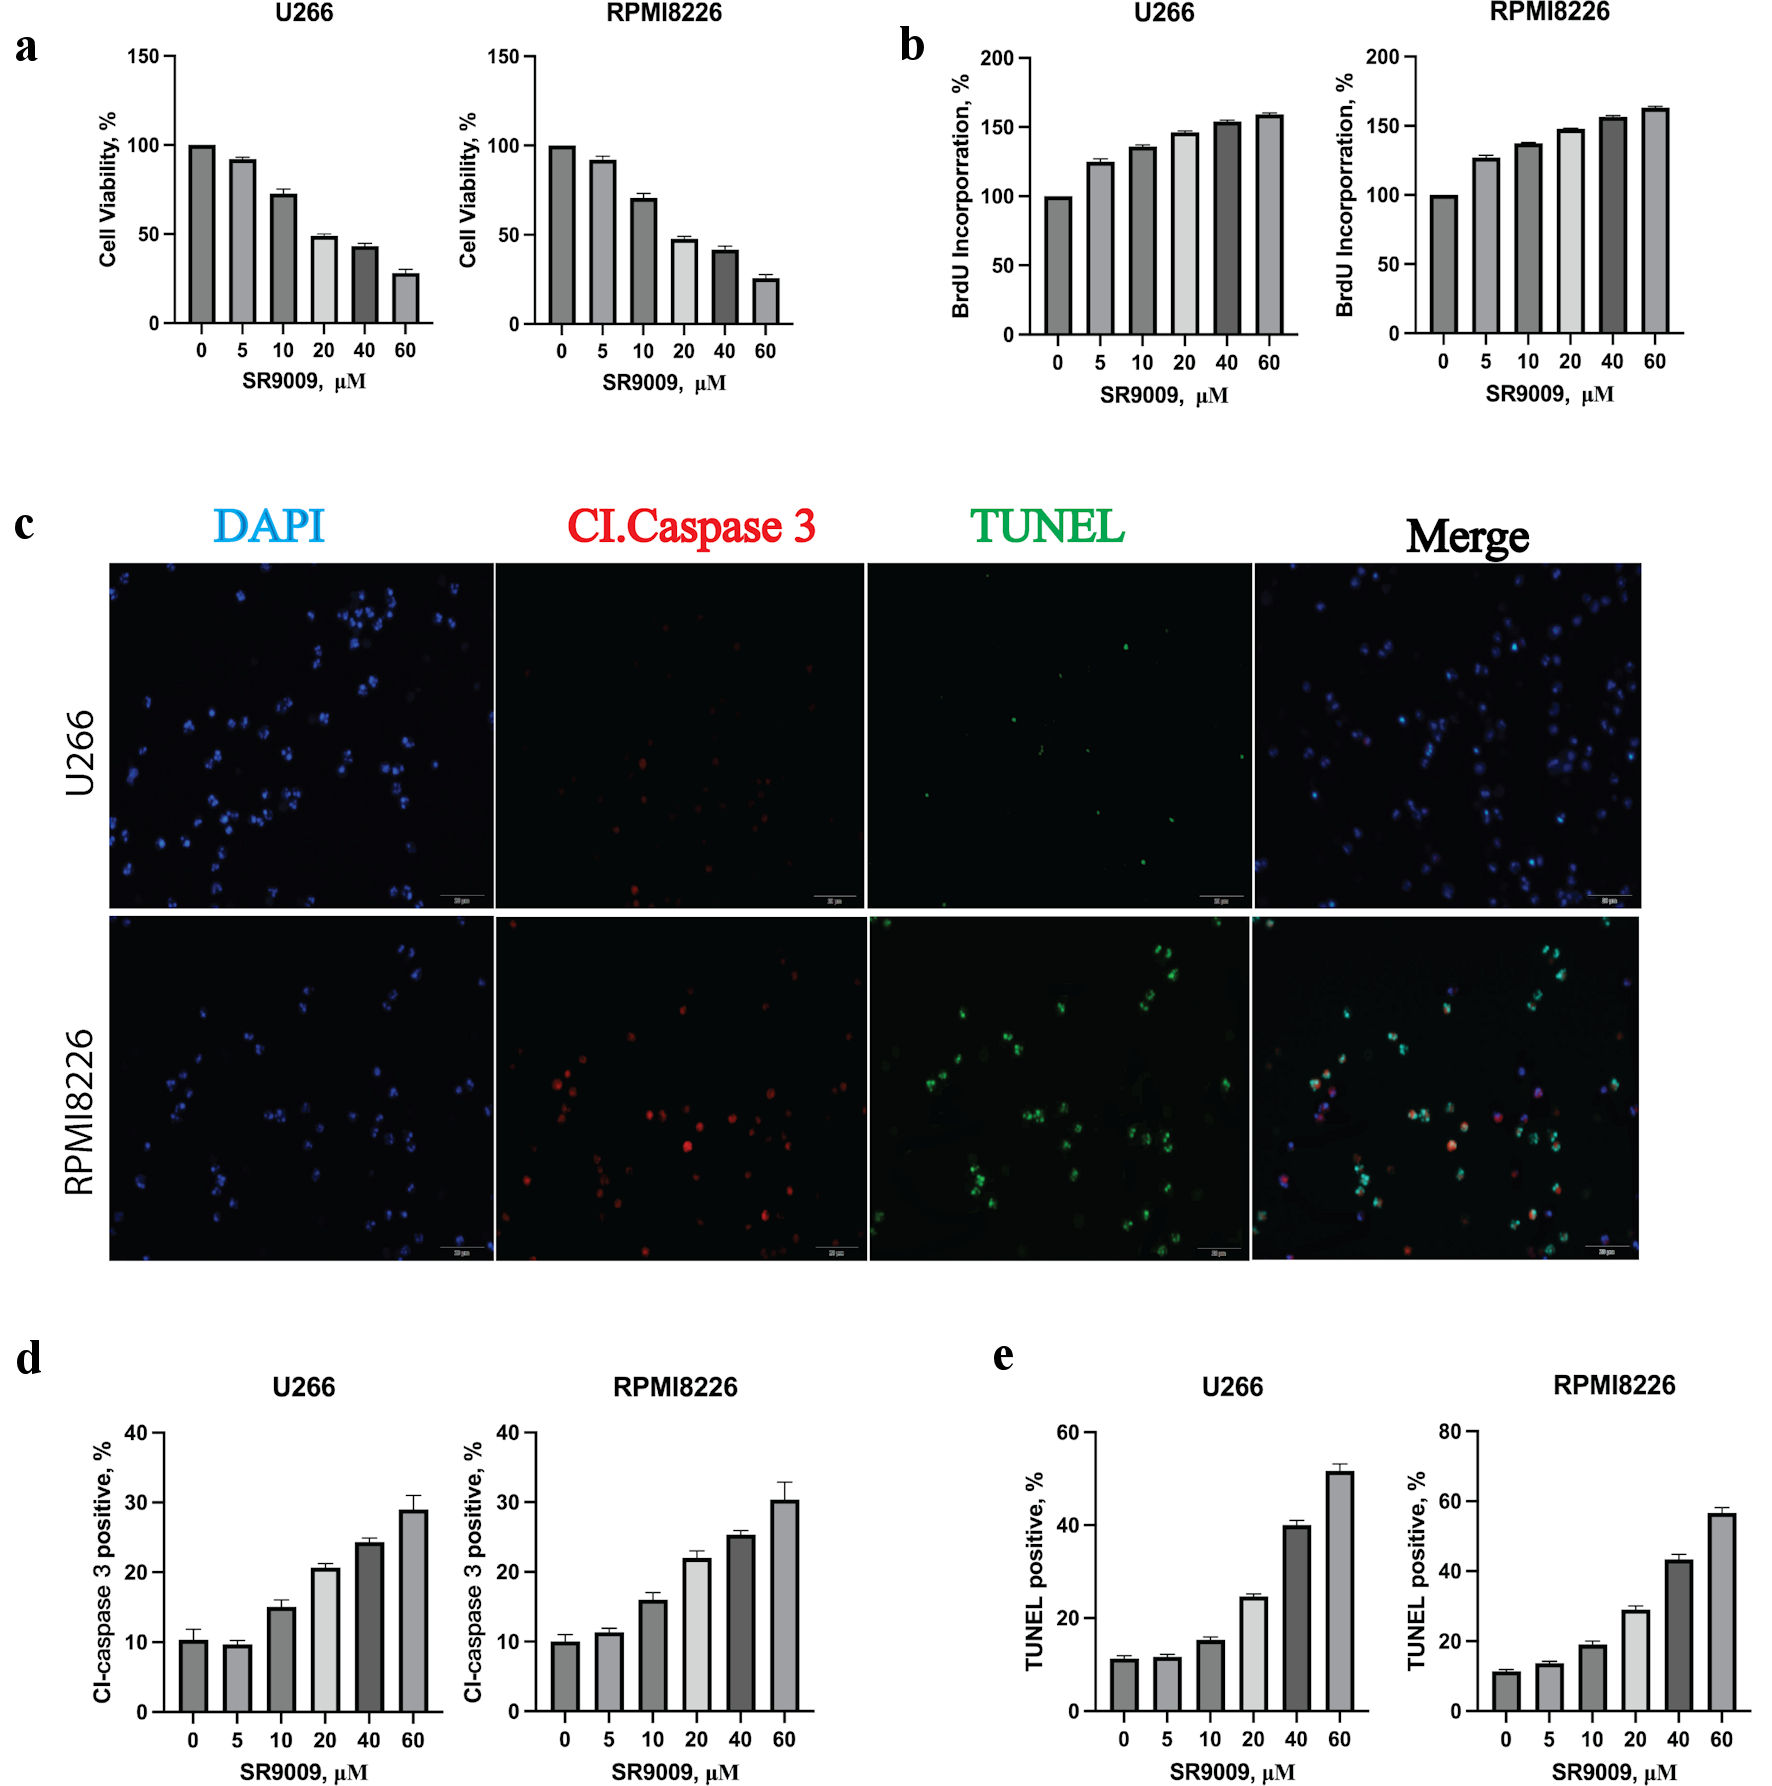
Figure 2. Circadian clock REV-ERB agonist SR9009 decreased multiple myeloma (MM) viability, proliferation rate and induced an apoptotic response in MM cells. (a) SR9009 decreased the viability of U266 and RPMI8226 at indicated concentrations with the CCK8 assay. Error bars represent SD values determined from triplicate measurements. (b) SR9009 decreased the proliferation rate of U266 and RPMI8226. Cells were incubated with SR9009 at indicated concentrations for 48 h and BrdU for 2 h. BrdU incorporation was determined relative to untreated cells. Error bars represent SD values determined from triplicate measurements. (c) SR9009 induced apoptosis in U266 cell line. U266 cells were incubated with SR9009, caspase 3 and TUNEL for 24 h. Cells were then visualized by confocal microscopy for caspase 3 (red) and TUNEL (green) to label apoptosis. (d) The relative amount of caspase 3 (red) fluorescence was determined using ImageJ software (National Institutes of Health, Bethesda, MD, USA). Error bars represent SD values from triplicate measurements. (e) The relative amount of TUNEL (green) fluorescence was determined using ImageJ software (National Institutes of Health, Bethesda, MD, USA). Error bars represent SD values from triplicate measurements. CCK8: cell counting kit-8; SD: standard deviation; DAPI: 4’,6-diamidino-2-phenylindole; TUNEL: terminal deoxynucleotidyltransferase-mediated dUTP nick end-labeling.
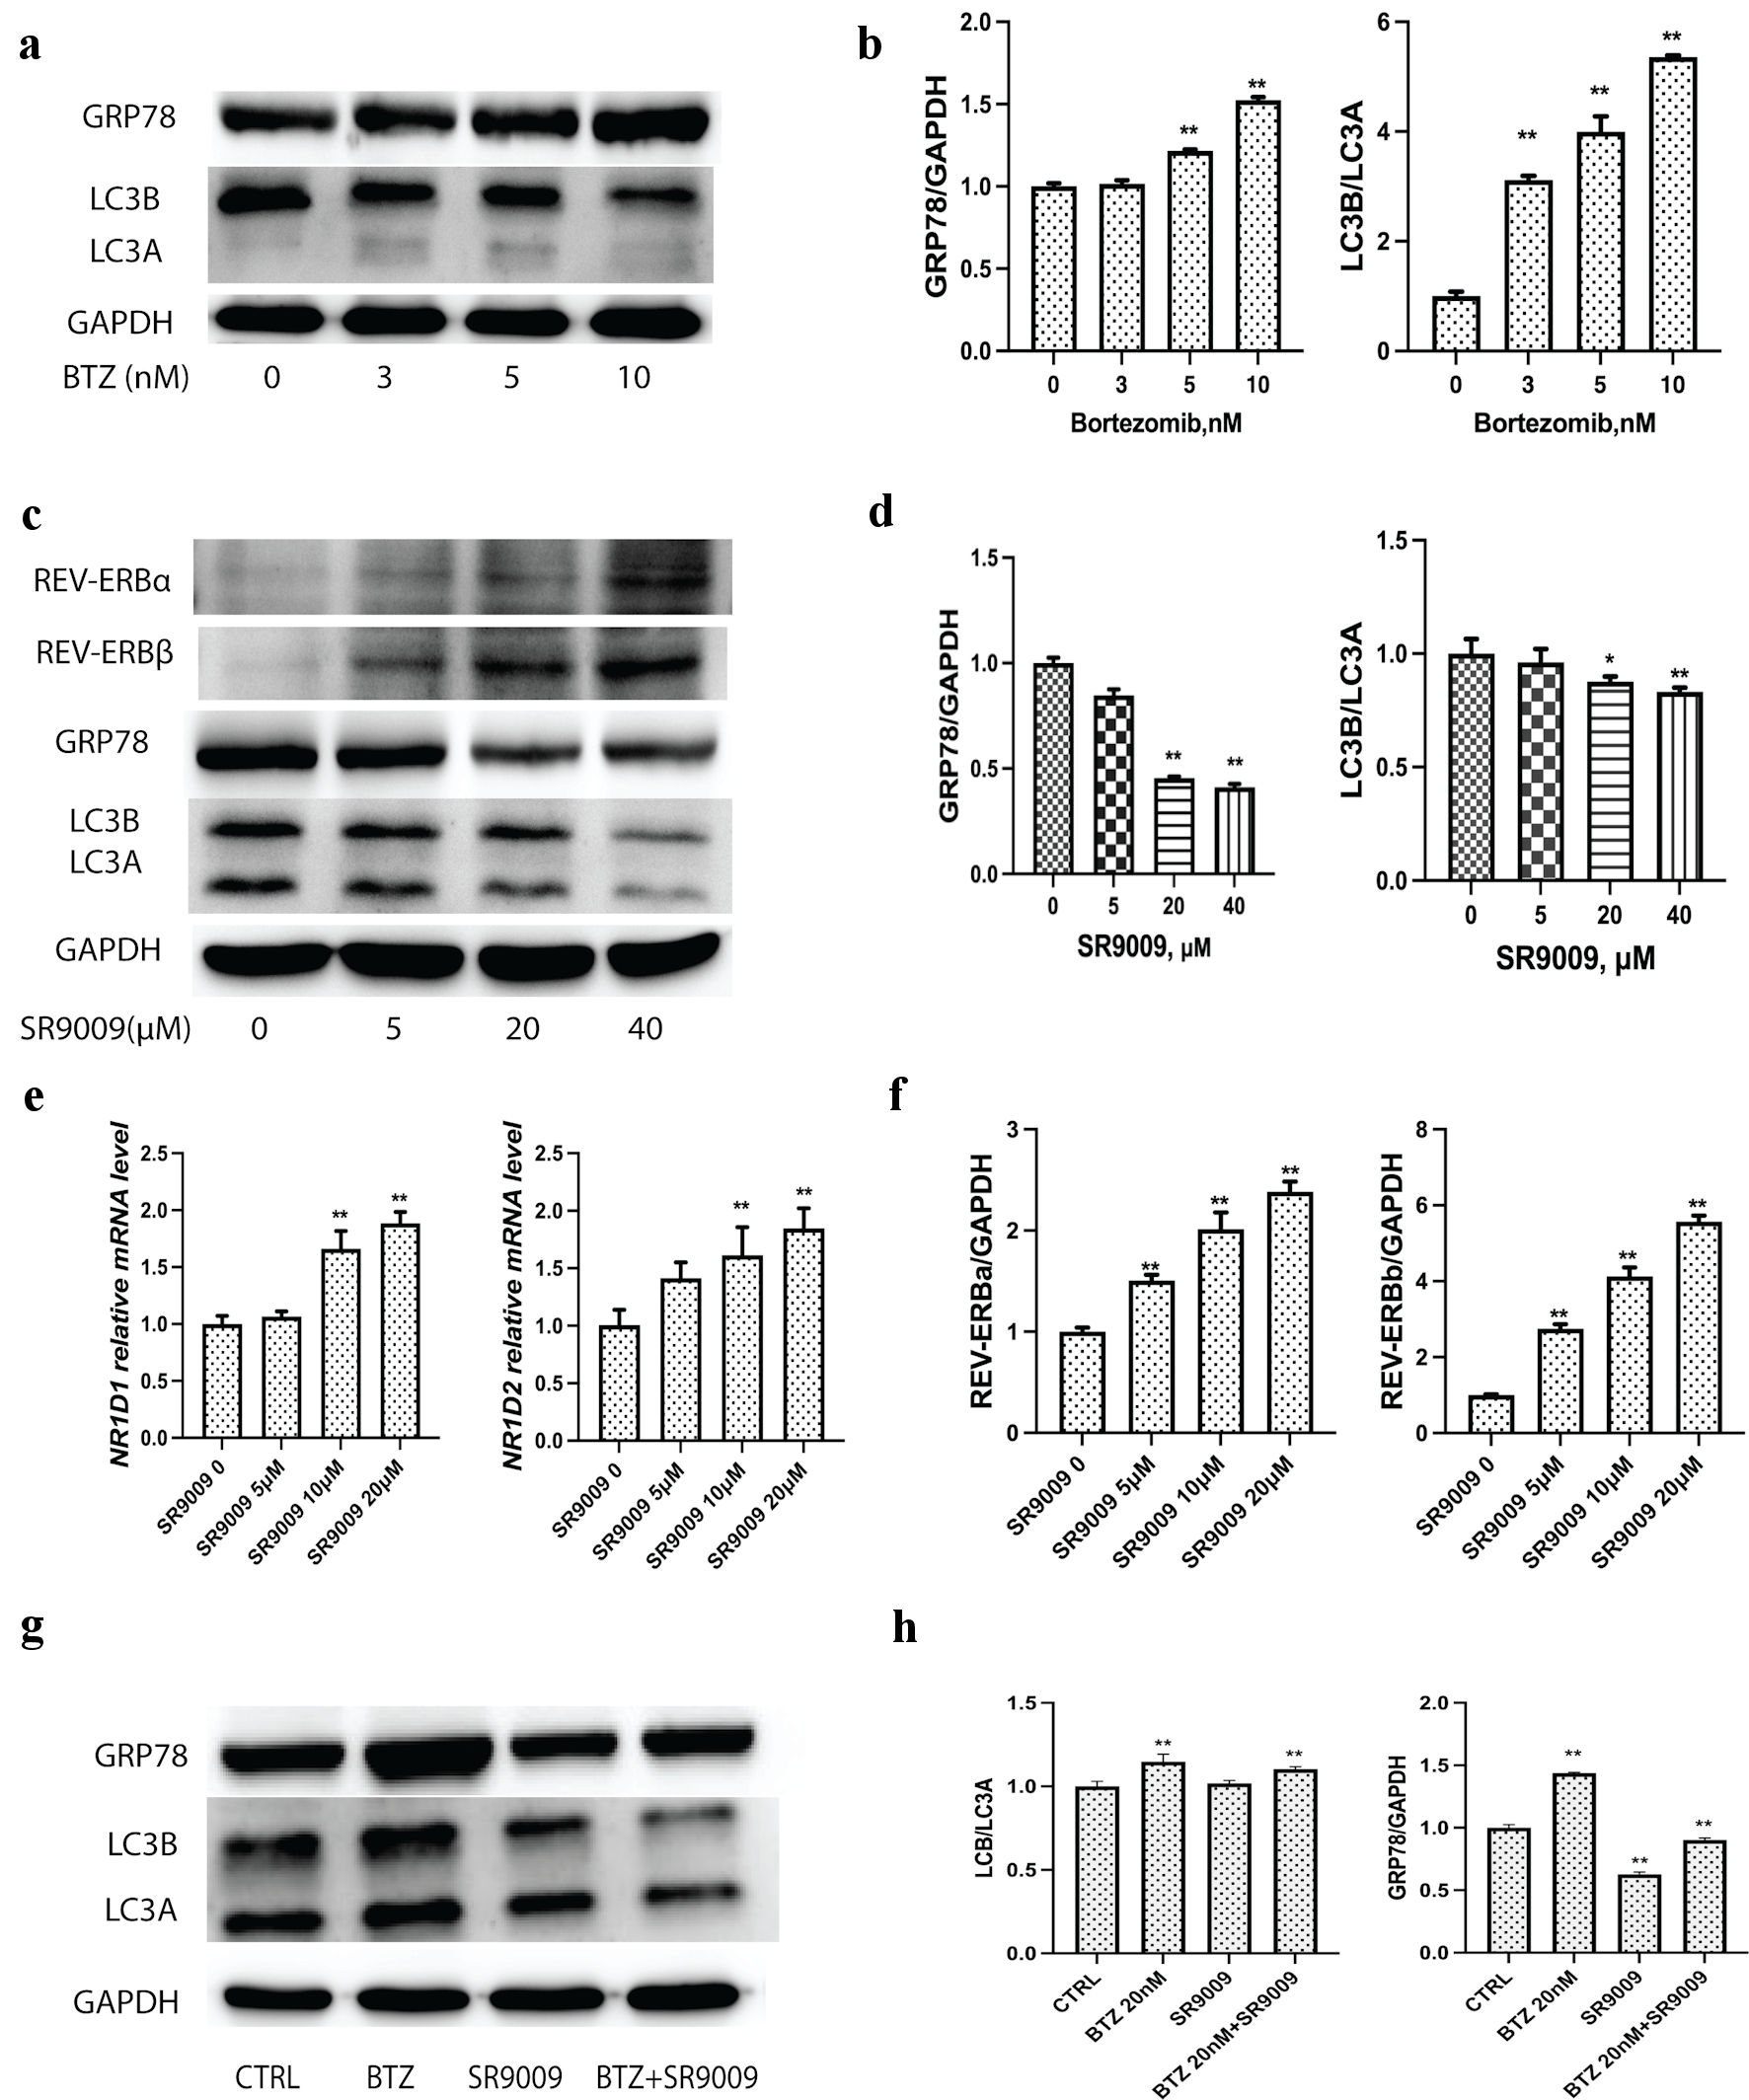
Figure 3. Bortezomib upregulated GRP78 and autophagy, while SRR9009 downregulated GRP78 and blocked autophagy induction. (a) Representative immunoblots of GRP78, LC3 and GAPDH to determine the effect of bortezomib treatment on GRP78, LC3 levels in U226 cell lysates. Cells were treated with bortezomib at indicated concentrations for 24 h; lysates were prepared and probed using a GRP78-specific and LC3-specific antibody. (b) Quantitative analysis of GRP78, LC3 and GAPDH were measured. Gray intensity of GRP78, LC3II/ LC3I from the immunoblot results were measured with ImageJ to determine the effect of bortezomib treatment on GRP78, LC3 levels in U226 cell lysates. (c) SR9009 upregulated REV-ERBα and REV-ERBβ at the protein level. SR9009 downregulated the GRP78 protein level and blocked autophagy in U226 cells by immunoblot. Cells were incubated with bortezomib with indicated concentrations. (d) Quantitative analysis of GRP78, LC3 and GAPDH to determine the effect of SR9009 treatment on GRP78, LC3 levels in U226 cell lysates. Gray intensity of GRP78, LC3II/LC3I from immunoblot results were measured with ImageJ. (e) As NR1D1 and NR1D2 agonist, SR9009 upregulated NR1D1 and NR1D2 at the mRNA level. (f) Quantitative analysis of REV-ERBα, REV-ERBβ. Gray intensity of the immunoblot results were measured with ImageJ. (g) Bortezomib upregulated GRP78, LC3I and LC3II, SR9009 downregulated GRP78, LC3I and LC3II. Combination of SR9009 could prevent bortezomib-induced GRP78 and LC3 upregulation in MM. (h) Quantitative analysis of GRP78 and LC3 were measured with ImageJ for immunoblot results. GRP78: glucose-regulated protein 78; GAPDH: glyceraldehyde-3-phosphate dehydrogenase (GAPDH); MM: multiple myeloma; BTZ: bortezomib.
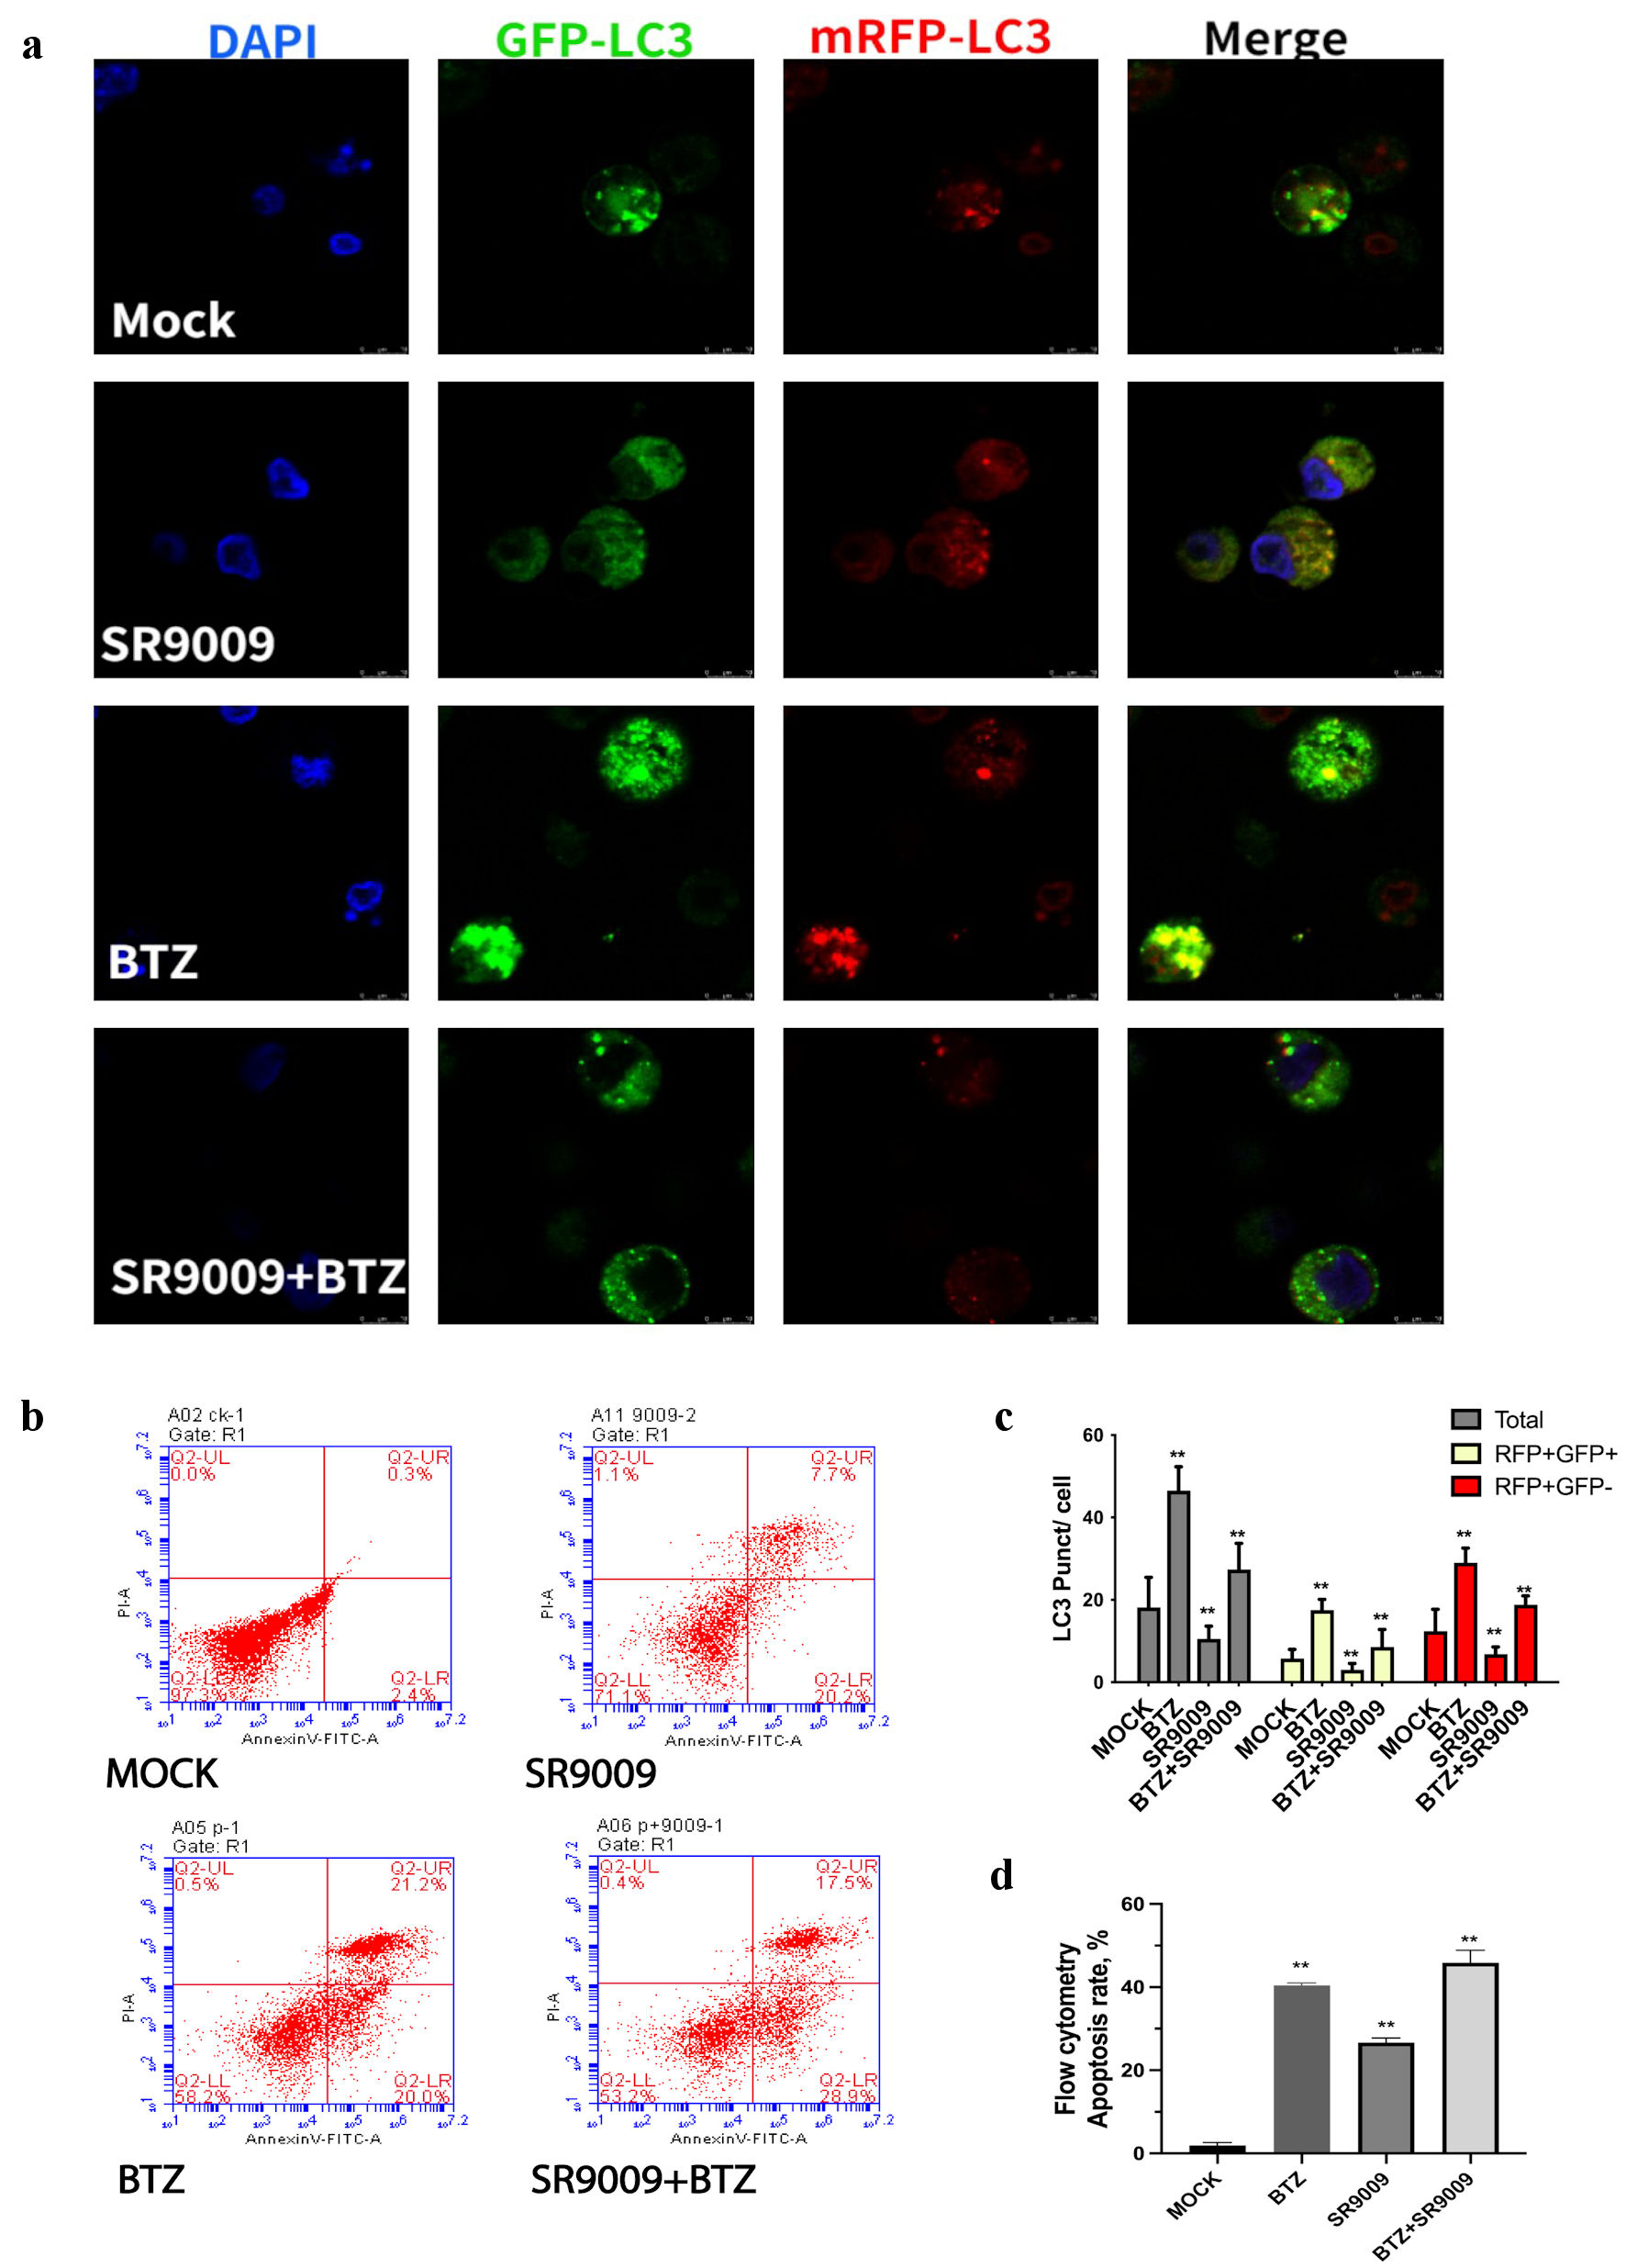
Figure 4. SR9009 decreased LC3, bortezomib increased LC3. (a) Representative images of LC3 puncta, autophagosomes were detected with confocal microscopy. Cultured U266 were transduced with dual-fluorescence labeled adenovirus-tf-LC3 and then incubated with mock, SR9009, bortezomib, and both. Representative images of green GFP-LC3 puncta indicated auto-phagosomes, whereas red mRFP-LC3 puncta indicated auto-lysosomes. SR9009 downregulated auto-phagosomes and auto-lysosomes, bortezomib upregulated auto-phagosomes and auto-lysosomes. (b) Multiple myeloma (MM) cell lines were treated with mock, bortezomib, SR9009, bortezomib + SR9009 at the indicated concentrations for 24 h and the relative percent of cells undergoing apoptosis was determined by annexin V-fluorescein isothiocyanate (V-FITC) staining and flow cytometry. (c) The relative amount of green and red fluorescence was determined using ImageJ software (National Institutes of Health, Bethesda, MD, USA). The bar graph indicated mean numbers of GFP-LC3 and mRFP-LC3 per cell obtained from three experiments. (d) Quantitative analysis of flowcytometry apoptosis assay. Both bortezomib and SR9009 generated an increase in annexin-positive cells. DAPI: 4’,6-diamidino-2-phenylindole; BTZ: bortezomib.
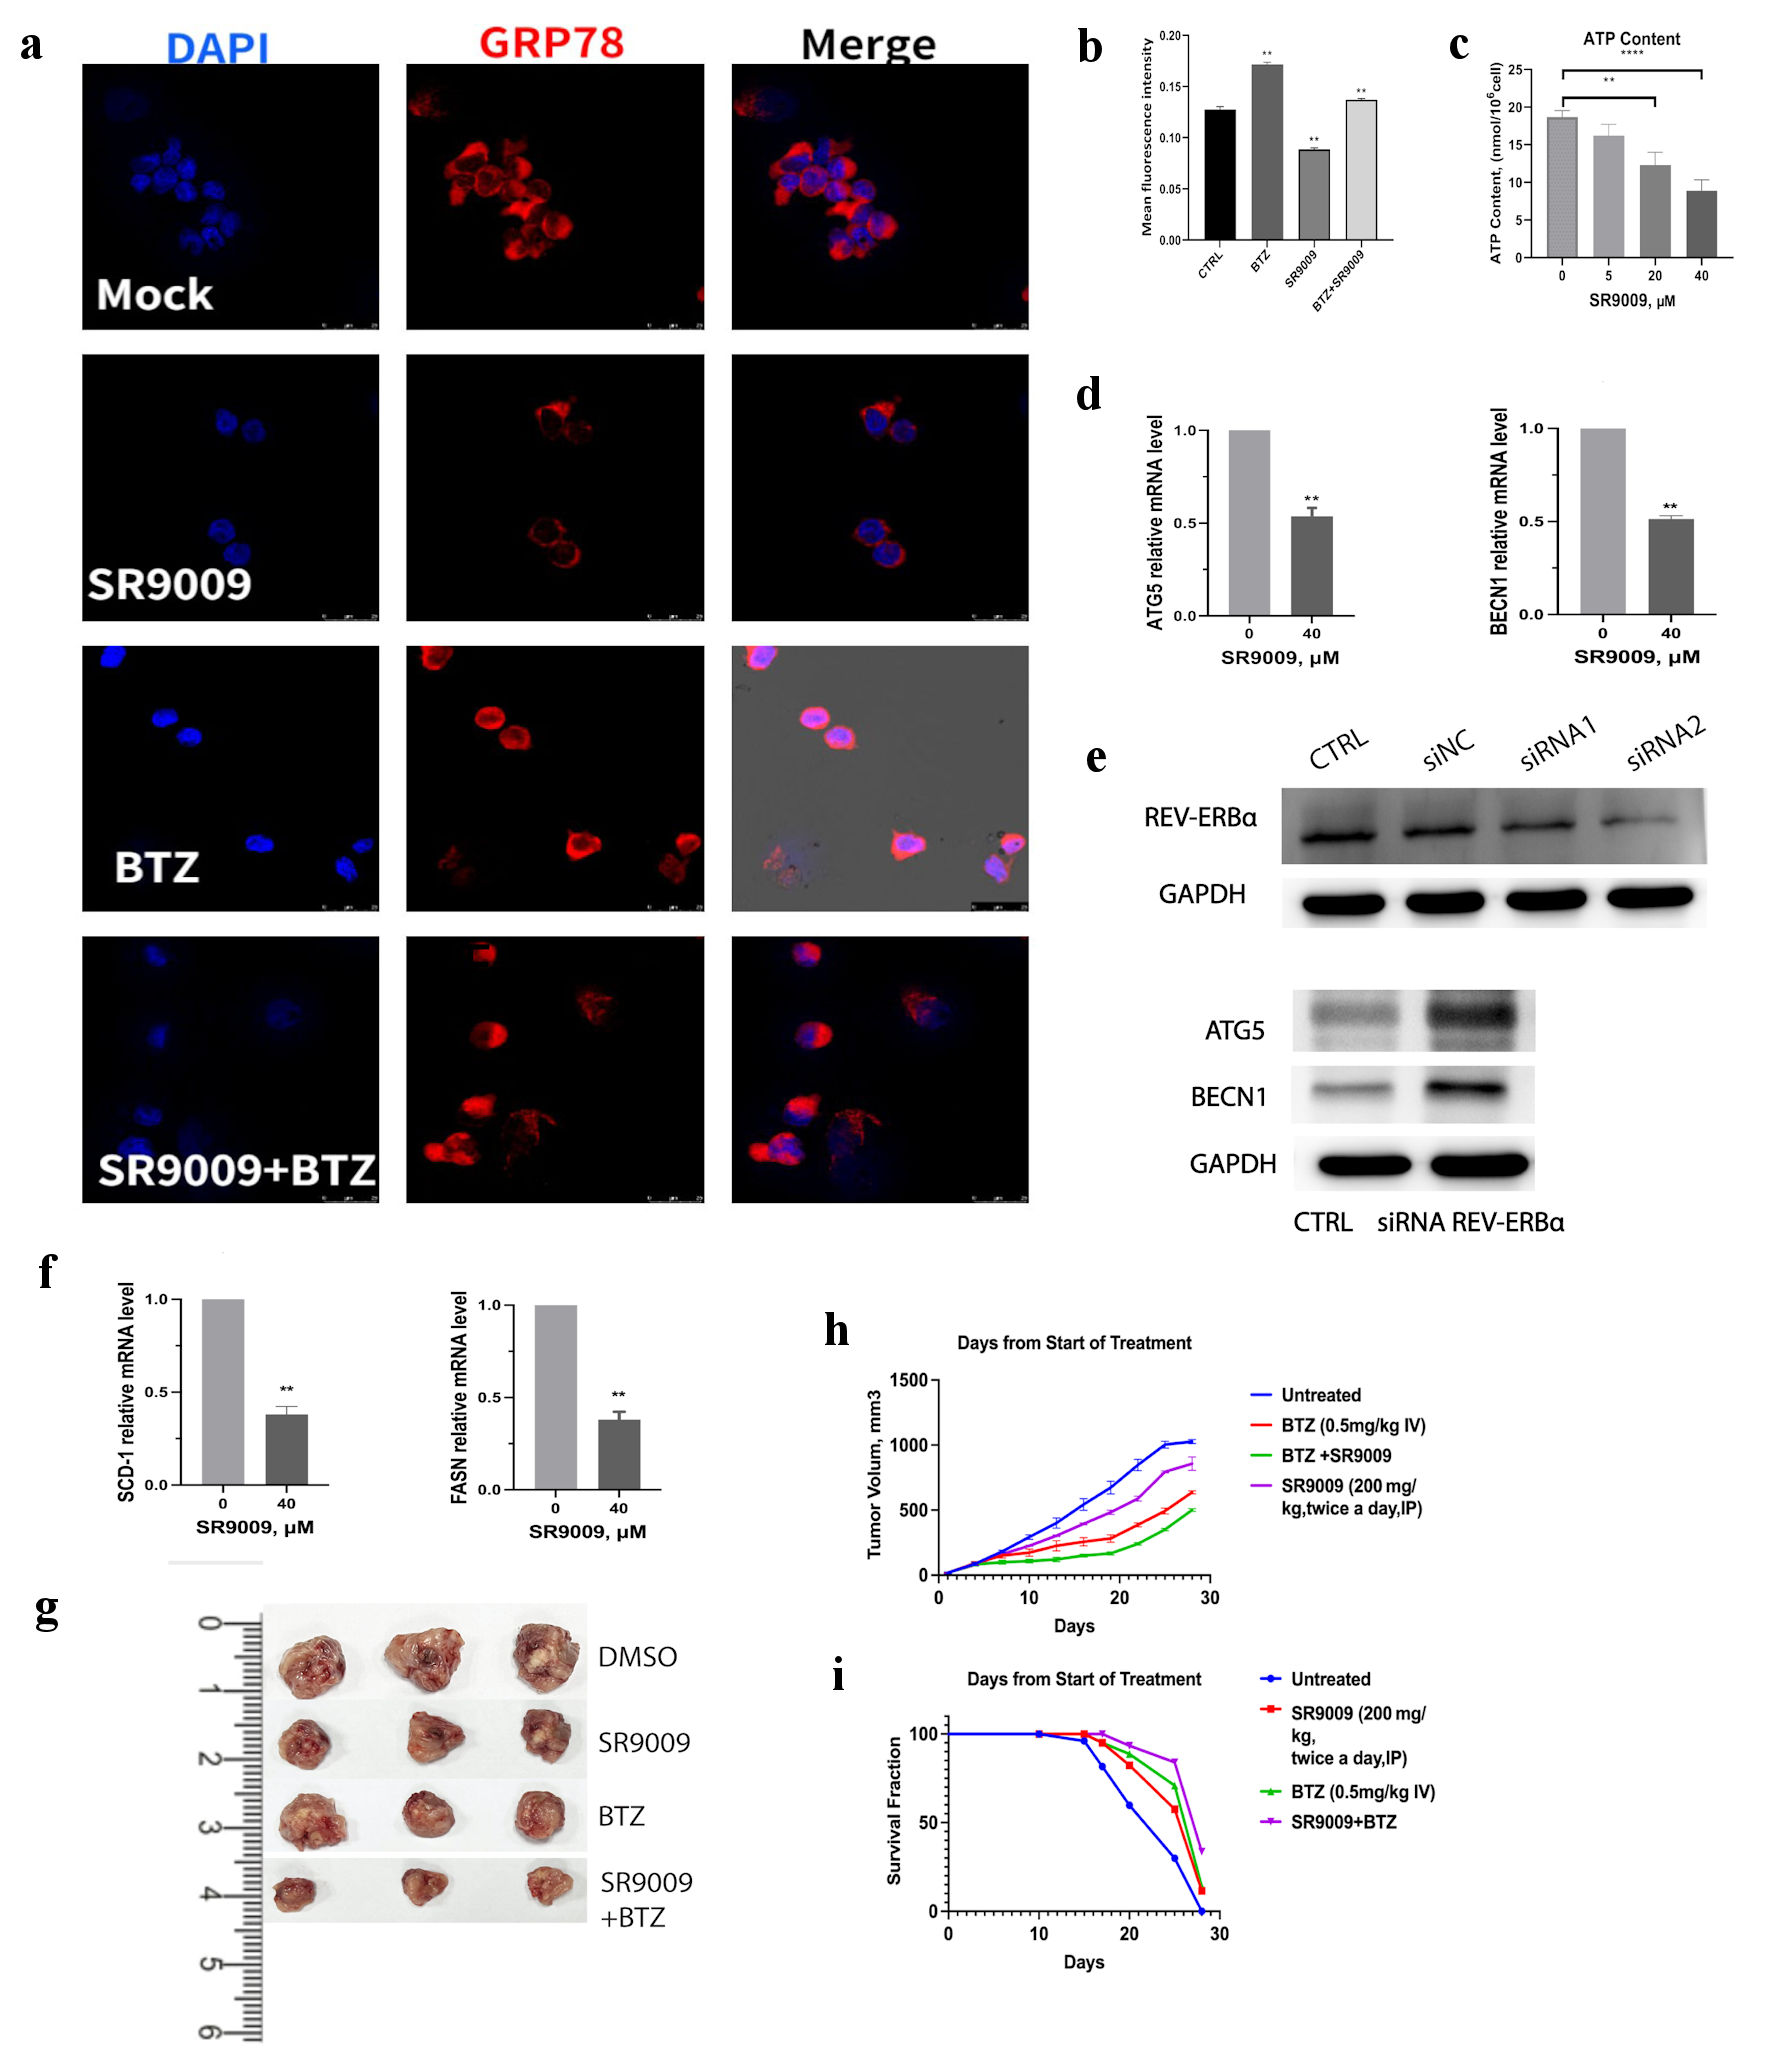
Figure 5. SR9009 decreased core autophagy genes, blocked de novo lipogenesis and showed synergistic effect with bortezomib in vivo. (a) Multiple myeloma (MM) was incubated with human GRP78-specific monoclonal antibody and observed with confocal assay for GRP78 protein in U266 cell lines. U266 cells were treated with mock, SR9009 (40 µM), bortezomib (5 nM), bortezomib (5 nM) with SR9009. (b) Quantitative analysis of GRP78 immunofluorescence intensity were measured with ImageJ. (c) REV-ERBs agonists SR9009 decreased mitochondria ATP production in a dose-dependent manner. Statistically significant differences were indicated by (**P < 0.01, ***P < 0.001). (d) SR9009 downregulated core autophagy genes ATG5 and BENC1 at the mRNA level with qRT-PCR. (e) Knockdown of REV-ERBα by siRNA, siRNA2 was used for the next experiments. REV-ERBα knockdown leads to upregulation of ATG5 and BENC1 at the protein level with immunoblot results. (f) SR9009 downregulated two essential enzymes for de novo lipogenesis SCD1 and FASN at the mRNA level with qRT-PCR. (g) Representative tumor images in four groups. U266 cells (4 × 10⁶/mouse) were subcutaneously injected in the flanks of 5-week-old nonobese diabetic/severe combined immunodeficient (NOD/SCID) female mice. Mice were then randomly distributed into four groups (3/group). After the formation of palpable tumors, treatment was commenced. Mice received intravenous injection of either vehicle (phosphate-buffered saline containing 10% dimethyl sulfoxide (DMSO)) or bortezomib (0.5 mg/kg in phosphate-buffered saline, 10% DMSO) administered with or without SR9009 (600 µg/mL). Bortezomib was administered intravenously with or without SR9009 for 5 days. (h) Tumor volume was calculated using a caliper. Mice were euthanized 28 days after treatment. Tumor volume was evaluated from the first day of treatment. Shown is the average of replicate measurements. (i) Kaplan-Meier survival curves after treated with either vehicle, SR9009, bortezomib or both. SCD1: stearoyl-CoA desaturase 1; FASN: fatty acid synthase; qRT-PCR: quantitative real-time polymerase chain reaction; ATP: adenosine triphosphate; DAPI: 4’,6-diamidino-2-phenylindole; BTZ: bortezomib.
Table
Table 1. Human Primer Sequences for qRT-PCR
| SCD1: stearoyl-CoA desaturase 1; FASN: fatty acid synthase; qRT-PCR: quantitative real-time polymerase chain reaction. |
| NR1D1-F: 5′-CGGTTCTTCAGCACCAGAG-3′ |
| NR1D2-R: 5′-CATTTCTATATTTGAAAGTAGCCCAAT-3′ |
| SCD1-F: 5′-GACGATGAGCTCCTGCTGTT-3′ |
| SCD1-R: 5′-CTCTGCTACACTTGGGAGCC-3′ |
| FASN-F: 5′-CATCGGCTCCACCAAGTC-3′ |
| FASN-R: 5′-GCTATGGAAGTGCAGGTTGG-3′ |
| BECN1-F: 5′-CCATGCAGGTGAGCTTCGT-3′ |
| BECN1-R: 5′-GAATCTG CGAGAGACACCATC-3′ |
| ATG5-F: 5′-CCGGTGGCTTCC TACTGTTA-3′ |
| ATG5-R: 5′-AAGGCAGCGTTGATGACC-3′ |