Figures
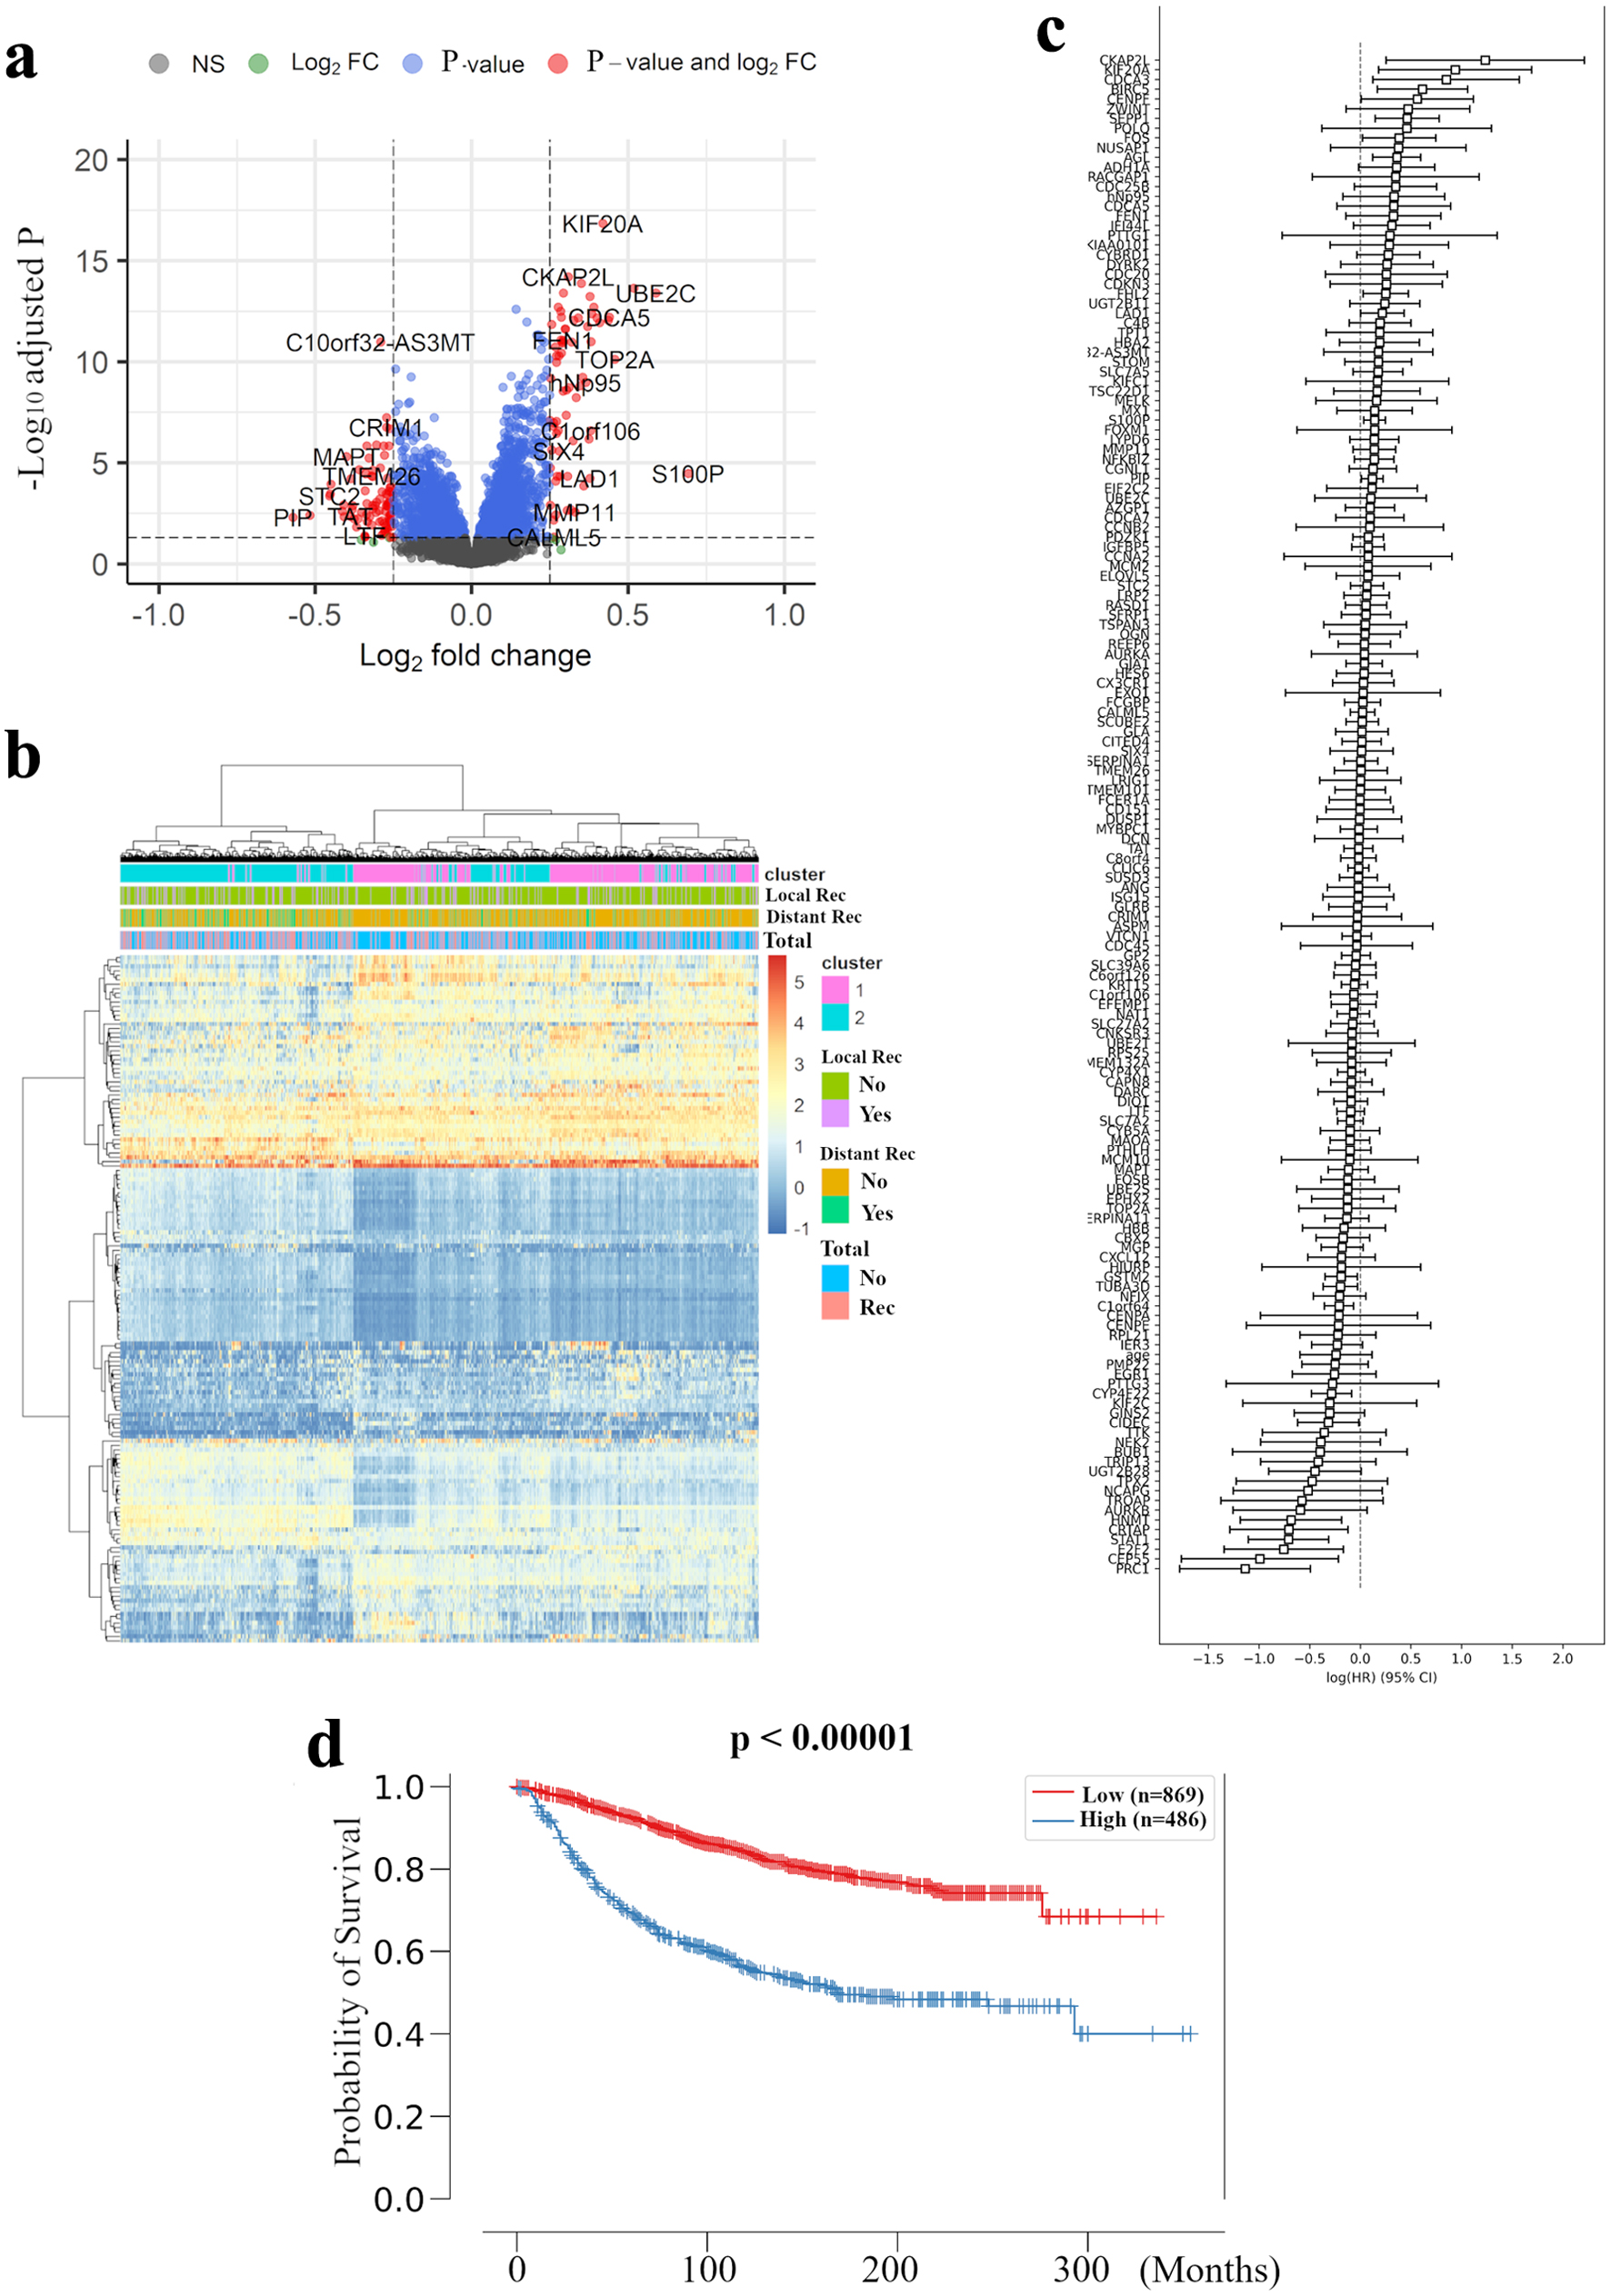
Figure 1. Extraction of all prognosis-related genes and preparation of a recurrence prediction model using machine learning. (a) Volcano plot illustrating the differentially expressed mRNAs of BC patients comparing with and without distant recurrence in the METABRIC HR+ HER2- cohort are shown. X-axes: log2 FC; Y-axes: -log 10 adjusted P-value from limma analysis. mRNAs with adjusted P-value < 0.05 and log2 FC > 0.25 are marked in red, with adjusted P-value > 0.05 and log2 FC < 0.25 in green, with adjusted P-value < 0.05 and log2 FC < 0.25 in blue, all others in black. (b) A heatmap illustrating the expression intensity of 155 genes extracted by (a), with colors ranging from red to blue as indicated in the key are shown. Both rows and columns are clustered using correlation distance and average linkage. (c) Logarithm of the integrated hazard ratio for all 155 genes extracted by (a) are shown. The complete list of these genes identified by meta-analysis is provided in Supplementary Material 1 (www.wjon.org). (d) Kaplan-Meier curves for distant RFS in METABRIC HR+ HER2- patients based on high and low risk in recurrence prediction model are shown. BC: breast cancer; METABRIC: Molecular Taxonomy of Breast Cancer International Consortium; FC: fold change; RFS: recurrence free survival; HR+: hormone receptor positive; HER2: human epidermal growth receptor 2; LRM: logistic regression model.
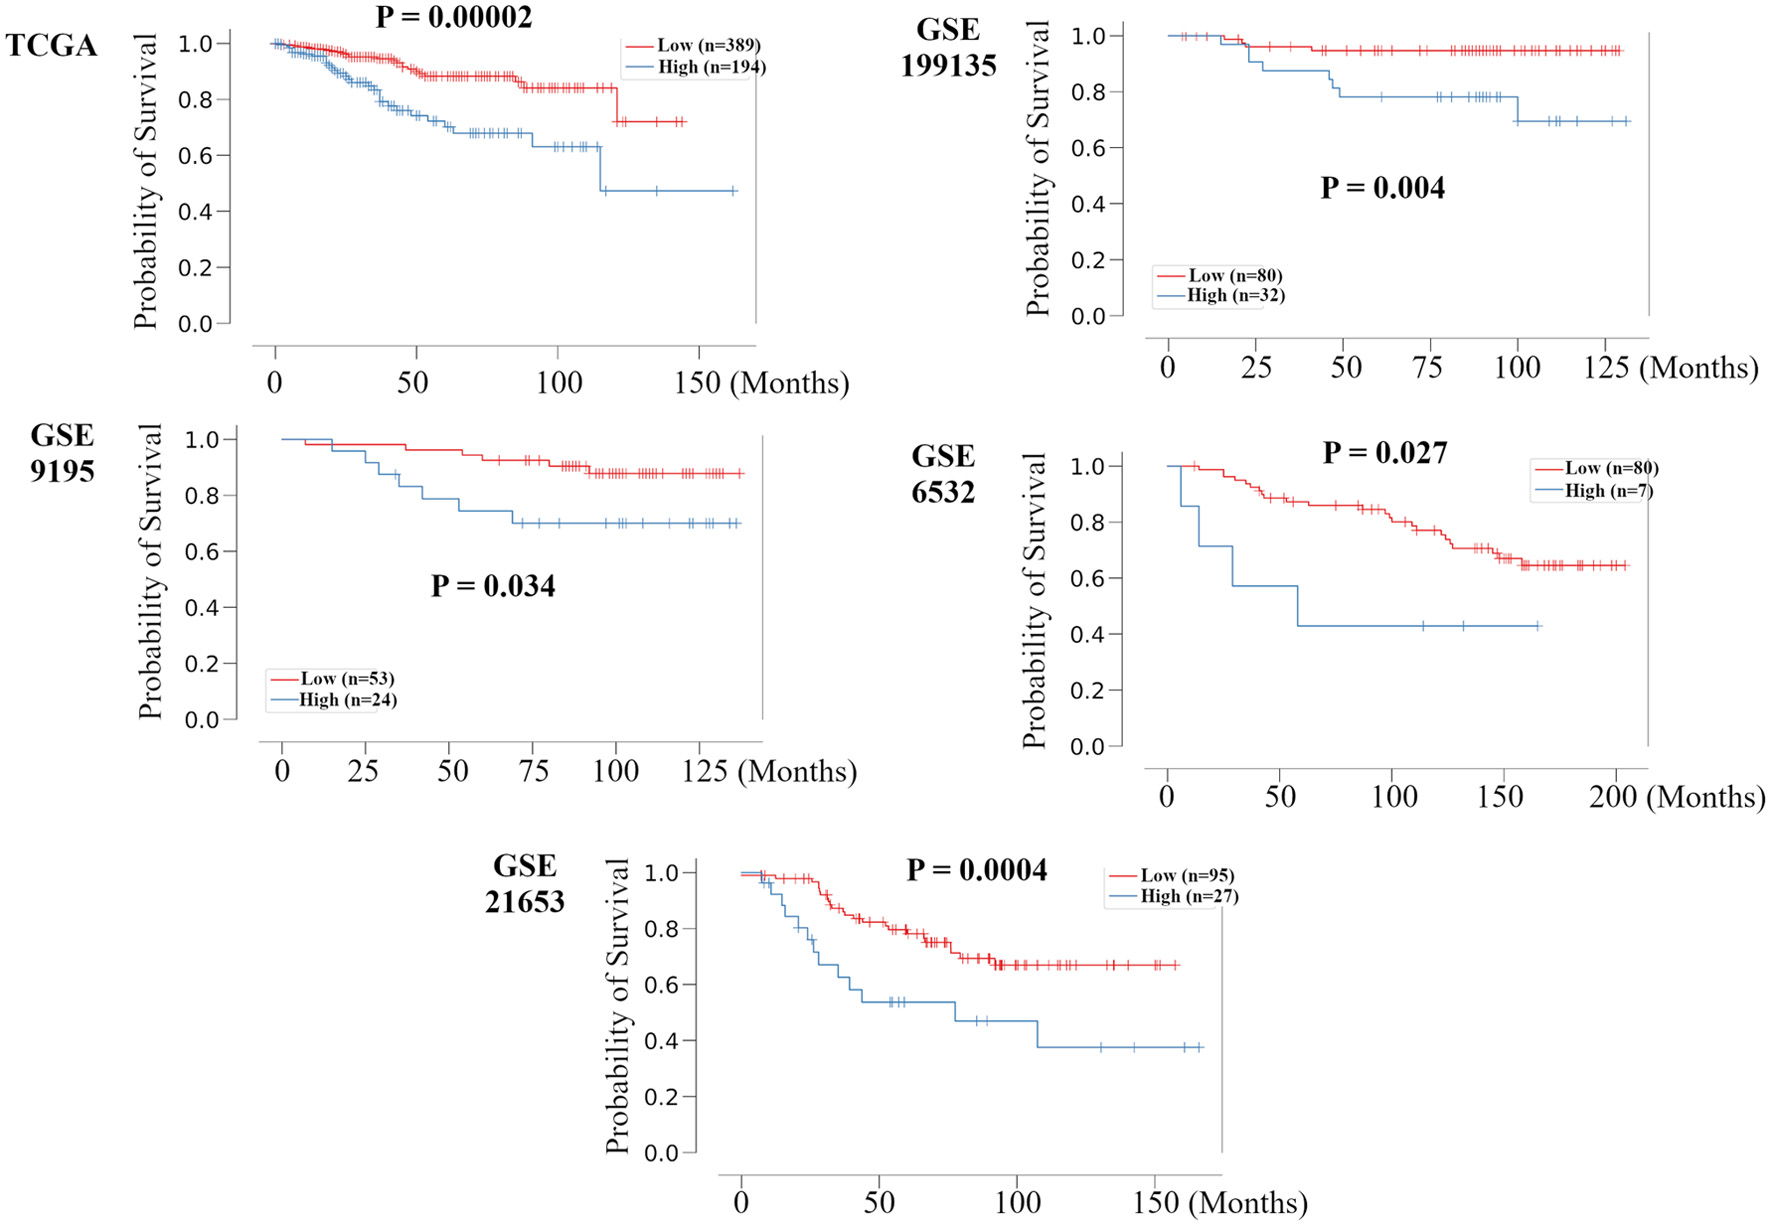
Figure 2. Validation of the relationship between the recurrence prediction model and survival rate in other HR+ HER2- BC cohorts. Kaplan-Meier plots of the association of the recurrence prediction model with RFS for the recurrence prediction model, applied on the TCGA, GSE199135, GSE9195, GSE6532, and GSE21653 are shown. HR+: hormone receptor positive; HER2: human epidermal growth receptor 2; BC: breast cancer; RFS: recurrence free survival; TCGA: The Cancer Genome Atlas; FC: fold change.
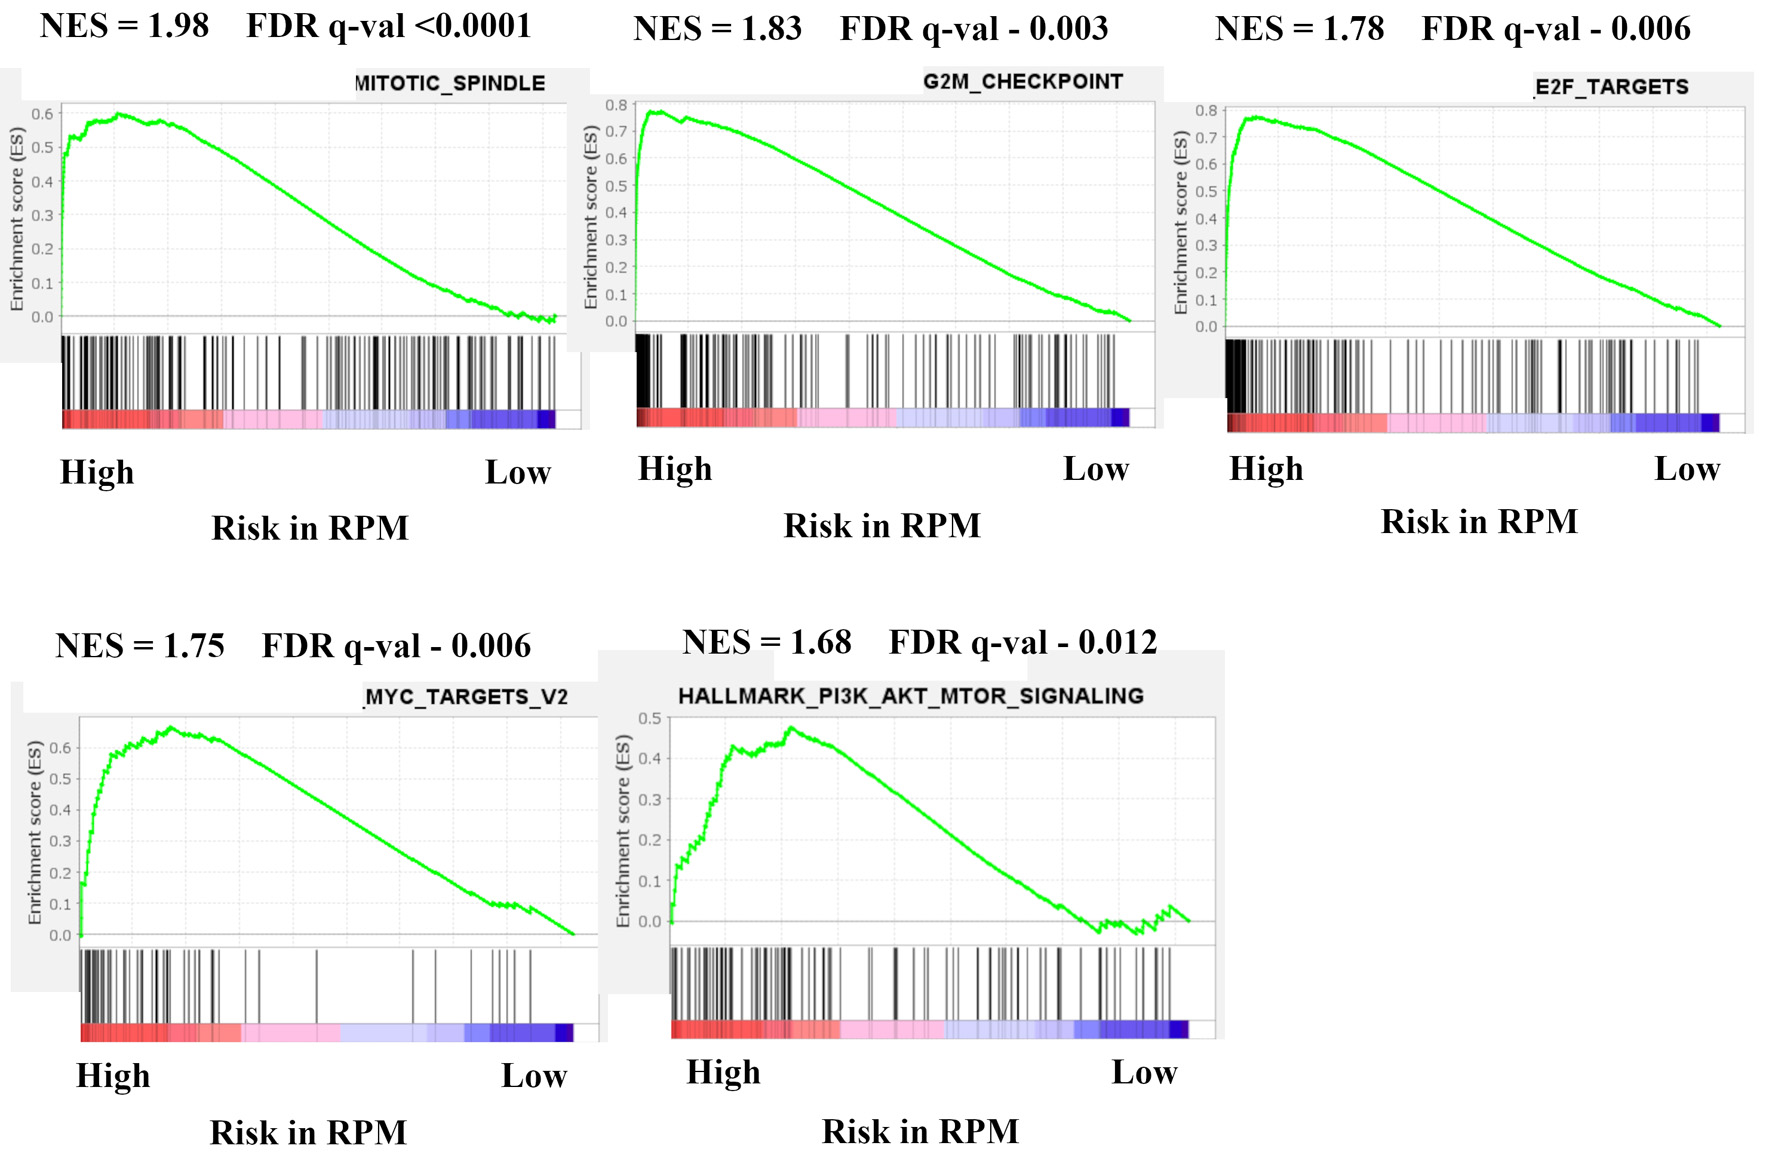
Figure 3. Gene expression profiles based on high and low risk in recurrence prediction model. GSEA of BC patients in METABRIC HR+ HER2- cohort comparing high and low risk in recurrence prediction model are shown. Upregulated pathways included mitotic spindle, G2/M check point, E2F targets, MYC target v2, and PI3K-AKT-mTOR signaling in high risk compared with low risk in LRM. The significance of each pathway was classified by a threshold of NES > 1.6 or < -1.6 and FDR q-value < 0.025. GSEA: Gene Set Enrichment Analysis; BC: breast cancer; METABRIC: Molecular Taxonomy of Breast Cancer International Consortium; HR+: hormone receptor positive; HER2: human epidermal growth receptor 2; mTOR: mammalian target of rapamycin; LRM: logistic regression model; NES: normalized enrichment score; FDR: false discovery rate.
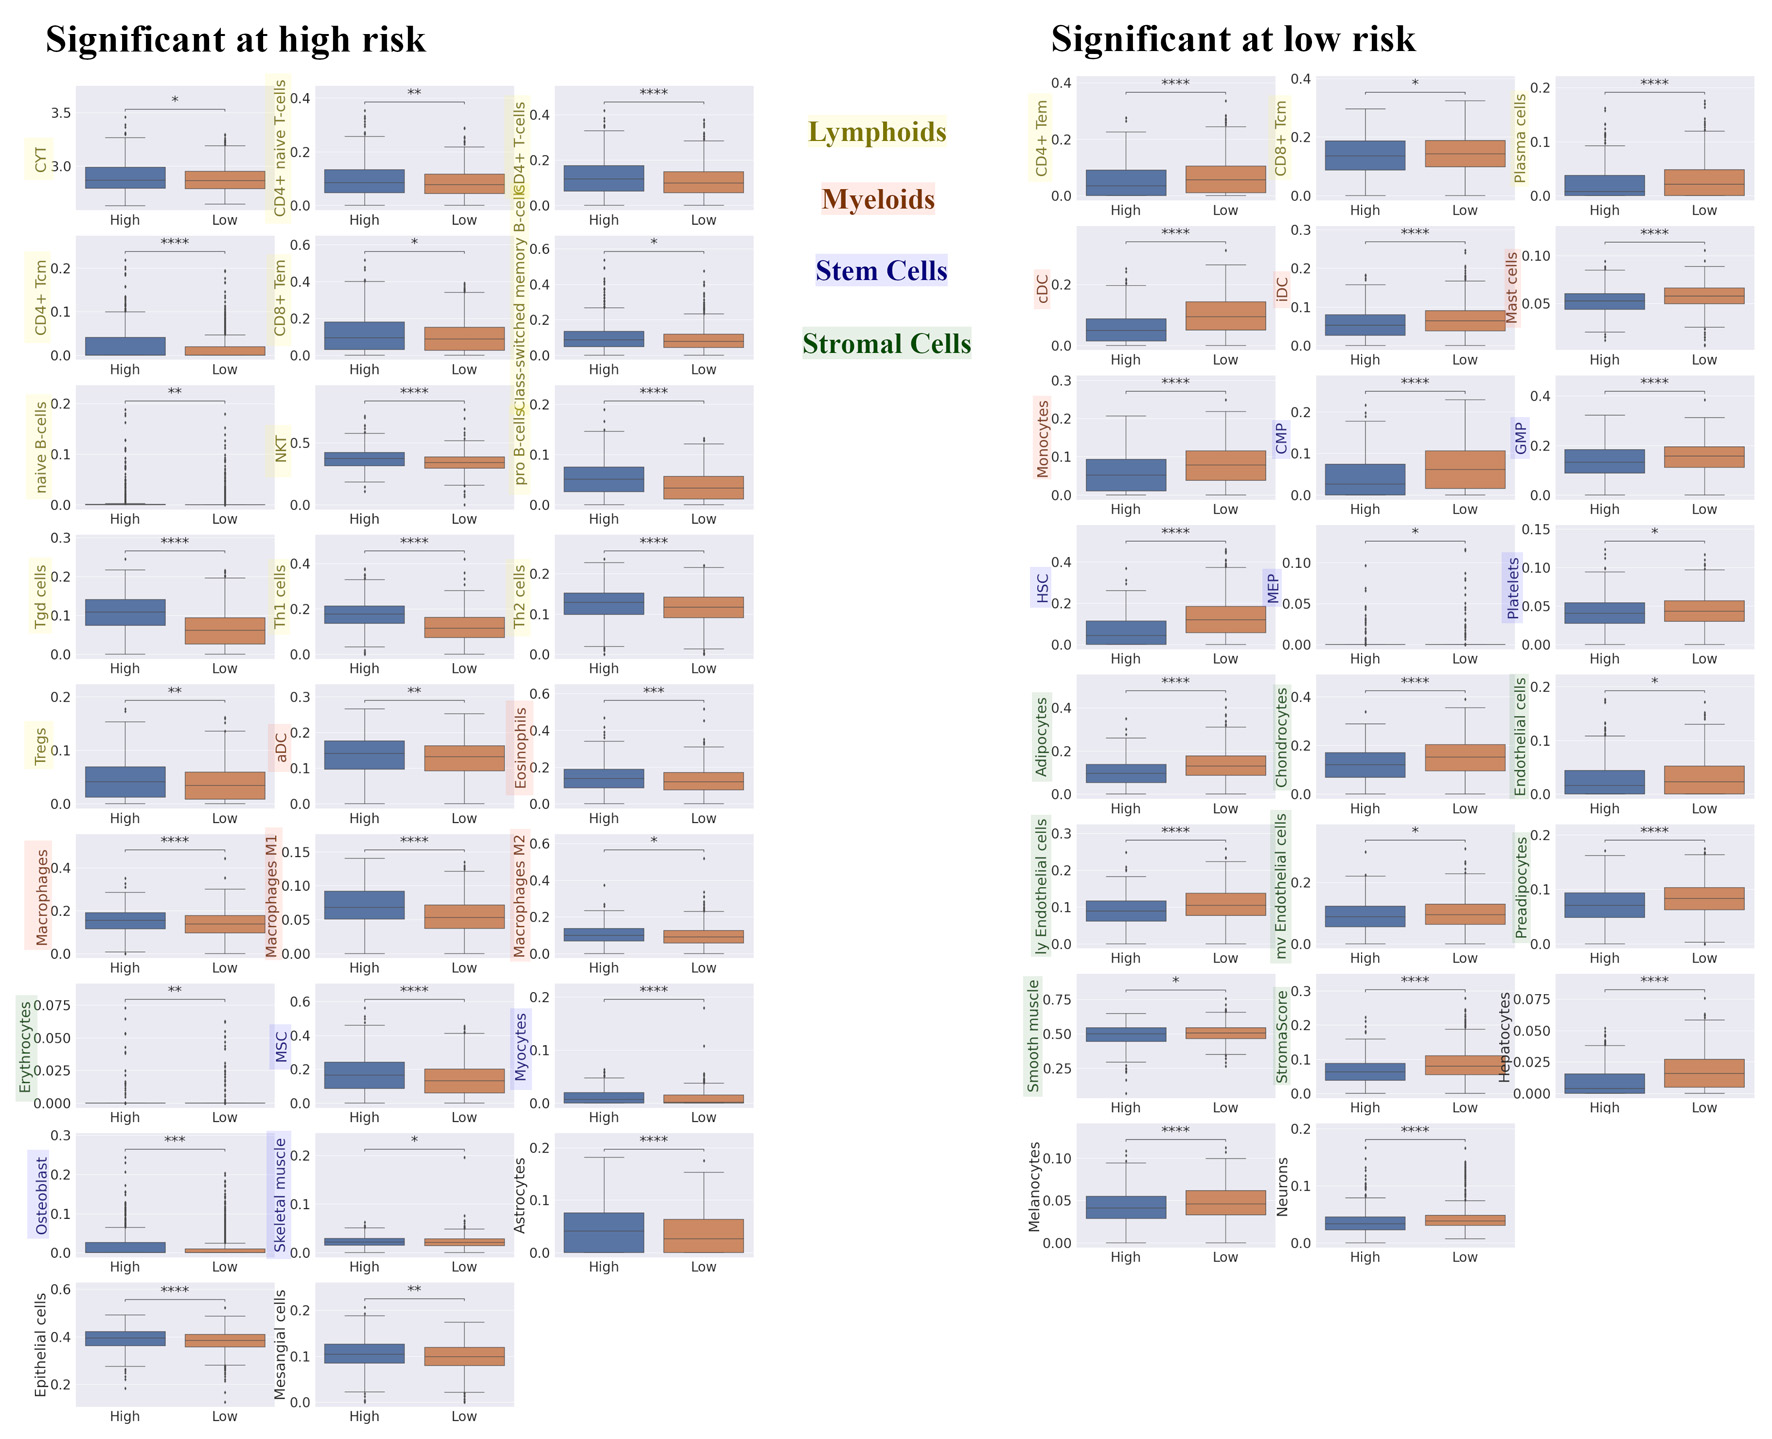
Figure 4. Differences in TME compositions for high and low risk in recurrence prediction model. We explored the difference in TME composition between high- and low- risk in recurrence prediction model utilizing xCell. Box plot of the relationship between recurrence risk in recurrence prediction model and TME in METABRIC HR+ HER2- cohort are shown. The left panel shows the cell fraction with up-regulation in high risk, and the right panel shows the cell fraction with up-regulation in low risk. ****P < 0.0001, ***P < 0.001, **P < 0.01, *P < 0.05. TME: tumor microenvironment; METABRIC: Molecular Taxonomy of Breast Cancer International Consortium; HR+: hormone receptor positive; HER2: human epidermal growth receptor 2; CYT: immune cytolytic activity; CD4+ tcm: the central memory CD4+ T cell; CD8+ tem: the effector memory CD8+ T cell; NKT: natural killer T cells; Tregs: regulatory T cells; aDC: activated dendritic cell; MSC: mesenchymal stem cell; CD4+ tem: the effector memory CD4+ T cell; CD8+ tcm: the central memory CD8+ T cell; cDC: conventional dendritic cell; iDC: immature dendritic cell; CMP: common myeloid progenitor; GMP: granulocyte-macrophage progenitor; HSC: hematopoietic stem cell; MEP: megakaryocyte-erythroid progenitor.
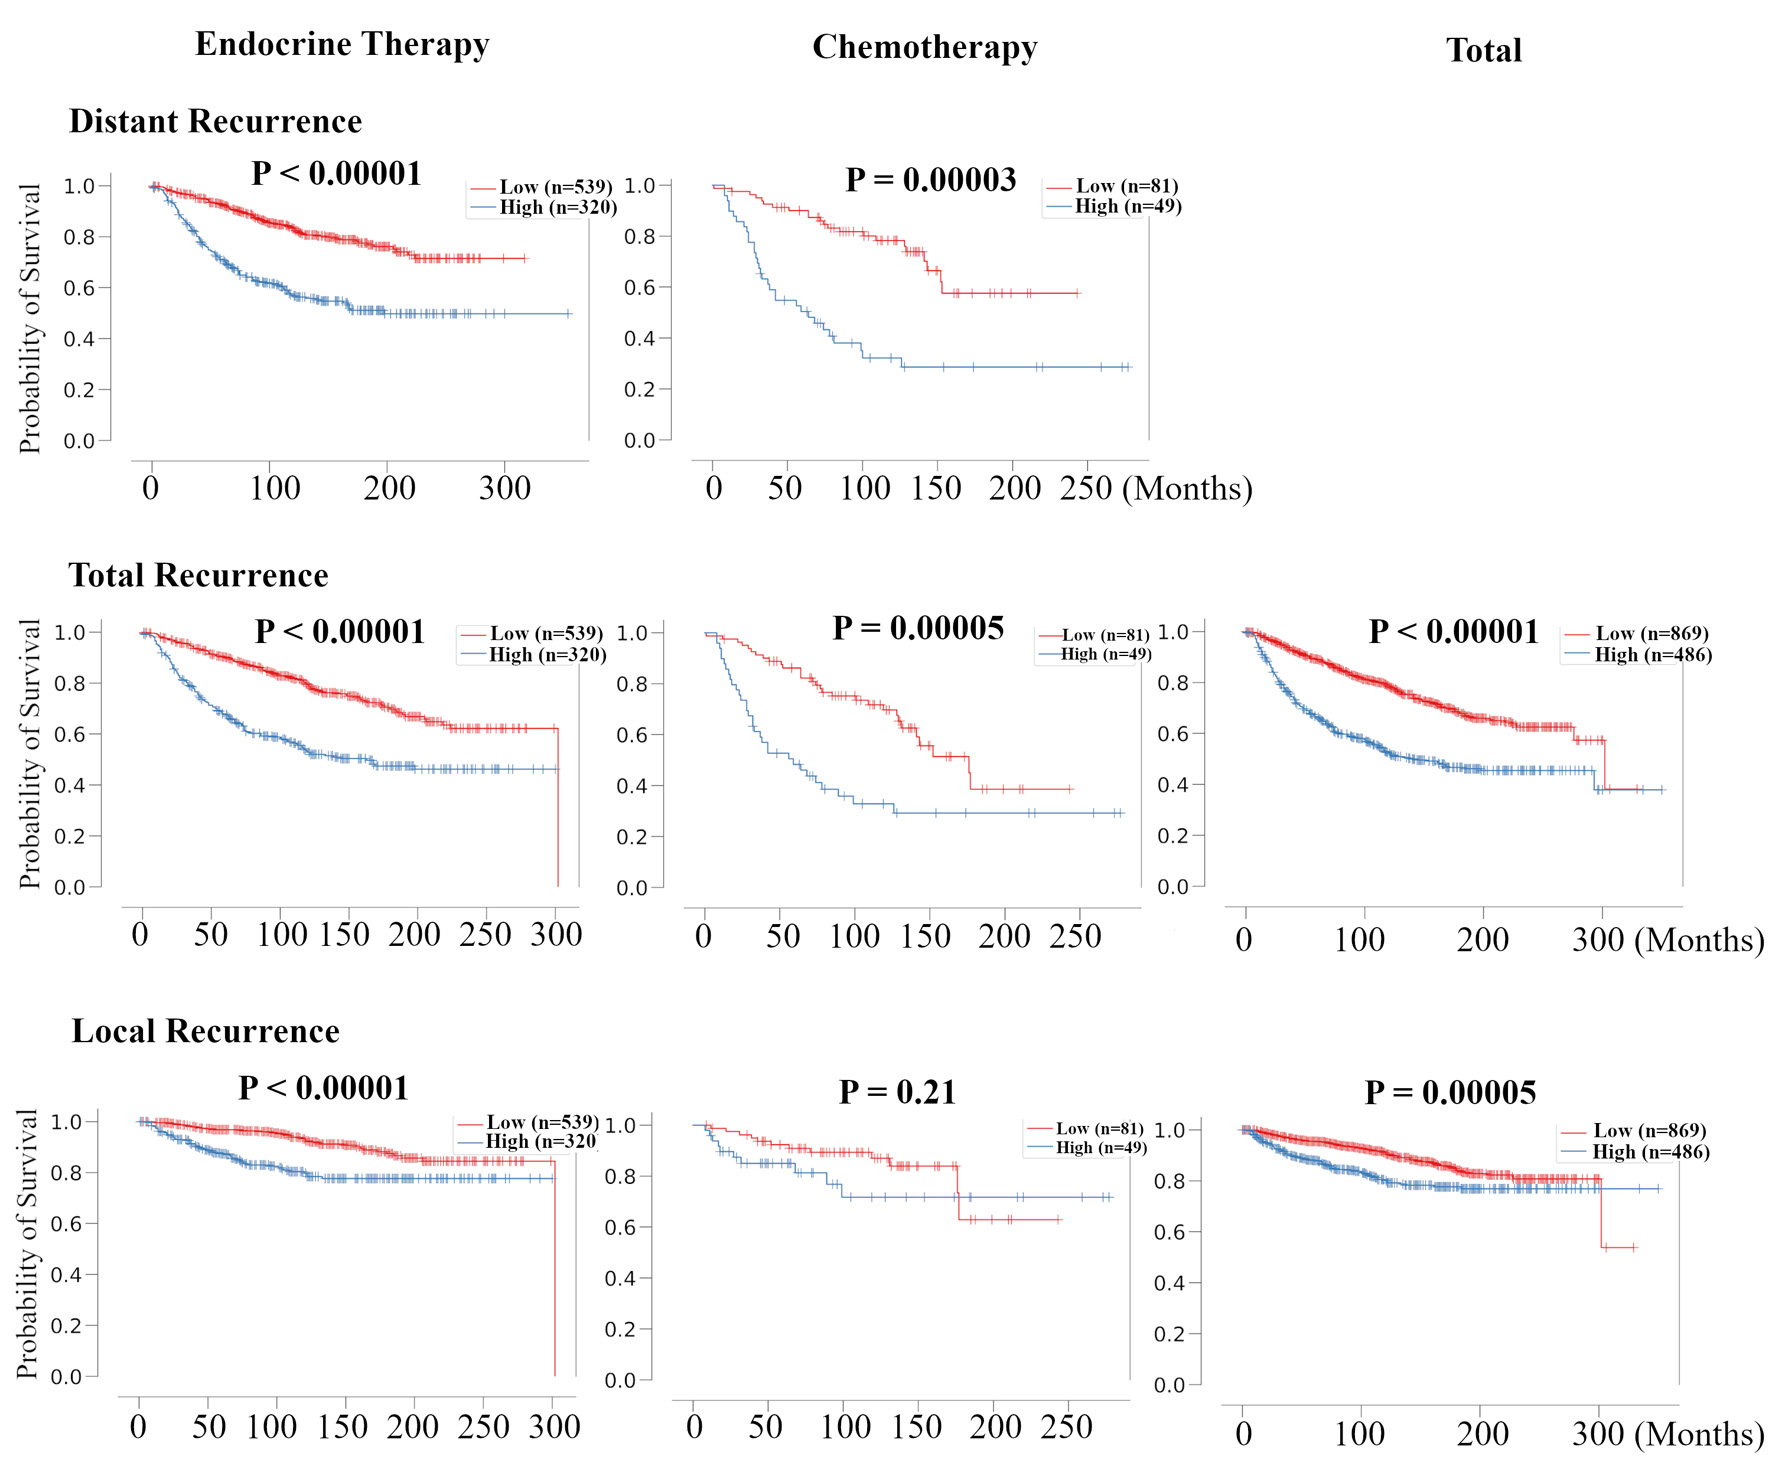
Figure 5. Validation of the relationship between risk classification in recurrence prediction model and the therapeutic effect of chemotherapy and endocrine therapy for HR+ HER2- BC patients. Kaplan-Meier plots of distant RFS, total RFS, and local RFS of the association between recurrence risk in recurrence prediction model and chemotherapy- and endocrine-treated patients in METABRIC HR+ HER2- cohort are shown. For total RFS and local RFS, Kaplan-Meier plots of total recurrence are shown on the far right. HR+: hormone receptor positive; HER2: human epidermal growth receptor 2; RFS: recurrence free survival; METABRIC: Molecular Taxonomy of Breast Cancer International Consortium.
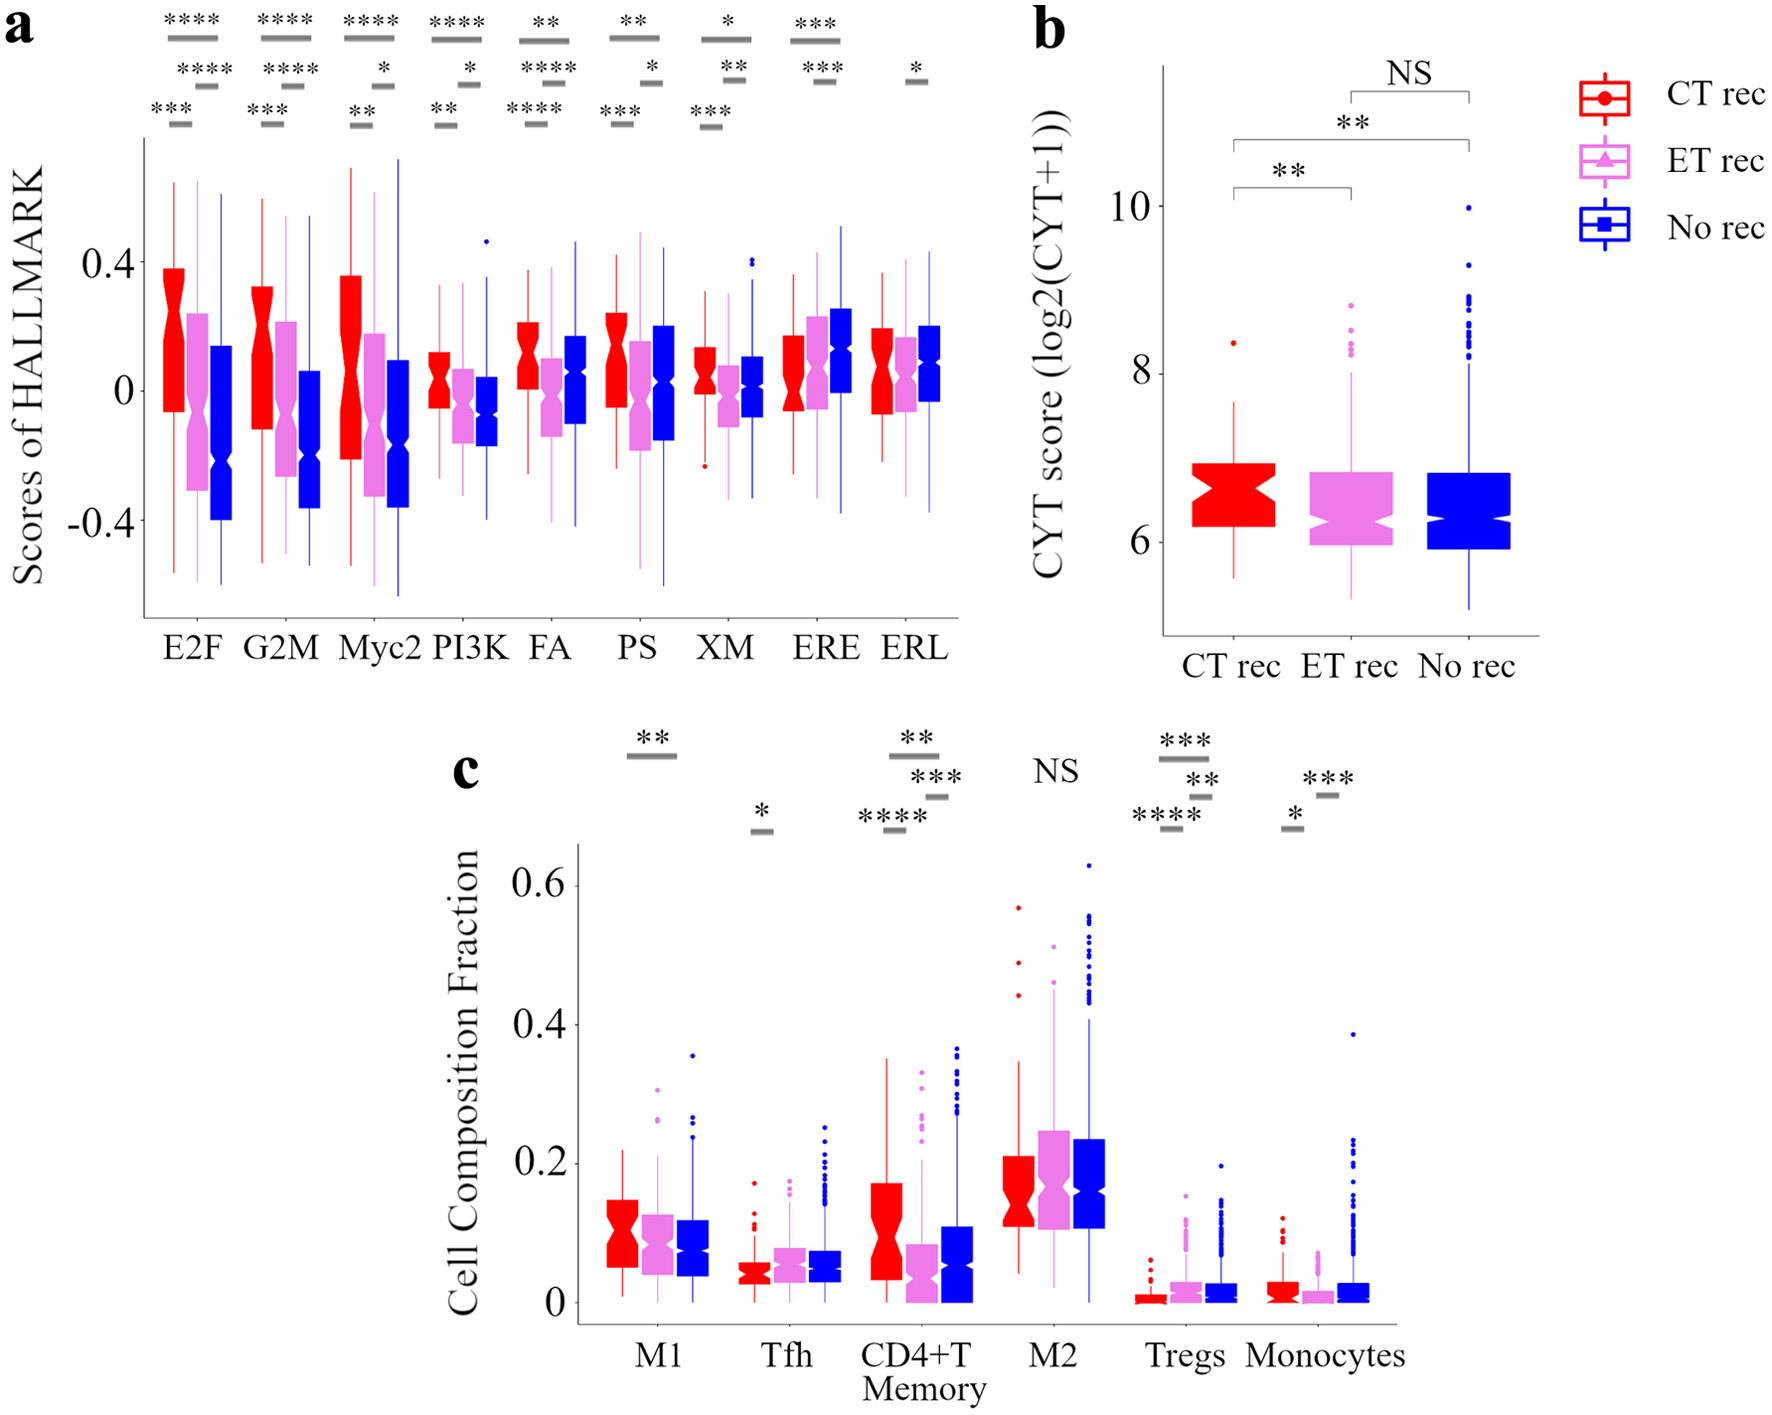
Figure 6. Analysis of the tumor microenvironment with no additional effect of chemotherapy and endocrine therapy. Box plots of the relationship between recurrence by treatments and signaling pathways in GSVA (a) and CYT (b) and immune cell composition (c) in METABRIC HR+ HER2- cohort are shown. Based on treatments and recurrence, we classified patients into following three categories: a group of patients who were treated with ET and CT but relapsed as CT rec, a group of patients who were treated with ET alone but relapsed as ET rec, and a group of patients who were treated with ET with or without CT and not relapsed as No rec. ****P < 0.0001, ***P < 0.001, **P < 0.01, *P < 0.05. METABRIC: Molecular Taxonomy of Breast Cancer International Consortium; GSVA: Gene Set Variant Analysis; CYT: immune cytolytic activity; ET: endocrine therapy; CT: chemotherapy; E2F: E2F_TARGETS; G2M: G2M_CHECKPOINT; Myc2: MYC_TARGETS_v2; PI3K: PI3K_AKT_MTOR_SIGNALING; FA, FATTY_ACID_METABOLISM; PS: PROTEIN_SECRETION; XM: XENOBIOTIC_METABOLISM; ERE: ESTROGEN_RESPONSE_EARLY; ERL: ESTROGEN_RESPONSE_LATE; WNTβ: WNT_BETA_CATENIN_SIGNALING; M1: M1 macrophage; Tfh: follicular helper cells; M2: M2 macrophage; Tregs: CD4+ regulatory T cells.
Tables
Table 1. Key resources
| Resource | Source | Identifier |
|---|
| Deposited data | | |
| METABRIC | METABRIC | [31] |
| TCGA | TCGA PanCancer Atlas | [31] |
| GSE199135 | Takeshita et al [24] | [32] |
| GSE9195; GSE6532 | Loi et al, 2010 dataset [25] | [32] |
| GSE21653 | Sabatier et al, 2011 [26] | [32] |
| Software and algorithms | | |
| Python 3.11.0 | Python Software Foundation | [33] |
| Numpy v 1.23.4 | Van Der Waltetal, 2011 [27] | [34] |
| SciPy v 1.9.3 | Virtanen et al, 2020 [28] | [35] |
| Pandas v 1.5.1 | Pandas - Python Data Analysis Library | [36] |
| Seaborn v 0.12.1 | Waskom, 2021 [29] | [37] |
| Matplotlib v 3.6.2 | Hunter, 2007 [30] | [38] |
| R4.0.2 | The R Foundation | [39] |
Table 2. The Nine Genes Best Predictors Extracted From 23 Signature Genes Using the Cox-PH Model With Recursive Feature Elimination
| coef | std err | z | P > |z| | (0.025 | 0.975) |
|---|
| Cox-PH: Cox proportional-hazards. |
| 23 genes | | | | | | |
| const | -0.568 | 0.684 | -0.83 | 0.406 | -1.909 | 0.773 |
| AGL | 0.2822 | 0.109 | 2.591 | 0.01 | 0.069 | 0.496 |
| BIRC5 | 0.1692 | 0.227 | 0.747 | 0.455 | -0.275 | 0.613 |
| C1orf64 | -0.216 | 0.061 | -3.565 | 0 | -0.335 | -0.097 |
| CDCA3 | 0.1451 | 0.282 | 0.514 | 0.607 | -0.408 | 0.698 |
| CENPF | 0.1927 | 0.243 | 0.795 | 0.427 | -0.283 | 0.668 |
| CEP55 | -0.7396 | 0.378 | -1.957 | 0.05 | -1.48 | 0.001 |
| CIDEC | 0.021 | 0.077 | 0.272 | 0.785 | -0.13 | 0.172 |
| CKAP2L | 0.8004 | 0.44 | 1.82 | 0.069 | -0.062 | 1.663 |
| CRTAP | -0.3557 | 0.197 | -1.808 | 0.071 | -0.741 | 0.03 |
| CYP4F22 | -0.1655 | 0.09 | -1.845 | 0.065 | -0.341 | 0.01 |
| E2F2 | -0.3632 | 0.253 | -1.434 | 0.152 | -0.86 | 0.133 |
| FHL2 | -0.0056 | 0.098 | -0.057 | 0.955 | -0.197 | 0.186 |
| FOS | 0.0434 | 0.077 | 0.566 | 0.571 | -0.107 | 0.194 |
| GSTM2 | -0.0754 | 0.08 | -0.937 | 0.349 | -0.233 | 0.082 |
| HNMT | -0.5129 | 0.213 | -2.405 | 0.016 | -0.931 | -0.095 |
| KIF20A | 1.2829 | 0.324 | 3.956 | 0 | 0.647 | 1.919 |
| LAD1 | 0.2009 | 0.083 | 2.423 | 0.015 | 0.038 | 0.363 |
| PIP | 0.0504 | 0.044 | 1.155 | 0.248 | -0.035 | 0.136 |
| PRC1 | -0.5401 | 0.27 | -2 | 0.045 | -1.069 | -0.011 |
| S100P | 0.1684 | 0.047 | 3.571 | 0 | 0.076 | 0.261 |
| SEPP1 | 0.2943 | 0.13 | 2.267 | 0.023 | 0.04 | 0.549 |
| STAT1 | -0.0774 | 0.111 | -0.695 | 0.487 | -0.296 | 0.141 |
| TUBA3D | -0.2673 | 0.074 | -3.619 | 0 | -0.412 | -0.123 |
| 13 genes | | | | | | |
| const | -0.93 | 0.458 | -2.029 | 0.042 | -1.828 | -0.032 |
| AGL | 0.2695 | 0.105 | 2.557 | 0.011 | 0.063 | 0.476 |
| C1orf64 | -0.2189 | 0.058 | -3.774 | 0 | -0.333 | -0.105 |
| CEP55 | -0.7108 | 0.353 | -2.012 | 0.044 | -1.403 | -0.019 |
| CKAP2L | 0.7766 | 0.4 | 1.943 | 0.052 | -0.007 | 1.56 |
| CRTAP | -0.345 | 0.184 | -1.876 | 0.061 | -0.705 | 0.015 |
| CYP4F22 | -0.1731 | 0.088 | -1.96 | 0.05 | -0.346 | -3.02E-05 |
| HNMT | -0.3755 | 0.198 | -1.893 | 0.058 | -0.764 | 0.013 |
| KIF20A | 1.2816 | 0.307 | 4.168 | 0 | 0.679 | 1.884 |
| LAD1 | 0.2107 | 0.081 | 2.611 | 0.009 | 0.053 | 0.369 |
| PRC1 | -0.513 | 0.261 | -1.966 | 0.049 | -1.024 | -0.002 |
| S100P | 0.1733 | 0.046 | 3.74 | 0 | 0.082 | 0.264 |
| SEPP1 | 0.2812 | 0.123 | 2.277 | 0.023 | 0.039 | 0.523 |
| TUBA3D | -0.2489 | 0.07 | -3.532 | 0 | -0.387 | -0.111 |
| 12 genes | | | | | | |
| const | -0.9519 | 0.458 | -2.079 | 0.038 | -1.85 | -0.054 |
| AGL | 0.3102 | 0.103 | 3.013 | 0.003 | 0.108 | 0.512 |
| C1orf64 | -0.2124 | 0.058 | -3.668 | 0 | -0.326 | -0.099 |
| CEP55 | -0.631 | 0.35 | -1.803 | 0.071 | -1.317 | 0.055 |
| CKAP2L | 0.9341 | 0.392 | 2.383 | 0.017 | 0.166 | 1.702 |
| CYP4F22 | -0.17 | 0.088 | -1.926 | 0.054 | -0.343 | 0.003 |
| HNMT | -0.5147 | 0.184 | -2.793 | 0.005 | -0.876 | -0.153 |
| KIF20A | 1.1914 | 0.303 | 3.931 | 0 | 0.597 | 1.785 |
| LAD1 | 0.2105 | 0.081 | 2.603 | 0.009 | 0.052 | 0.369 |
| PRC1 | -0.5702 | 0.259 | -2.202 | 0.028 | -1.078 | -0.063 |
| S100P | 0.1651 | 0.046 | 3.582 | 0 | 0.075 | 0.255 |
| SEPP1 | 0.183 | 0.112 | 1.636 | 0.102 | -0.036 | 0.402 |
| TUBA3D | -0.2344 | 0.07 | -3.353 | 0.001 | -0.371 | -0.097 |
| 11 genes | | | | | | |
| const | -0.8428 | 0.452 | -1.866 | 0.062 | -1.728 | 0.042 |
| AGL | 0.3101 | 0.103 | 3.014 | 0.003 | 0.108 | 0.512 |
| C1orf64 | -0.2005 | 0.057 | -3.495 | 0 | -0.313 | -0.088 |
| CEP55 | -0.5666 | 0.347 | -1.632 | 0.103 | -1.247 | 0.114 |
| CKAP2L | 0.8471 | 0.388 | 2.182 | 0.029 | 0.086 | 1.608 |
| CYP4F22 | -0.1772 | 0.088 | -2.014 | 0.044 | -0.35 | -0.005 |
| HNMT | -0.3585 | 0.157 | -2.289 | 0.022 | -0.665 | -0.051 |
| KIF20A | 1.1552 | 0.302 | 3.822 | 0 | 0.563 | 1.748 |
| LAD1 | 0.2013 | 0.08 | 2.501 | 0.012 | 0.044 | 0.359 |
| PRC1 | -0.5527 | 0.259 | -2.134 | 0.033 | -1.06 | -0.045 |
| S100P | 0.1609 | 0.046 | 3.504 | 0 | 0.071 | 0.251 |
| TUBA3D | -0.2376 | 0.07 | -3.398 | 0.001 | -0.375 | -0.101 |
| 10 genes | | | | | | |
| const | -0.7569 | 0.447 | -1.692 | 0.091 | -1.633 | 0.12 |
| AGL | 0.2979 | 0.102 | 2.907 | 0.004 | 0.097 | 0.499 |
| C1orf64 | -0.1867 | 0.057 | -3.294 | 0.001 | -0.298 | -0.076 |
| CKAP2L | 0.5869 | 0.352 | 1.67 | 0.095 | -0.102 | 1.276 |
| CYP4F22 | -0.1749 | 0.088 | -1.99 | 0.047 | -0.347 | -0.003 |
| HNMT | -0.4006 | 0.154 | -2.602 | 0.009 | -0.702 | -0.099 |
| KIF20A | 1.036 | 0.292 | 3.545 | 0 | 0.463 | 1.609 |
| LAD1 | 0.1867 | 0.08 | 2.341 | 0.019 | 0.03 | 0.343 |
| PRC1 | -0.6683 | 0.249 | -2.688 | 0.007 | -1.156 | -0.181 |
| S100P | 0.1609 | 0.046 | 3.509 | 0 | 0.071 | 0.251 |
| TUBA3D | -0.2381 | 0.07 | -3.416 | 0.001 | -0.375 | -0.101 |
| 9 genes | | | | | | |
| const | -1.0651 | 0.407 | -2.617 | 0.009 | -1.863 | -0.267 |
| AGL | 0.3107 | 0.102 | 3.04 | 0.002 | 0.11 | 0.511 |
| C1orf64 | -0.1932 | 0.057 | -3.416 | 0.001 | -0.304 | -0.082 |
| CYP4F22 | -0.176 | 0.088 | -2.009 | 0.045 | -0.348 | -0.004 |
| HNMT | -0.4024 | 0.154 | -2.611 | 0.009 | -0.705 | -0.1 |
| KIF20A | 1.2687 | 0.258 | 4.915 | 0 | 0.763 | 1.775 |
| LAD1 | 0.1841 | 0.08 | 2.309 | 0.021 | 0.028 | 0.34 |
| PRC1 | -0.4968 | 0.226 | -2.2 | 0.028 | -0.939 | -0.054 |
| S100P | 0.1645 | 0.046 | 3.596 | 0 | 0.075 | 0.254 |
| TUBA3D | -0.2352 | 0.07 | -3.38 | 0.001 | -0.372 | -0.099 |
Table 3. Patients and Clinical Characteristics Associated With Recurrence Prediction Model in METABRIC HR+ HER2- Cohort
| Variables | Number of patients (%) | P-value |
|---|
| Total (N = 1,355) | Recurrence prediction model |
|---|
| High risk (N = 486) | Low risk (N = 869) |
|---|
| *It was also significance in univariate and multivariate analysis. P < 0.05 is considered statistically significant. METABRIC: Molecular Taxonomy of Breast Cancer International Consortium, HR+: hormone receptor positive; HER2: human epidermal growth factor receptor 2; PgR: progesterone receptor. |
| Age | | | | |
| ≥ 50 | 220 (16.2) | 58 (11.9) | 162 (18.6) | 0.0013* |
| < 50 | 1,135 (83.8) | 428 (88.1) | 707 (81.4) | |
| Menopausal state | | | | |
| Pre | 220 (16.2) | 58 (11.9) | 162 (18.6) | 0.0013* |
| Post | 1,135 (83.8) | 428 (88.1) | 707 (81.4) | |
| Tumor size (cm) | | | | |
| ≥ 2 | 601 (44.4) | 179 (36.8) | 422 (48.6) | 0.000027* |
| < 2 | 742 (54.8) | 303 (62.3) | 439 (50.5) | |
| Unknown | 12 (0.9) | 4 (0.8) | 8 (0.9) | |
| Lymph node metastases | | | | |
| Negative | 745 (55) | 246 (50.6) | 499 (57.4) | 0.016* |
| Positive | 610 (45) | 240 (49.4) | 370 (42.6) | |
| Histopathology | | | | |
| Ductal | 1,006 (74.2) | 395 (81.3) | 611 (70.3) | 0.000051* |
| Lobular | 118 (8.7) | 29 (6) | 89 (10.2) | |
| Others/unknown | 231 (17) | 62 (12.8) | 169 (19.4) | |
| Tumor grade | | | | |
| 1 | 159 (11.7) | 18 (3.7) | 141 (16.2) | < 0.00001* |
| 2, 3 | 1,135 (83.8) | 452 (93) | 683 (78.6) | |
| Unknown | 61 (4.5) | 16 (3.3) | 45 (5.2) | |
| Clinical stage | | | | |
| I/II | 933 (68.9) | 317 (65.2) | 616 (70.9) | 0.13 |
| III/IV | 70 (5.2) | 30 (6.2) | 40 (4.6) | |
| Unknown | 352 (26) | 139 (28.6) | 213 (24.5) | |
| PgR | | | | |
| Negative | 411 (30.3) | 206 (42.4) | 205 (23.6) | < 0.00001* |
| Positive | 944 (69.7) | 280 (57.6) | 664 (76.4) | |
| Molecular characterization | | | | |
| Luminal A | 656 (48.4) | 137 (28.2) | 519 (59.7) | < 0.00001* |
| Luminal B | 419 (30.9) | 222 (45.7) | 197 (22.7) | |
| HER2 | 63 (4.6) | 53 (10.9) | 10 (1.2) | |
| Basal-like | 25 (1.8) | 22 (4.5) | 3 (0.3) | |
| Claudin-low | 72 (5.3) | 19 (3.9) | 53 (6.1) | |
| Normal | 114 (8.4) | 30 (6.2) | 84 (9.7) | |