Figures
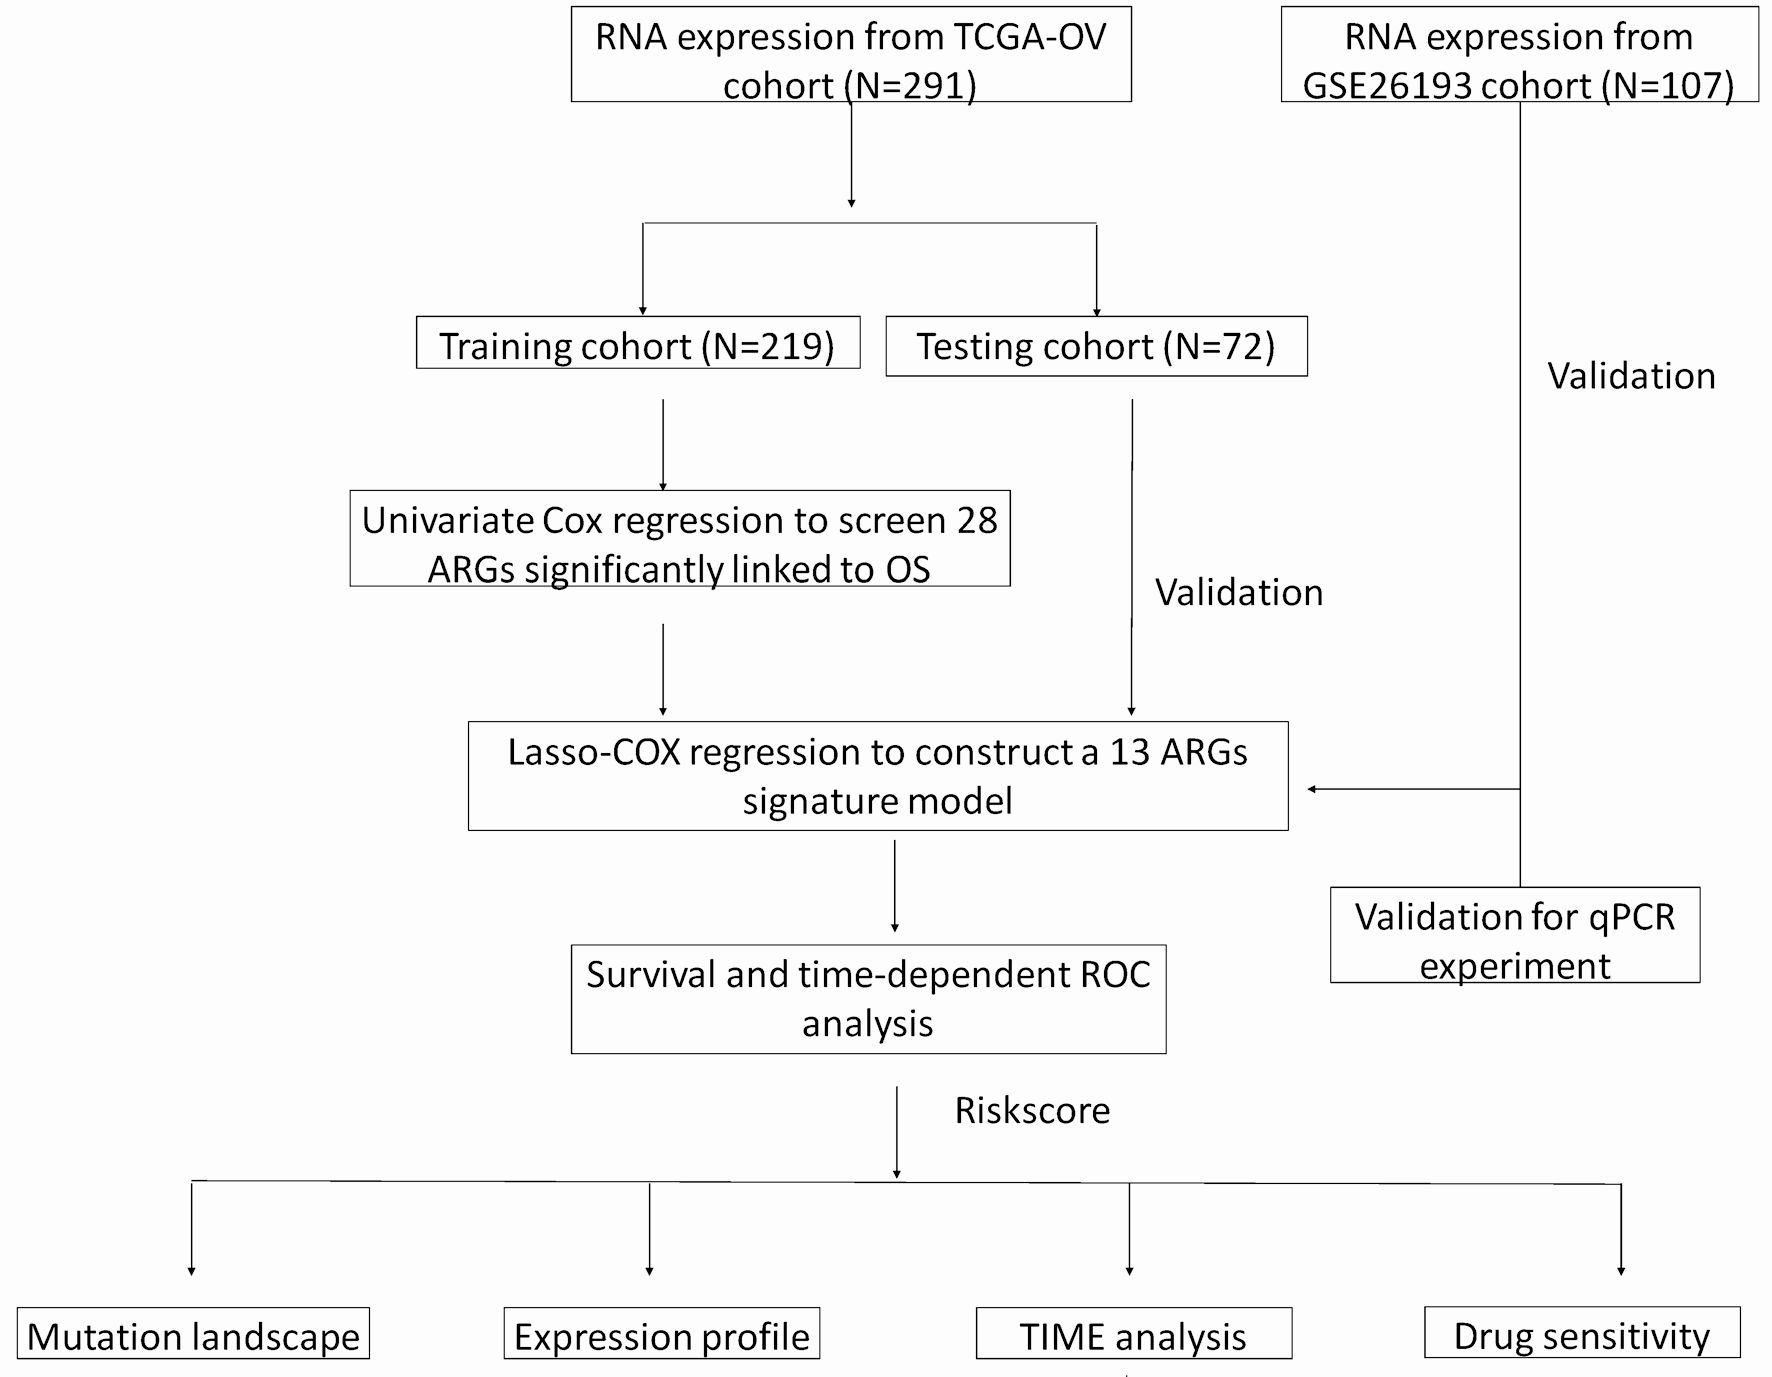
Figure 1. A flow chart of identification and validation of a novel anoikis-related signature for SOC prognosis.
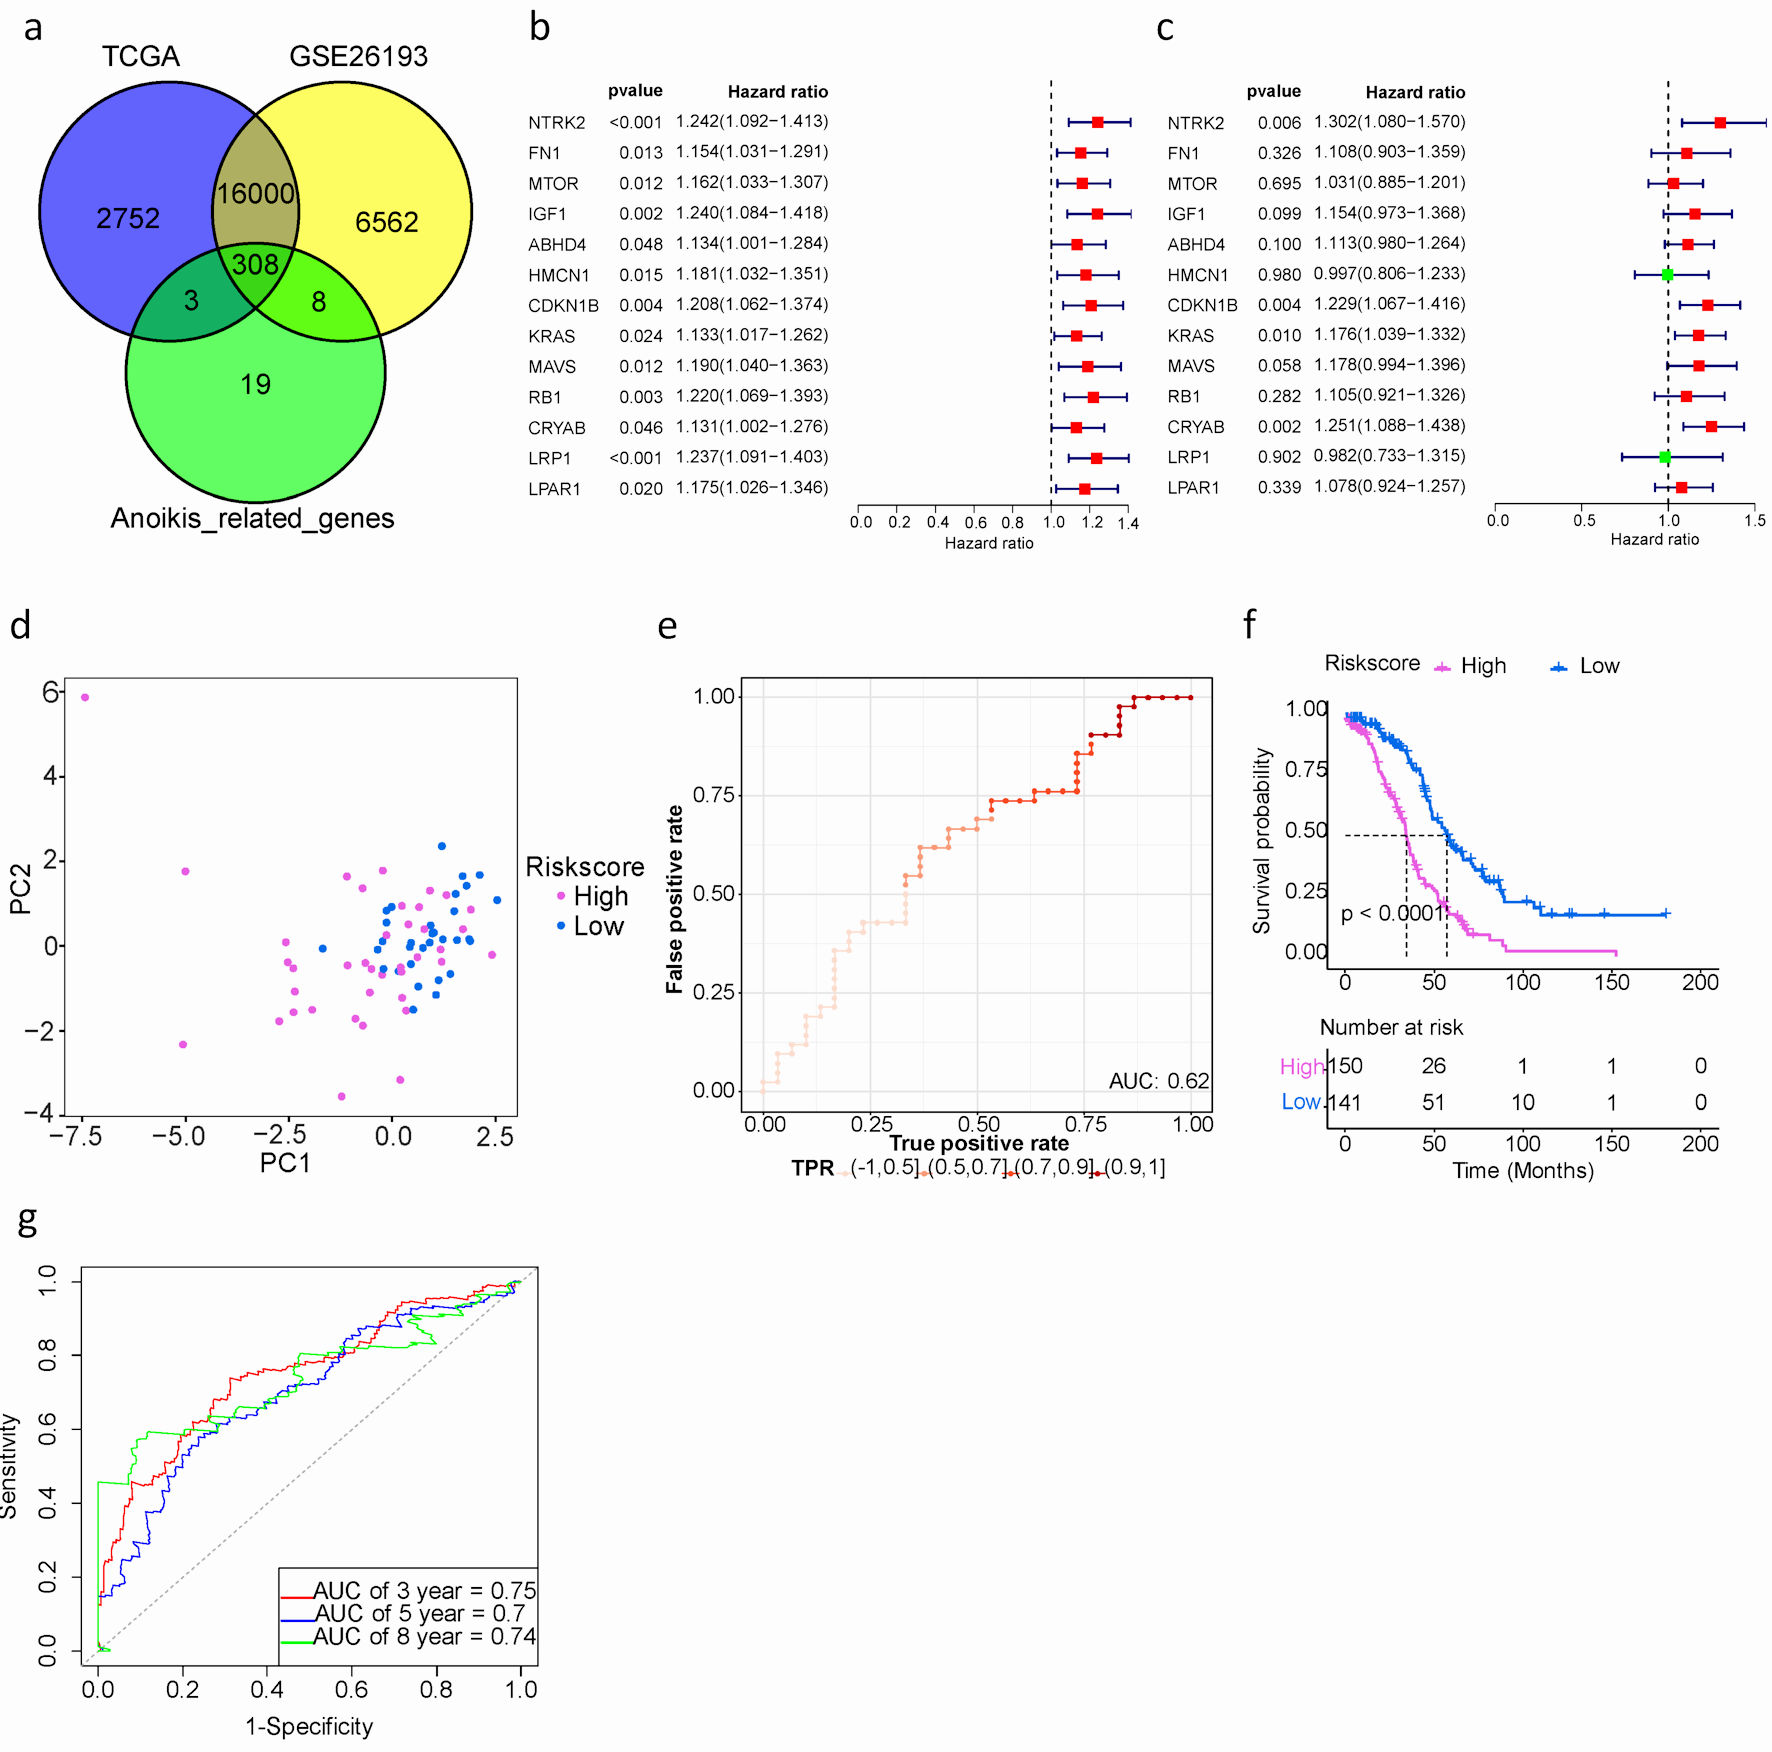
Figure 2. Development and assessment of a prognostic signature comprising ARGs in the TCGA cohort for SOC patients. (a) Venn plot of ARGs among TCGA, GEO and GeneCards databases. (b) Univariate Cox proportional hazard regression analysis for ARGs. (c) Multivariate Cox proportional hazard regression analysis for ARGs. Hazard ratio (HR) greater than 1 is marked red, HR less than 1 is marked green. (d) The distribution of gene expression in high- and low-risk groups in TCGA testing cohort. (e) Evaluation of the performance of ARGs signature model in TCGA testing cohort. (f) Kaplan-Meier curves of the prognostic predictors for high-risk and low-risk with SOC patients. Purple represents the high-risk group, blue represents the low-risk group, and the black dashed line represents the median survival time. (g). Time-dependent ROC curves for predicting the 3-, 5-, 8-year survival in TCGA cohort. SOC: serous ovarian cancer; ARGs: anoikis-related genes; TIME: tumor immune microenvironment; GEO: Gene Expression Omnibus; TCGA: The Cancer Genome Atlas; ROC: receiver operating characteristic.
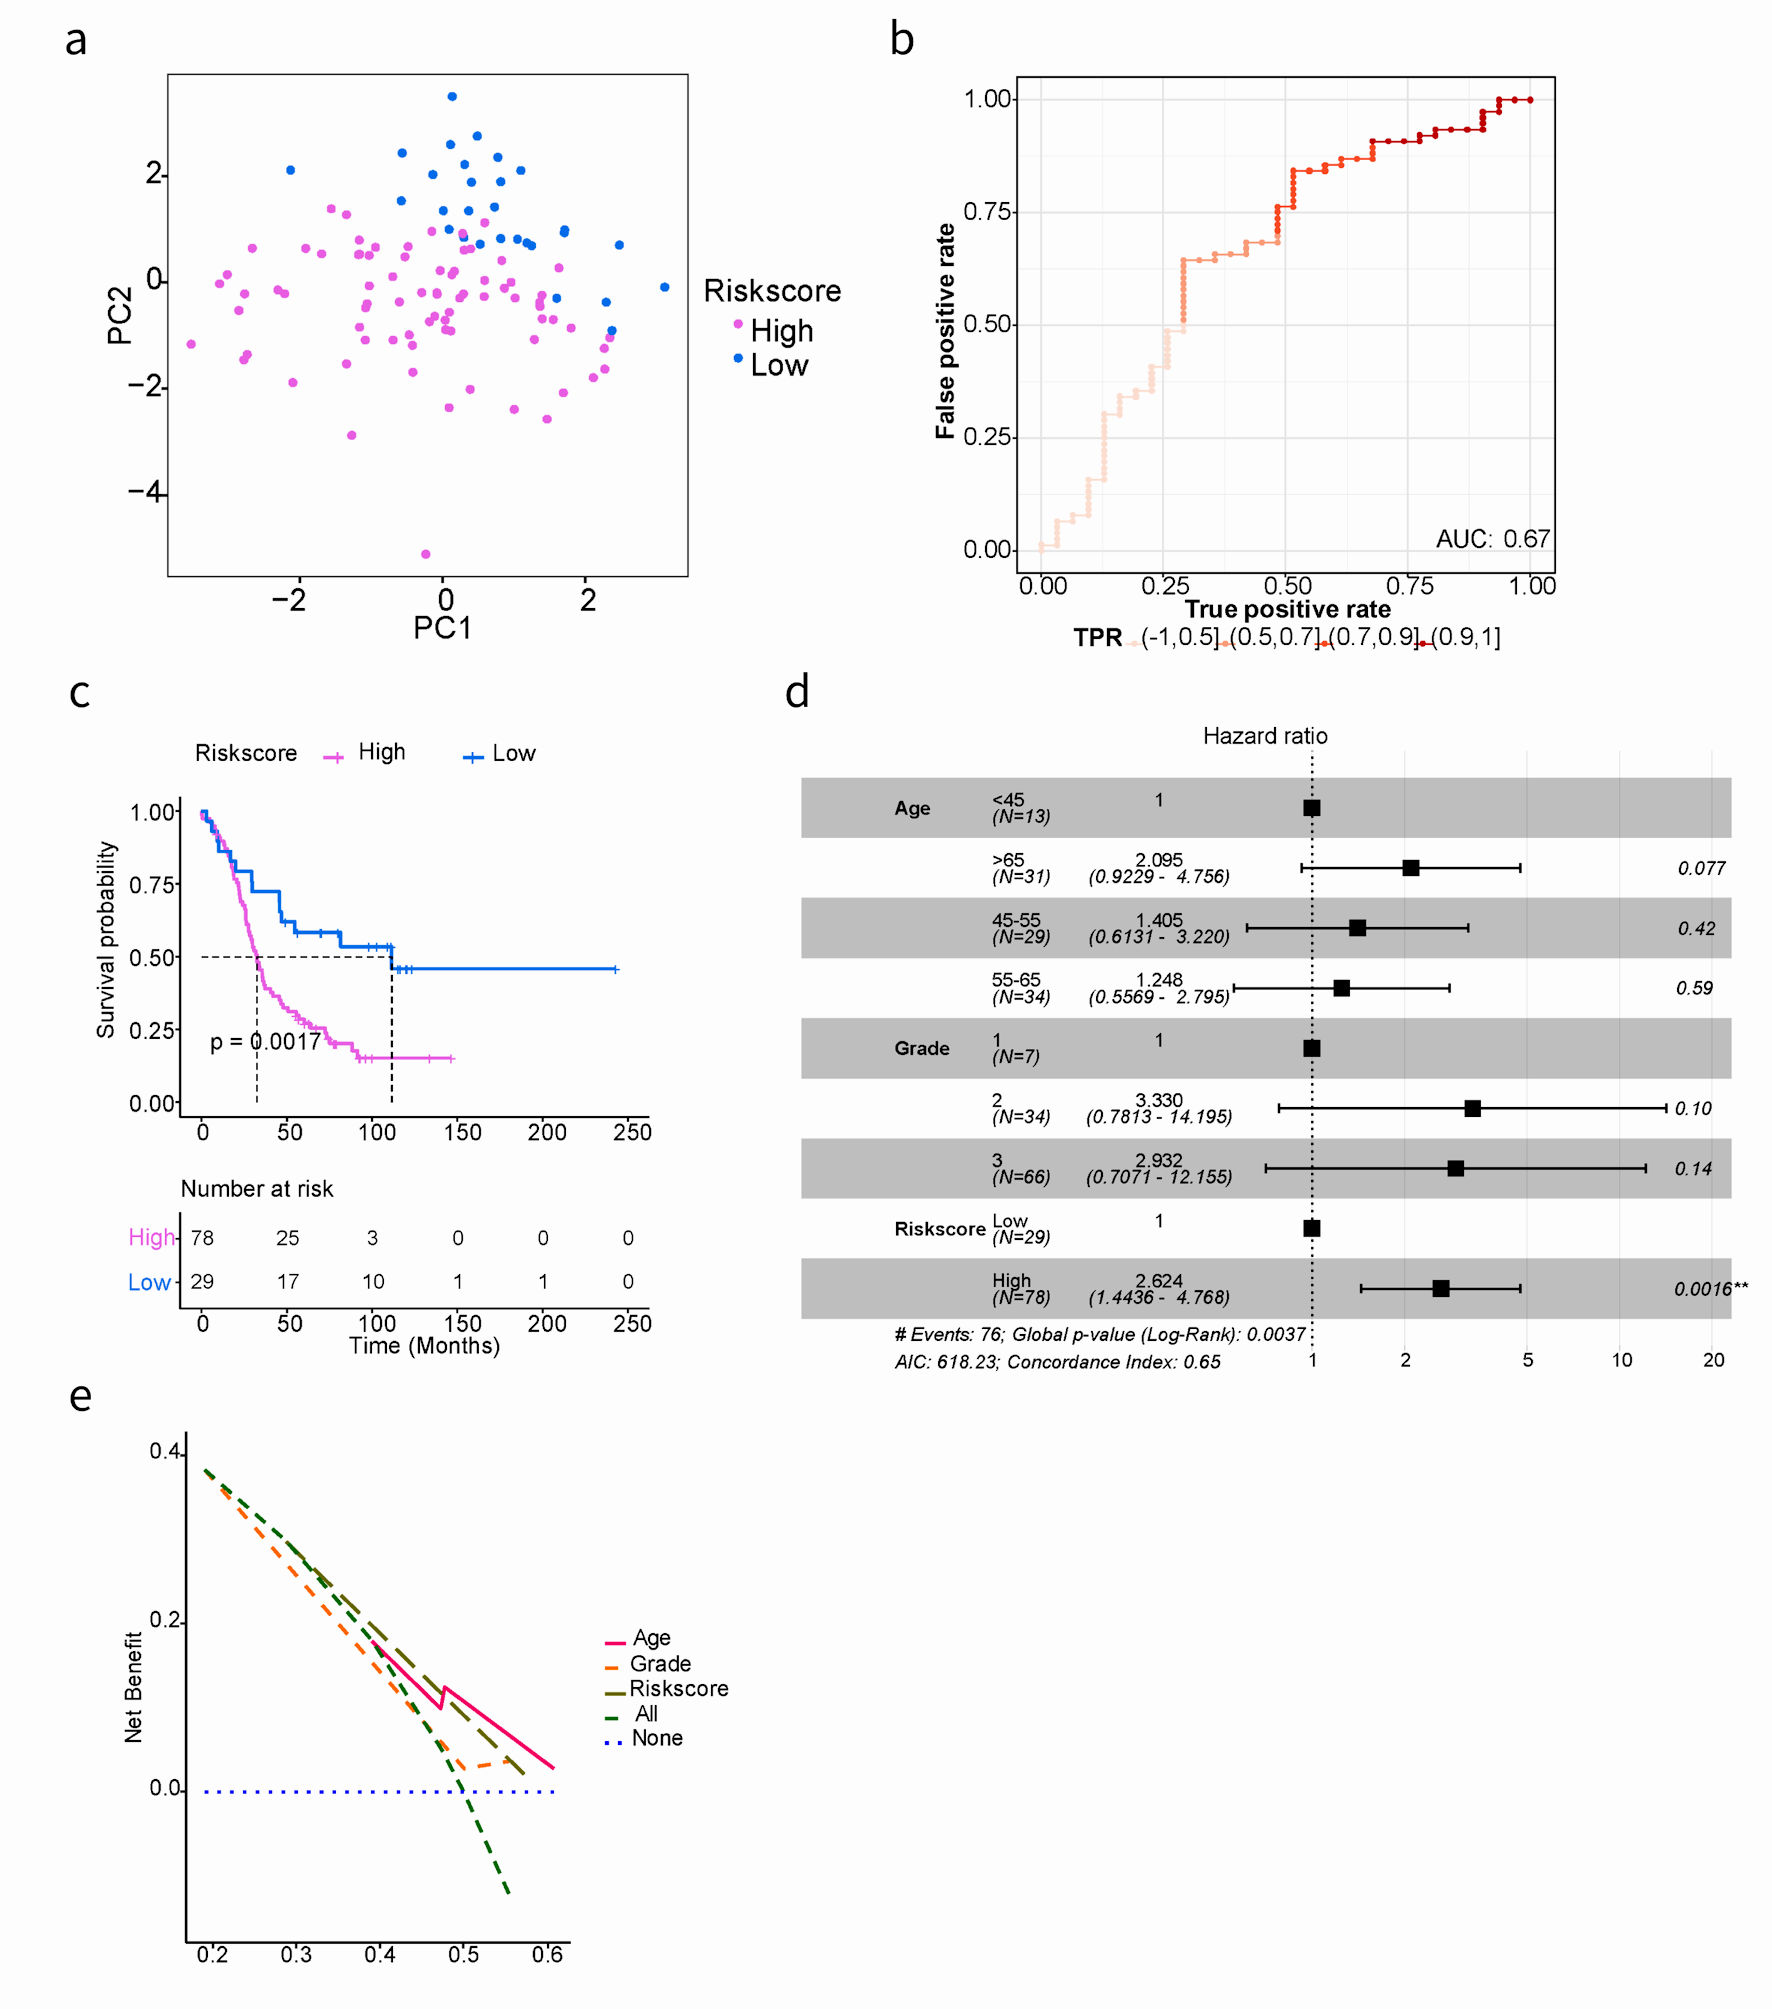
Figure 3. Kaplan-Meier and AUC curves for the prognostic risk signature in validation cohort. (a) PCA showed the characteristic distribution of high- and low-risk groups. Purple represents the high-risk group and blue represents the low-risk group. (b) Evaluation of the performance of ARGs signature model. The AUC ranges from 0 to 1, and the larger the AUC value, the better the model. (c) Kaplan-Meier curves of the prognostic predictors for high-risk and low-risk with SOC patients in GSE26193. (d) Multivariate Cox regression analysis evaluated the prognostic value of the ARGs signature and other clinical factors in the GSE26193 dataset. (e) Calculate and plot decision curve for SOC prognosis. PCA: principal component analysis; AUC: area under the curve; SOC: serous ovarian cancer; ARGs: anoikis-related genes.
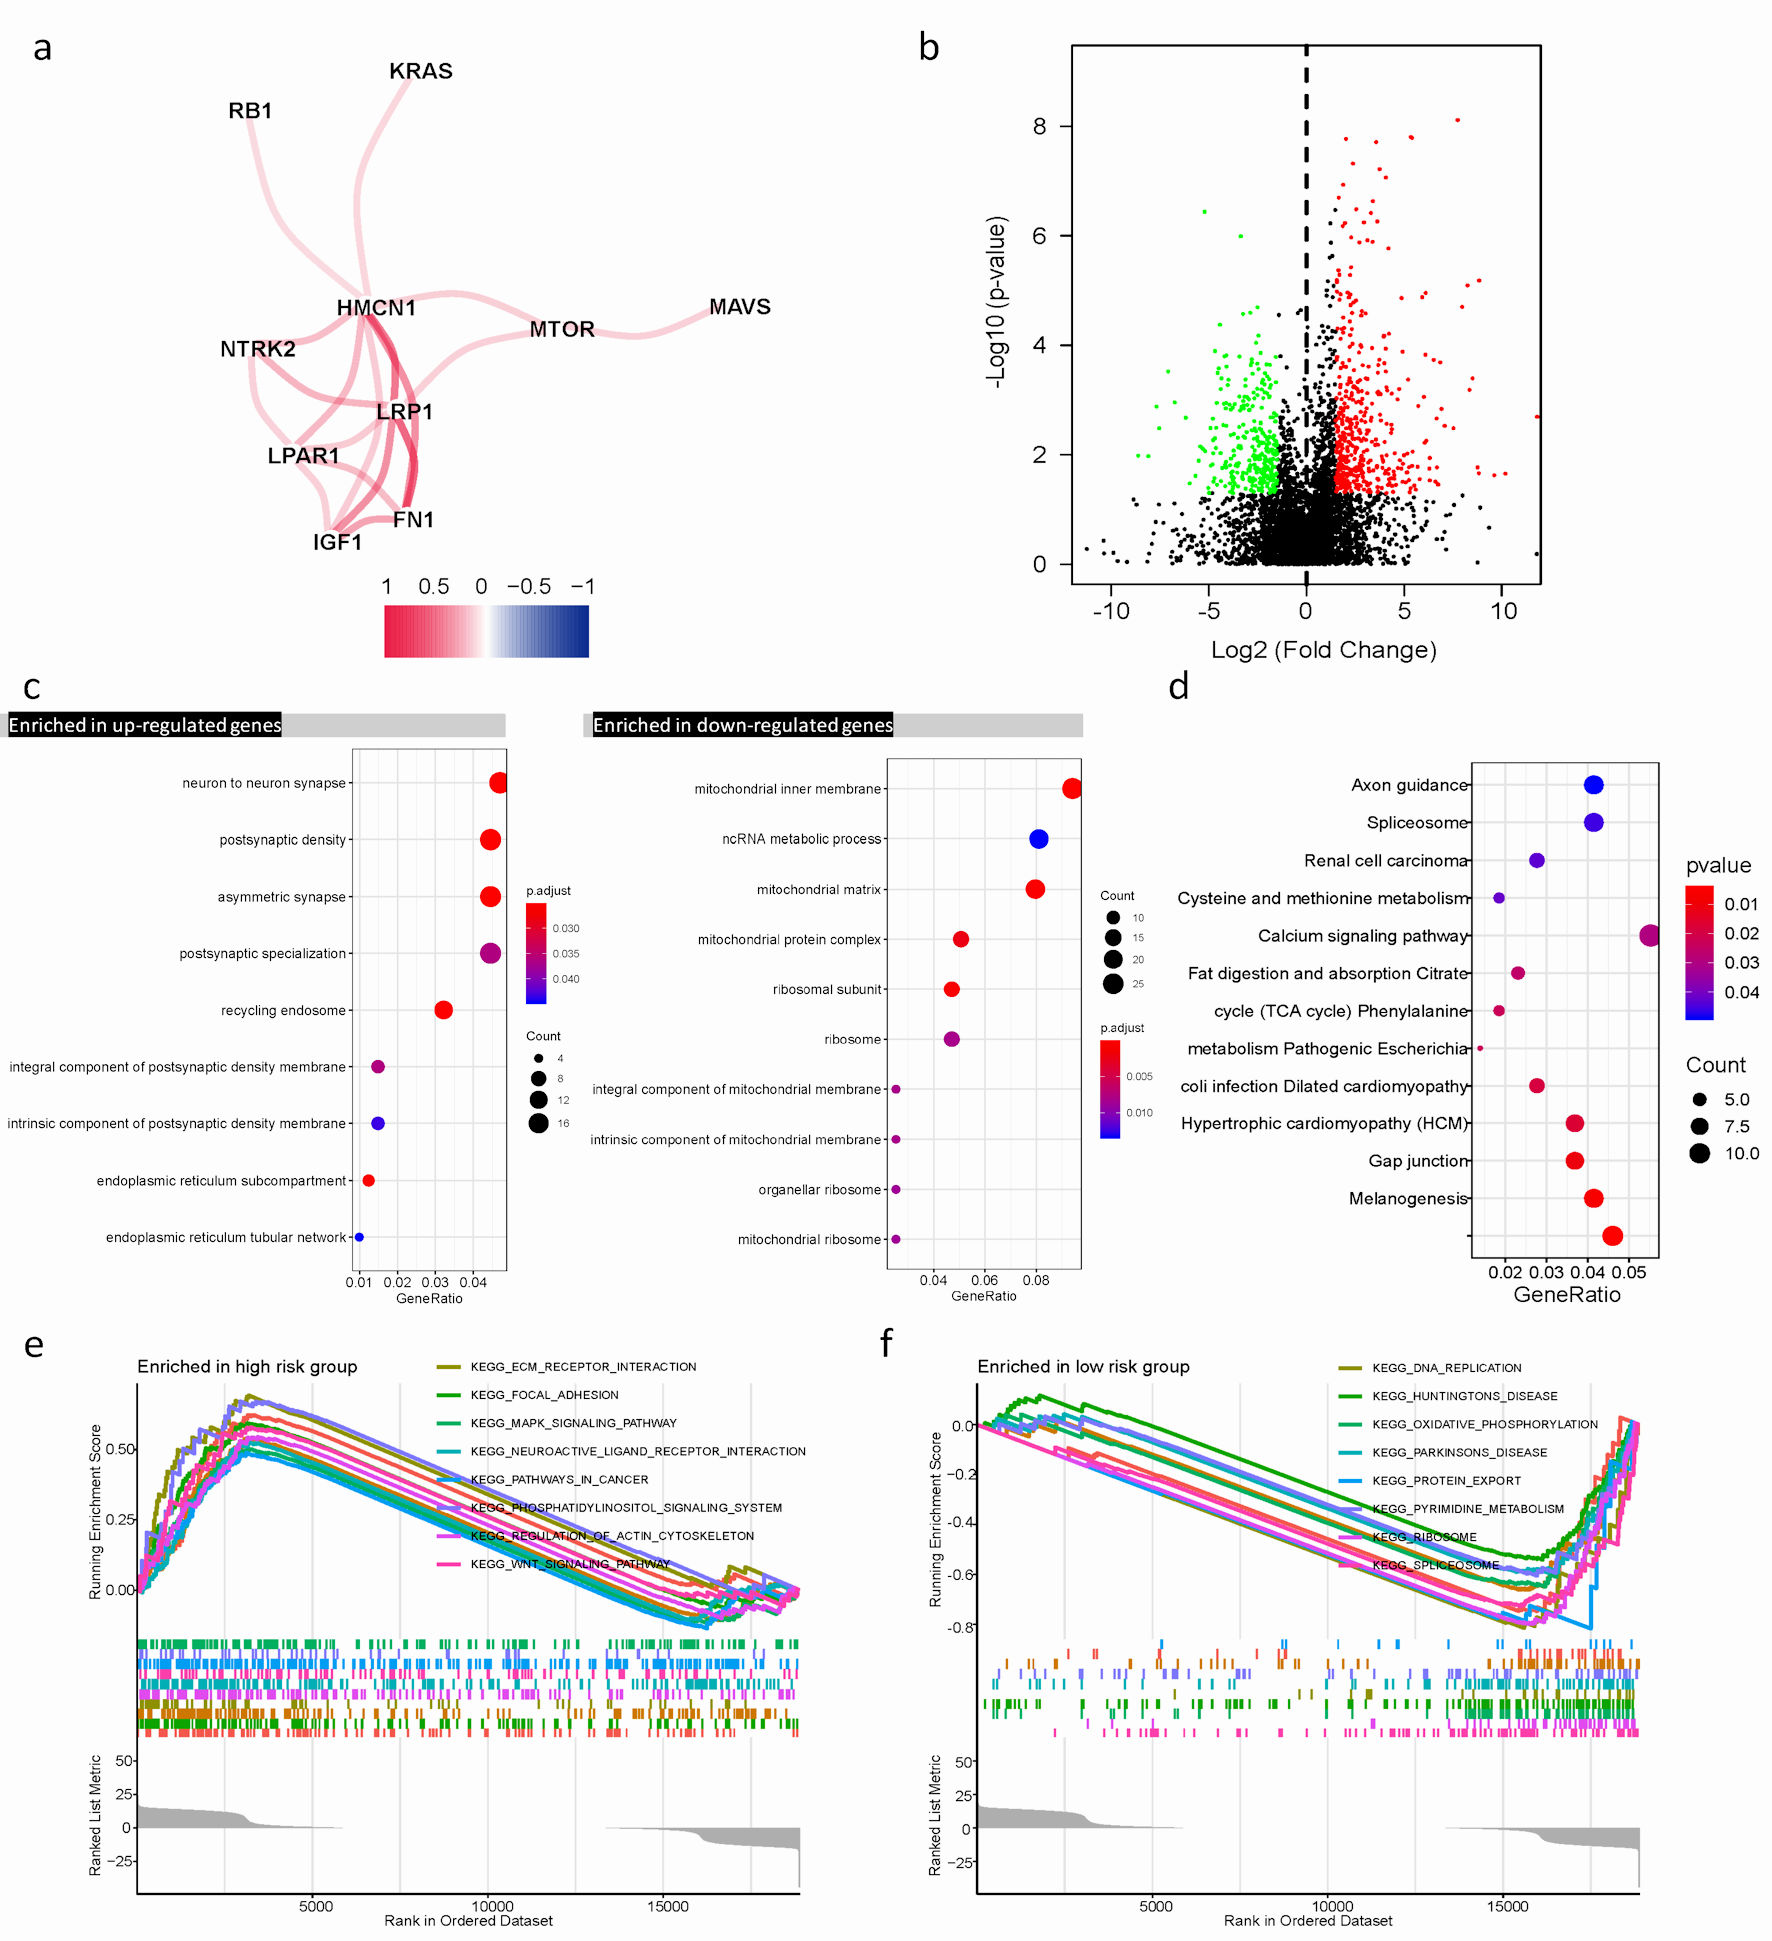
Figure 4. Differential expression of ARGs signature and enrichment of function and pathways in TCGA cohort. (a) The correlation mapping of 13 ARGs. Red represents positive correlation, and blue represents negative correlation. (b) In the volcano plot, red dots represent upregulated DEGs in different risk groups, green dots represent downregulated DEGs, and black dots represent these genes which are not differentially expressed. (c) The dot plot displays these significant terms of BP, CC, and MF based on significant upregulation and downregulation of genes. (d) The significant terms of KEGG pathways. (e, f) The top eight significant GSEA analysis results between the high- and low-risk groups. ARGs: anoikis-related genes; BP: biological process; CC: cellular component; MF: molecular function; KEGG: Kyoto Encyclopedia of Genes and Genomes; GSEA: gene set enrichment analysis; TCGA: The Cancer Genome Atlas; DEGs: differentially expressed genes.
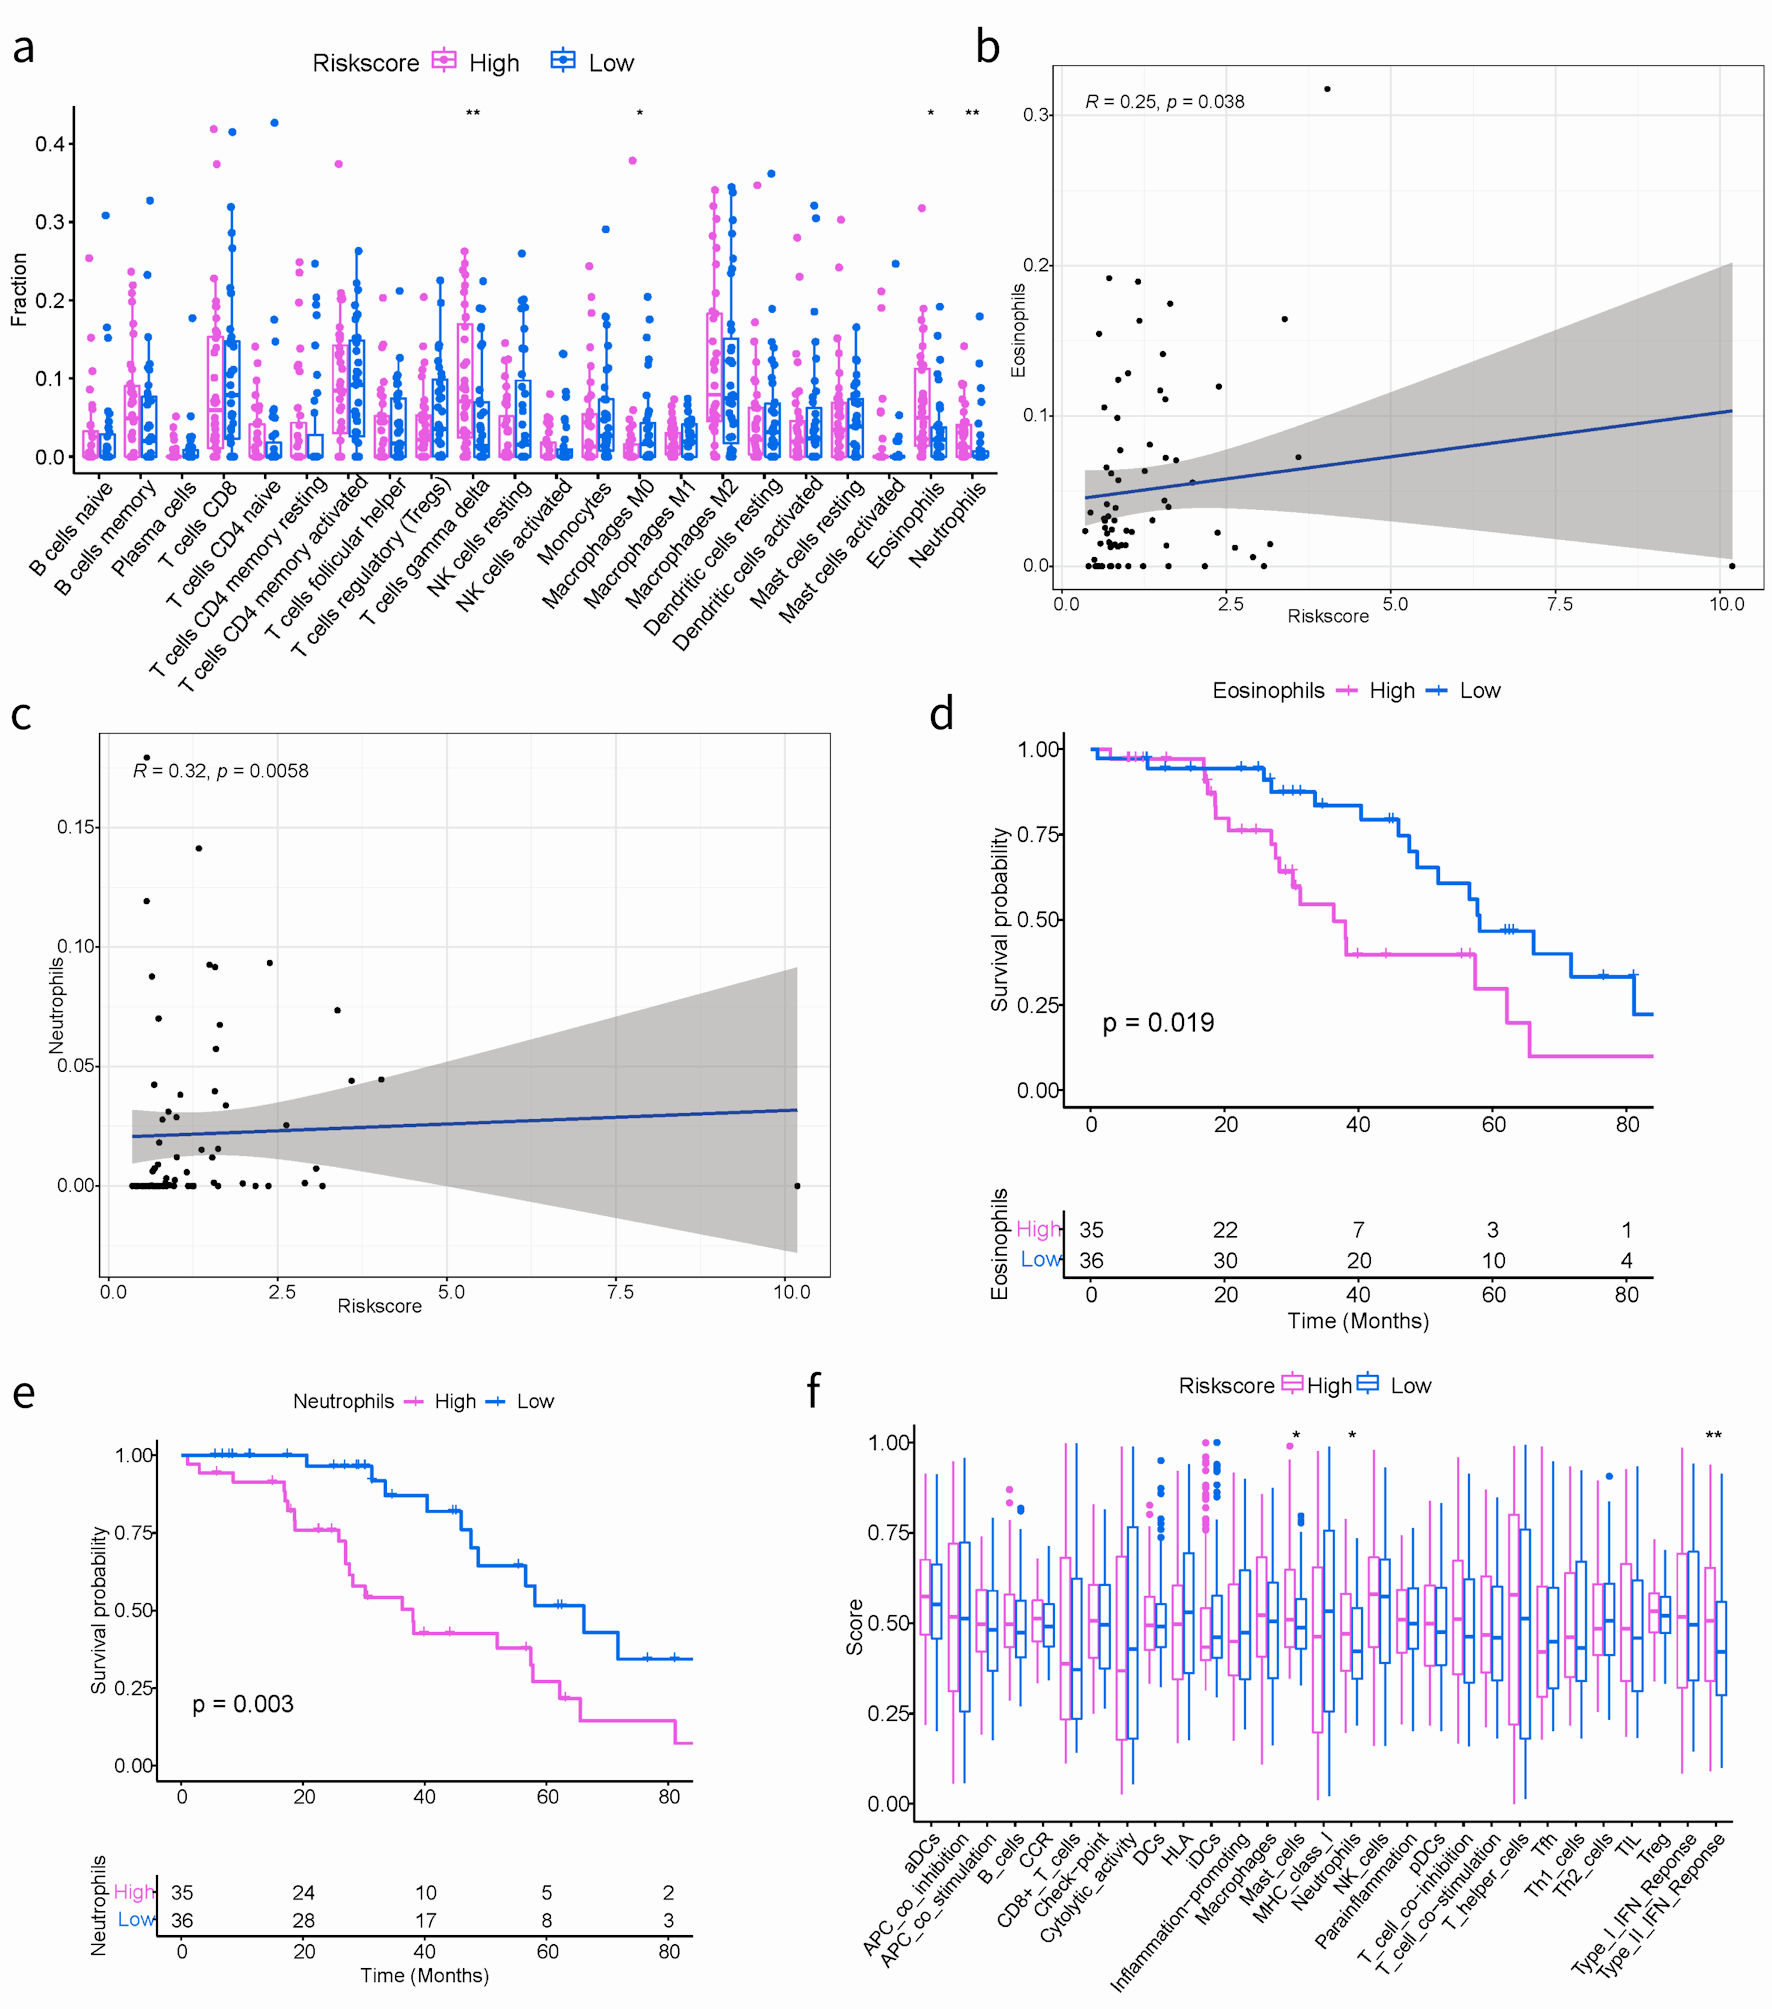
Figure 5. The correlation between the ARGs signature and TIME in TCGA cohort. (a) Boxplots depicting the CIBERSORT scores of 22 immune cells of the high-risk patients compared to low-risk patients. (Wilcoxon test, *P < 0.05, **P < 0.01, ***P < 0.001). (b, c) The correlation plots showing the relationship between the eosinophils/neutrophils cells ratio and ARGs signature in TCGA cohort. (d, e) Kaplan-Meier survival curves of eosinophils/neutrophils cells groups. (f) Comparison of the immune infiltration signature between the different risk groups. ARGs: anoikis-related genes; TIME: tumor immune microenvironment; TCGA: The Cancer Genome Atlas.
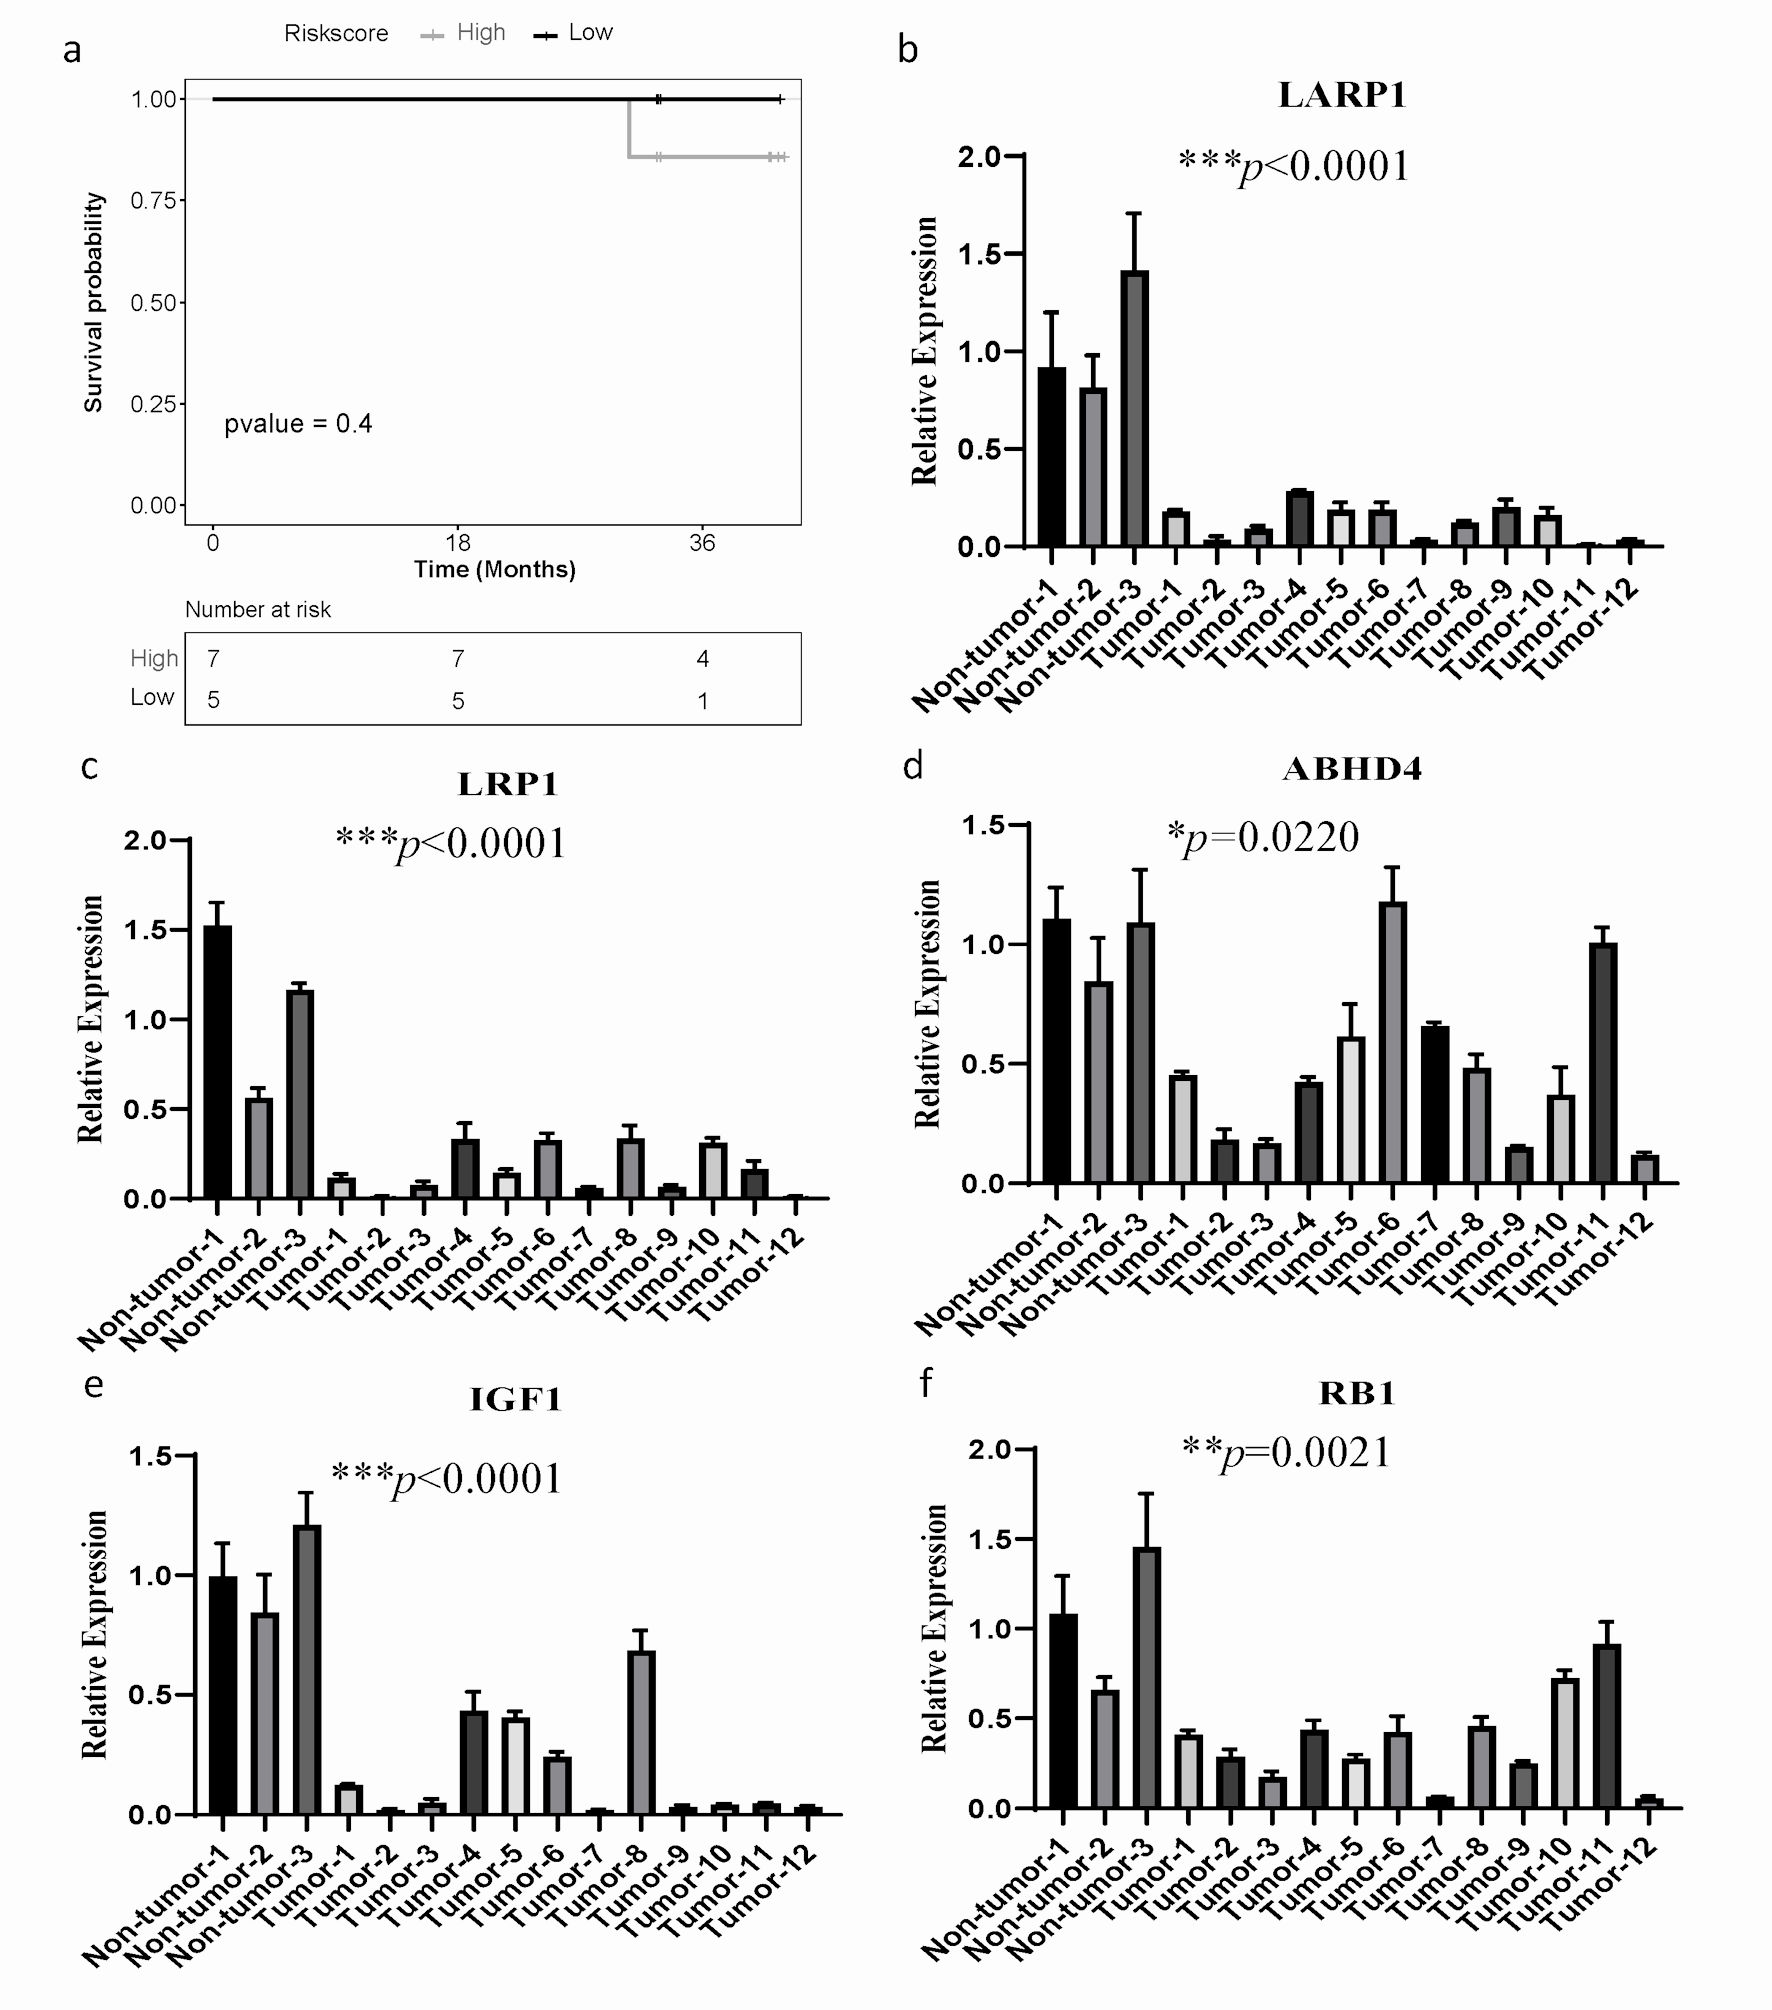
Figure 6. The mRNA expression of ARGs and qPCR validation. (a) Kaplan-Meier curves to compare OS of high-risk and low-risk groups based on the qPCR results in SOC patients. (b-f) The significantly differential mRNA expression of ARGs were presented. GAPDH was used as the internal reference. The error line represents the mean ± standard deviation (SD). SOC: serous ovarian cancer; ARGs: anoikis-related genes; OS: overall survival; qPCR: quantitative real-time polymerase chain reaction; GAPDH: glyceraldehyde 3-phosphate dehydrogenase.