World Journal of Oncology, ISSN 1920-4531 print, 1920-454X online, Open Access
Article copyright, the authors; Journal compilation copyright, World J Oncol and Elmer Press Inc
Journal website https://www.wjon.org

Original Article

Volume 14, Number 6, December 2023, pages 505-517


Development and Validation of Nomograms Based on Nutritional Risk Index for Predicting Extracapsular Extension and Seminal Vesicle Invasion in Patients Undergoing Radical Prostatectomy

Figures

Figure 1.
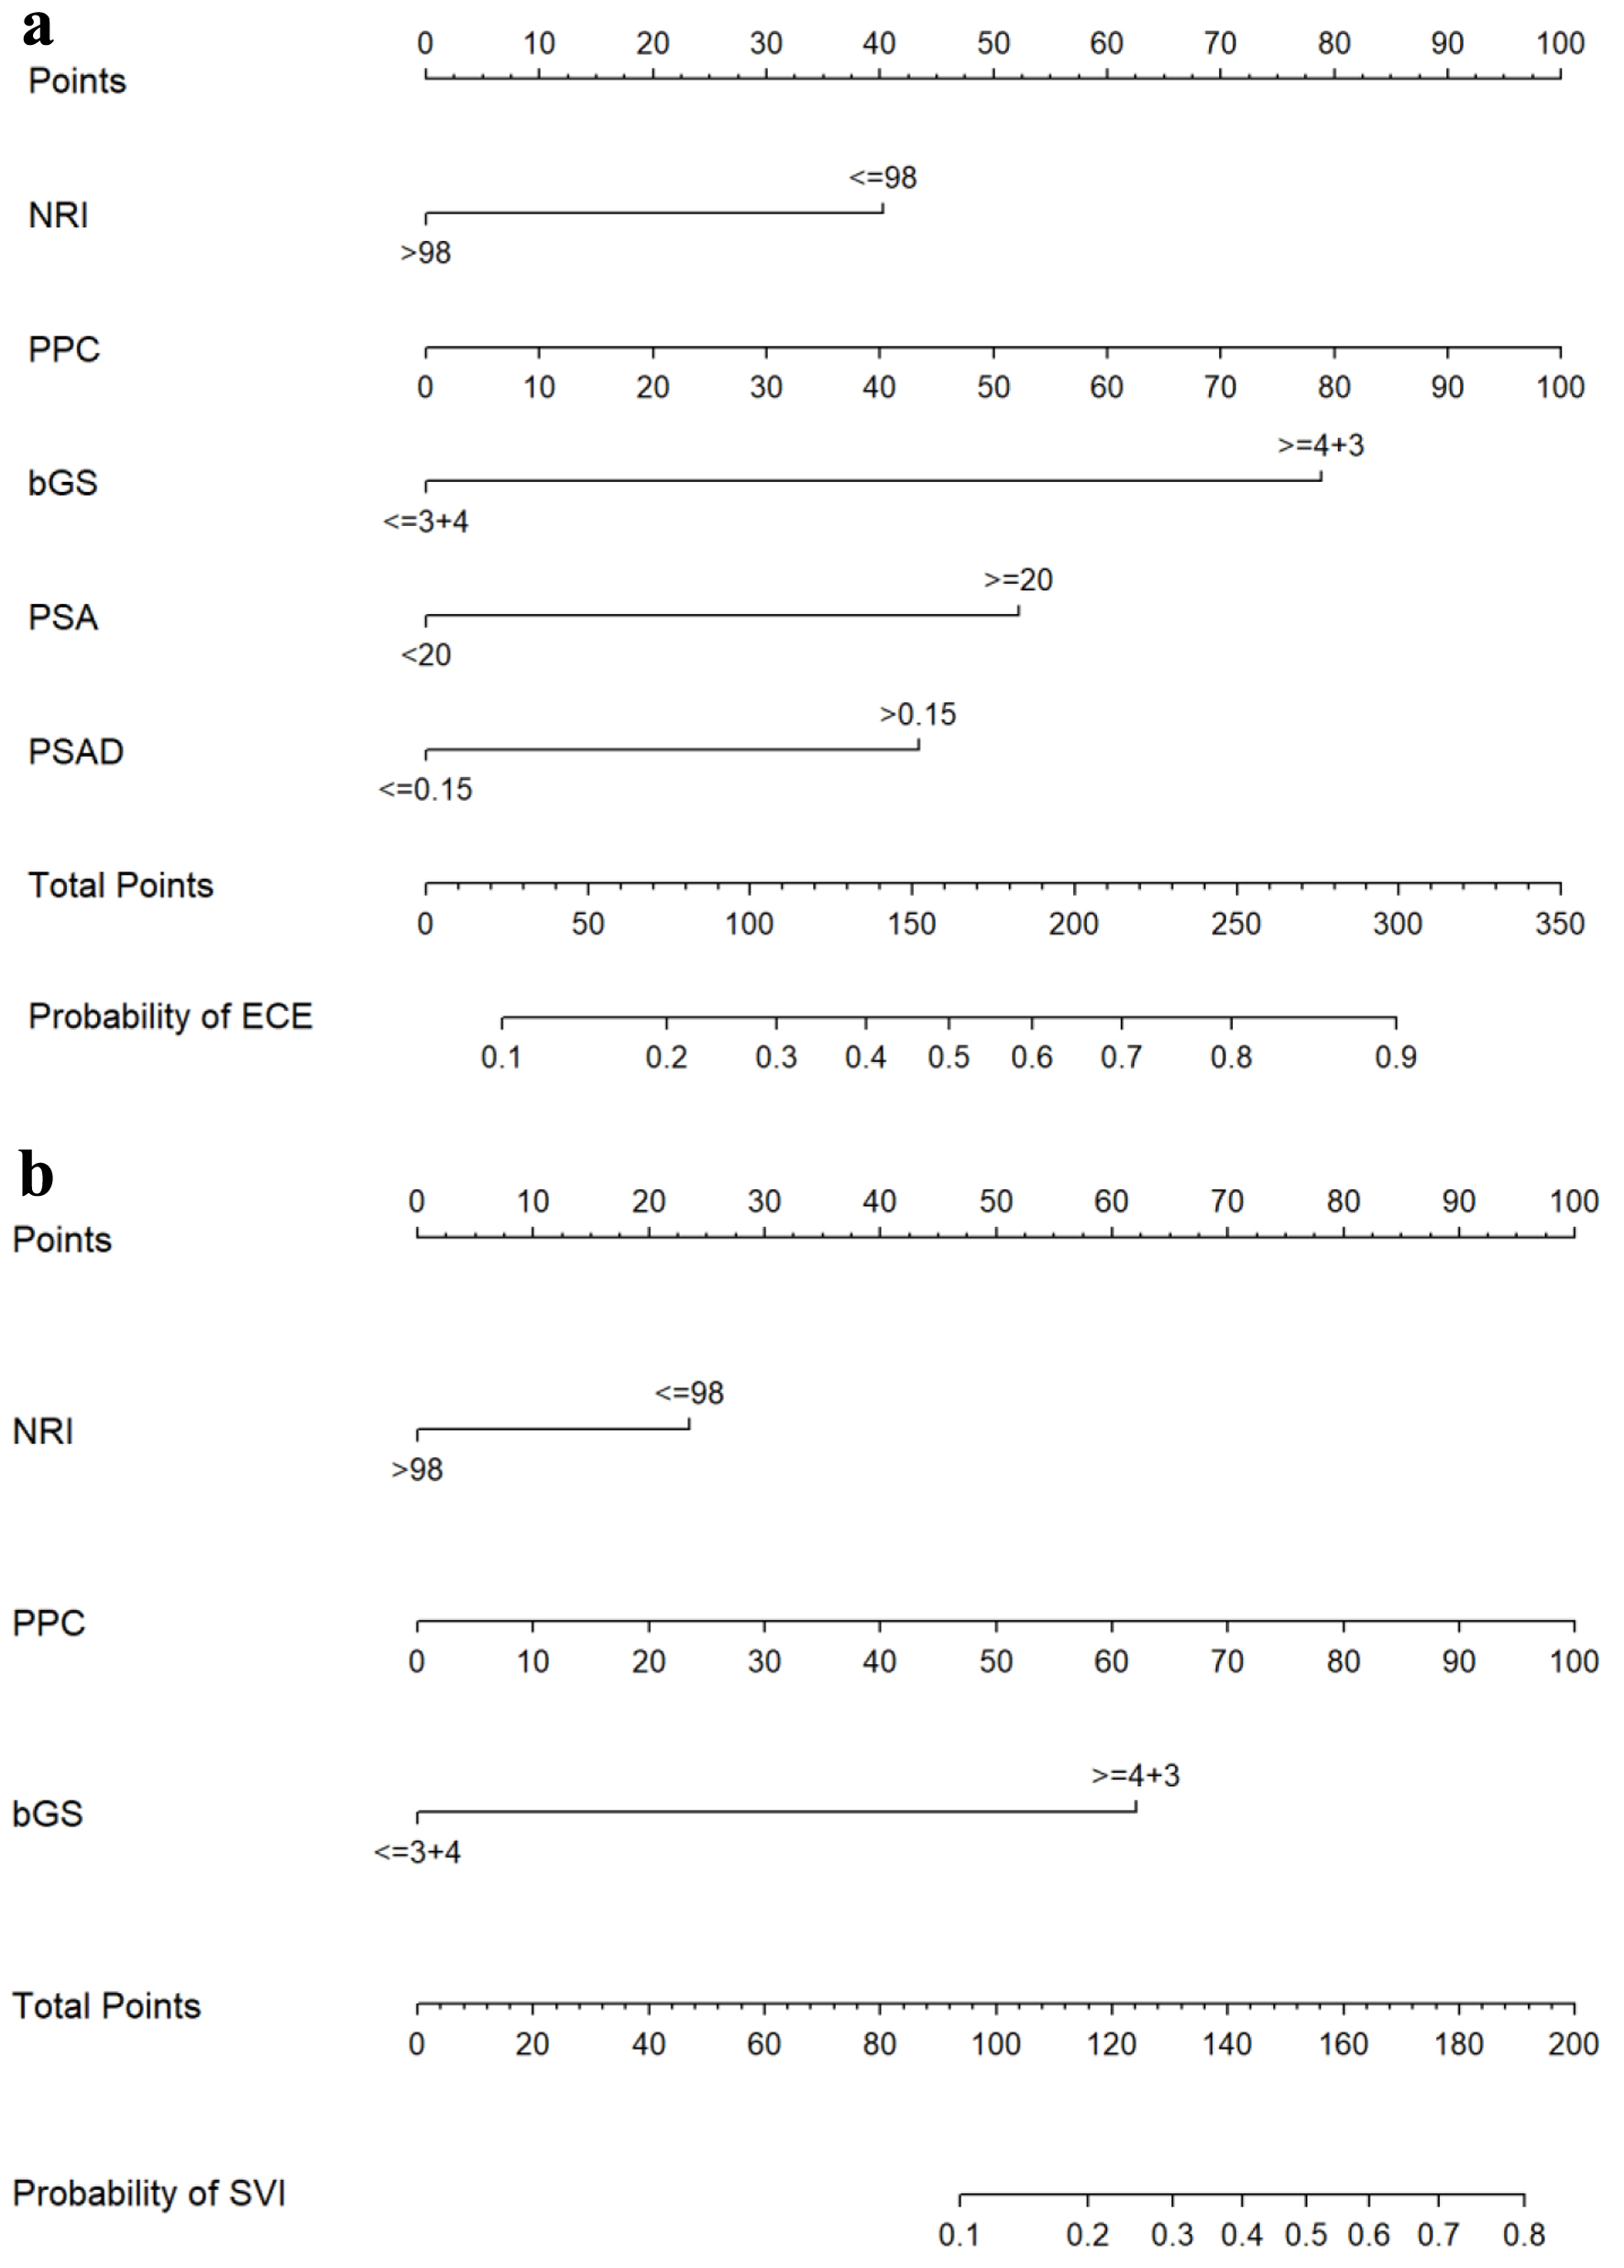
Figure 1. Nomograms for predicting ECE (a) and SVI (b). bGS: biopsy Gleason score; ECE: extracapsular extension; NRI: nutritional risk index; PPC: percentage of positive biopsy cores; PSA: prostate-specific antigen; PSAD: prostate-specific antigen density; SVI: seminal vesicle invasion.
Figure 2.
Figure 2. ROC curves for nomograms predicting ECE and SVI in the primary cohort (a) and validation cohort (b). Red curves for ECE; blue curves for SVI. AUC: area under curve; ECE: extracapsular extension; ROC: receiver operating characteristic; SVI: seminal vesicle invasion.
Figure 3.
Figure 3. Calibration curves for nomograms predicting ECE and SVI in the primary cohort (a: ECE; b: SVI) and validation cohort (c: ECE; d: SVI). ECE: extracapsular extension; SVI: seminal vesicle invasion.

Tables

Table 1. Baseline Characteristics of the Separate Patient Cohorts
 
CharacteristicsPrimary cohort (n = 489)Validation cohort (n = 245)P value
BMI: body mass index; DRE: digital rectal examination; ECE: extracapsular extension; IQR: interquartile range; NRI: nutritional risk index; PPC: percentage of positive biopsy cores; PSA: prostate-specific antigen; PSAD: prostate-specific antigen density; SVI: seminal vesicle invasion.
Age (years), median (IQR)69.0 (64.0 - 74.0)69.0 (65.0 - 75.5)0.246
BMI (kg/m2), n (%)0.030
  < 25252 (51.5%)147 (60.0%)
  ≥ 25237 (48.5%)98 (40.0%)
NRI, n (%)0.354
  > 98419 (85.7%)216 (88.2%)
  ≤ 9870 (14.3%)29 (11.8%)
DRE, n (%)0.387
  Normal388 (79.3%)201 (82.0%)
  Abnormal101 (20.7%)44 (18.0%)
PPC (%), median (IQR)41.7 (23.1 - 66.7)33.3 (21.4 - 58.3)0.034
Biopsy Gleason score, n (%)0.003
  ≤ 3+4190 (38.9%)123 (50.2%)
  ≥ 4+3299 (61.1%)122 (49.8%)
Preoperative PSA (ng/mL), n (%)0.258
  < 20350 (71.6%)185 (75.5%)
  ≥ 20139 (28.4%)60 (24.5%)
Prostate volume (mL), median (IQR)35.6 (25.4 - 48.8)34.8 (23.4 - 50.7)0.674
PSAD, n (%)0.879
  ≤ 0.1582 (16.8%)40 (16.3%)
  > 0.15407 (83.2%)205 (83.7%)
ECE, n (%)0.049
  Absent260 (53.2%)149 (60.8%)
  Present229 (46.8%)96 (39.2%)
SVI, n (%)0.071
  Absent404 (82.6%)215 (87.8%)
  Present85 (17.4%)30 (12.2%)


Table 2. Clinicopathologic Characteristics of Patients in Primary Cohort
 
CharacteristicsMalnutrition (NRI ≤ 98, n = 70)Normal nutrition (NRI > 98, n = 419)P value
BMI: body mass index; DRE: digital rectal examination; ECE: extracapsular extension; IQR: interquartile range; NRI: nutritional risk index; PPC: percentage of positive biopsy cores; PSA: prostate-specific antigen; PSAD: prostate-specific antigen density; SVI: seminal vesicle invasion.
Age (years), median (IQR)70.5 (65.0 - 76.0)69.0 (64.0 - 74.0)0.030
BMI (kg/m2), n (%)0.010
  < 2546 (65.7%)206 (49.2%)
  ≥ 2524 (34.3%)213 (50.8%)
DRE, n (%)0.642
  Normal57 (81.4%)331 (79.0%)
  Abnormal13 (18.6%)88 (21.0%)
PPC (%), median (IQR)41.7 (16.7-73.3)41.7 (24.1-66.7)0.607
Biopsy Gleason score, n (%)0.751
  ≤ 3+426 (37.1%)164 (39.1%)
  ≥ 4+344 (62.9%)255 (60.9%)
Preoperative PSA (ng/mL), n (%)0.020
  < 2042 (60.0%)308 (73.5%)
  ≥ 2028 (40.0%)111 (26.5%)
Prostate volume (mL), median (IQR)37.3 (27.4 - 46.8)35.1 (25.1 - 49.1)0.606
PSAD, n (%)0.196
  ≤ 0.158 (11.4%)74 (17.7%)
  > 0.1562 (88.6%)345 (82.3%)
ECE, n (%)0.017
  Absent28 (40.0%)232 (55.4%)
  Present42 (60.0%)187 (44.6%)
SVI, n (%)0.020
  Absent51 (72.9%)353 (84.2%)
  Present19 (27.1%)66 (15.8%)


Table 3. Univariate and Multivariate Analyses for ECE in Primary Cohort
 
VariablesUnivariate analysisMultivariate analysis
OR (95% CI)P valueOR (95% CI)P value
BMI: body mass index; CI: confidence interval; DRE: digital rectal examination; ECE: extracapsular extension; NRI: nutritional risk index; OR: odds ratio; PPC: percentage of positive biopsy cores; PSA: prostate-specific antigen; PSAD: prostate-specific antigen density; Ref: reference.
Age (years)0.992 (0.968 - 1.016)0.503
BMI (kg/m2)
  < 25Ref
  ≥ 251.034 (0.725 - 1.475)0.854
NRI
  > 98RefRef
  ≤ 981.861 (1.111 - 3.116)0.0181.901 (1.050 - 3.440)0.034
DRE
  NormalRef
  Abnormal1.330 (0.858 - 2.062)0.203
PPC (%)1.026 (1.019 - 1.033)< 0.0011.016 (1.008 - 1.024)< 0.001
Biopsy Gleason score
  ≤ 3+4RefRef
  ≥ 4+35.385 (3.574 - 8.114)< 0.0013.520 (2.263 - 5.475)< 0.001
Preoperative PSA (ng/mL)
  < 20RefRef
  ≥ 204.610 (2.993 - 7.099)< 0.0012.299 (1.406 - 3.758)0.001
Prostate volume (mL)0.996 (0.988 - 1.005)0.384
PSAD
  ≤ 0.15RefRef
  > 0.153.828 (2.191 - 6.687)< 0.0012.000 (1.077 - 3.713)0.028


Table 4. Univariate and Multivariate Analyses for SVI in Primary Cohort
 
VariablesUnivariate analysisMultivariate analysis
OR (95% CI)P valueOR (95% CI)P value
BMI: body mass index; CI: confidence interval; DRE: digital rectal examination; NRI: nutritional risk index; OR: odds ratio; PPC: percentage of positive biopsy cores; PSA: prostate-specific antigen; PSAD: prostate-specific antigen density; Ref: reference; SVI: seminal vesicle invasion.
Age (years)0.987 (0.956 - 1.018)0.408
BMI (kg/m2)
  < 25Ref
  ≥ 250.742 (0.463 - 1.190)0.216
NRI
  > 98RefRef
  ≤ 981.993 (1.106 - 3.590)0.0222.255 (1.088 - 4.676)0.029
DRE
  NormalRef
  Abnormal0.718 (0.386 - 1.336)0.296
PPC (%)1.043 (1.033 - 1.053)< 0.0011.034 (1.023 - 1.045)< 0.001
Biopsy Gleason score
  ≤ 3+4RefRef
  ≥ 4+317.278 (6.213 - 48.047)< 0.0018.626 (2.986 - 24.915)< 0.001
Preoperative PSA (ng/mL)
  < 20RefRef
  ≥ 204.749 (2.909 - 7.751)< 0.0011.628 (0.882 - 3.004)0.119
Prostate volume (mL)1.001 (0.990 - 1.012)0.859
PSAD
  ≤ 0.15RefRef
  ≥ 0.153.051 (1.282 - 7.258)0.0121.072 (0.381 - 3.018)0.895