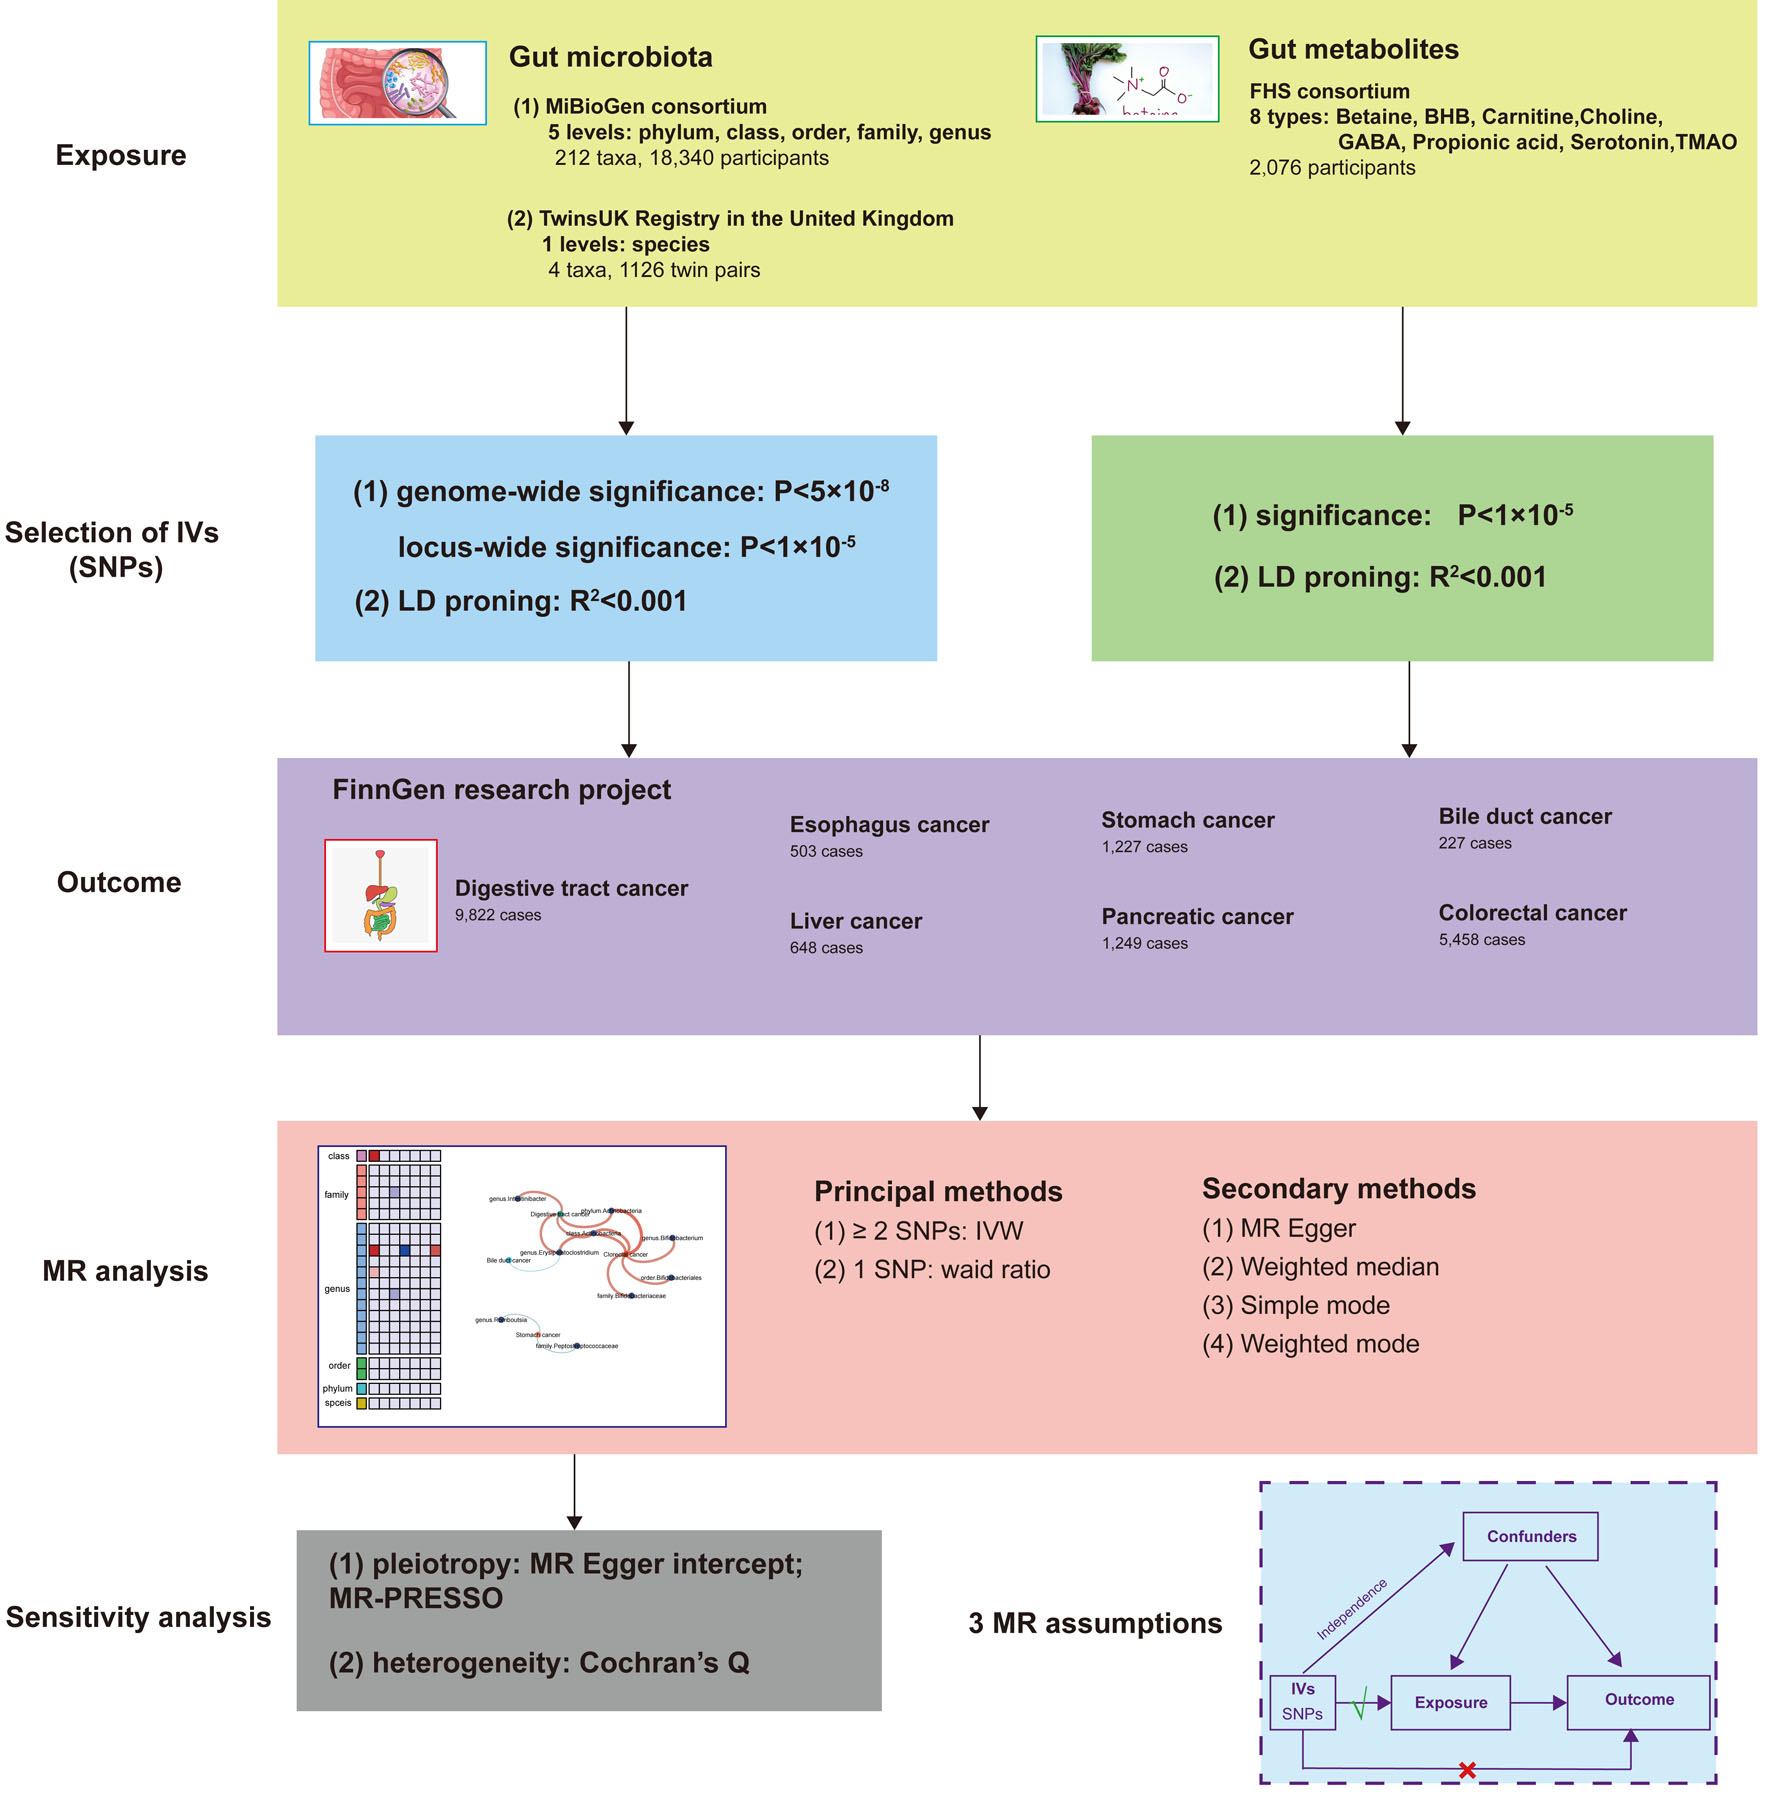
Figure 1. Study design of the two-sample MR for the effect of the genetically predicted gut microbiome and gut metabolites on digestive tract cancer. MiBioGen: international consortium MiBioGen; TwinsUK Registry: the UK adult twin registry; FHS: Framingham Heart Study; LD: linkage disequilibrium; SNP: single-nucleotide polymorphism; MR: Mendelian randomization; IVs: instrumental variables; IVW: inverse-variance weighted.
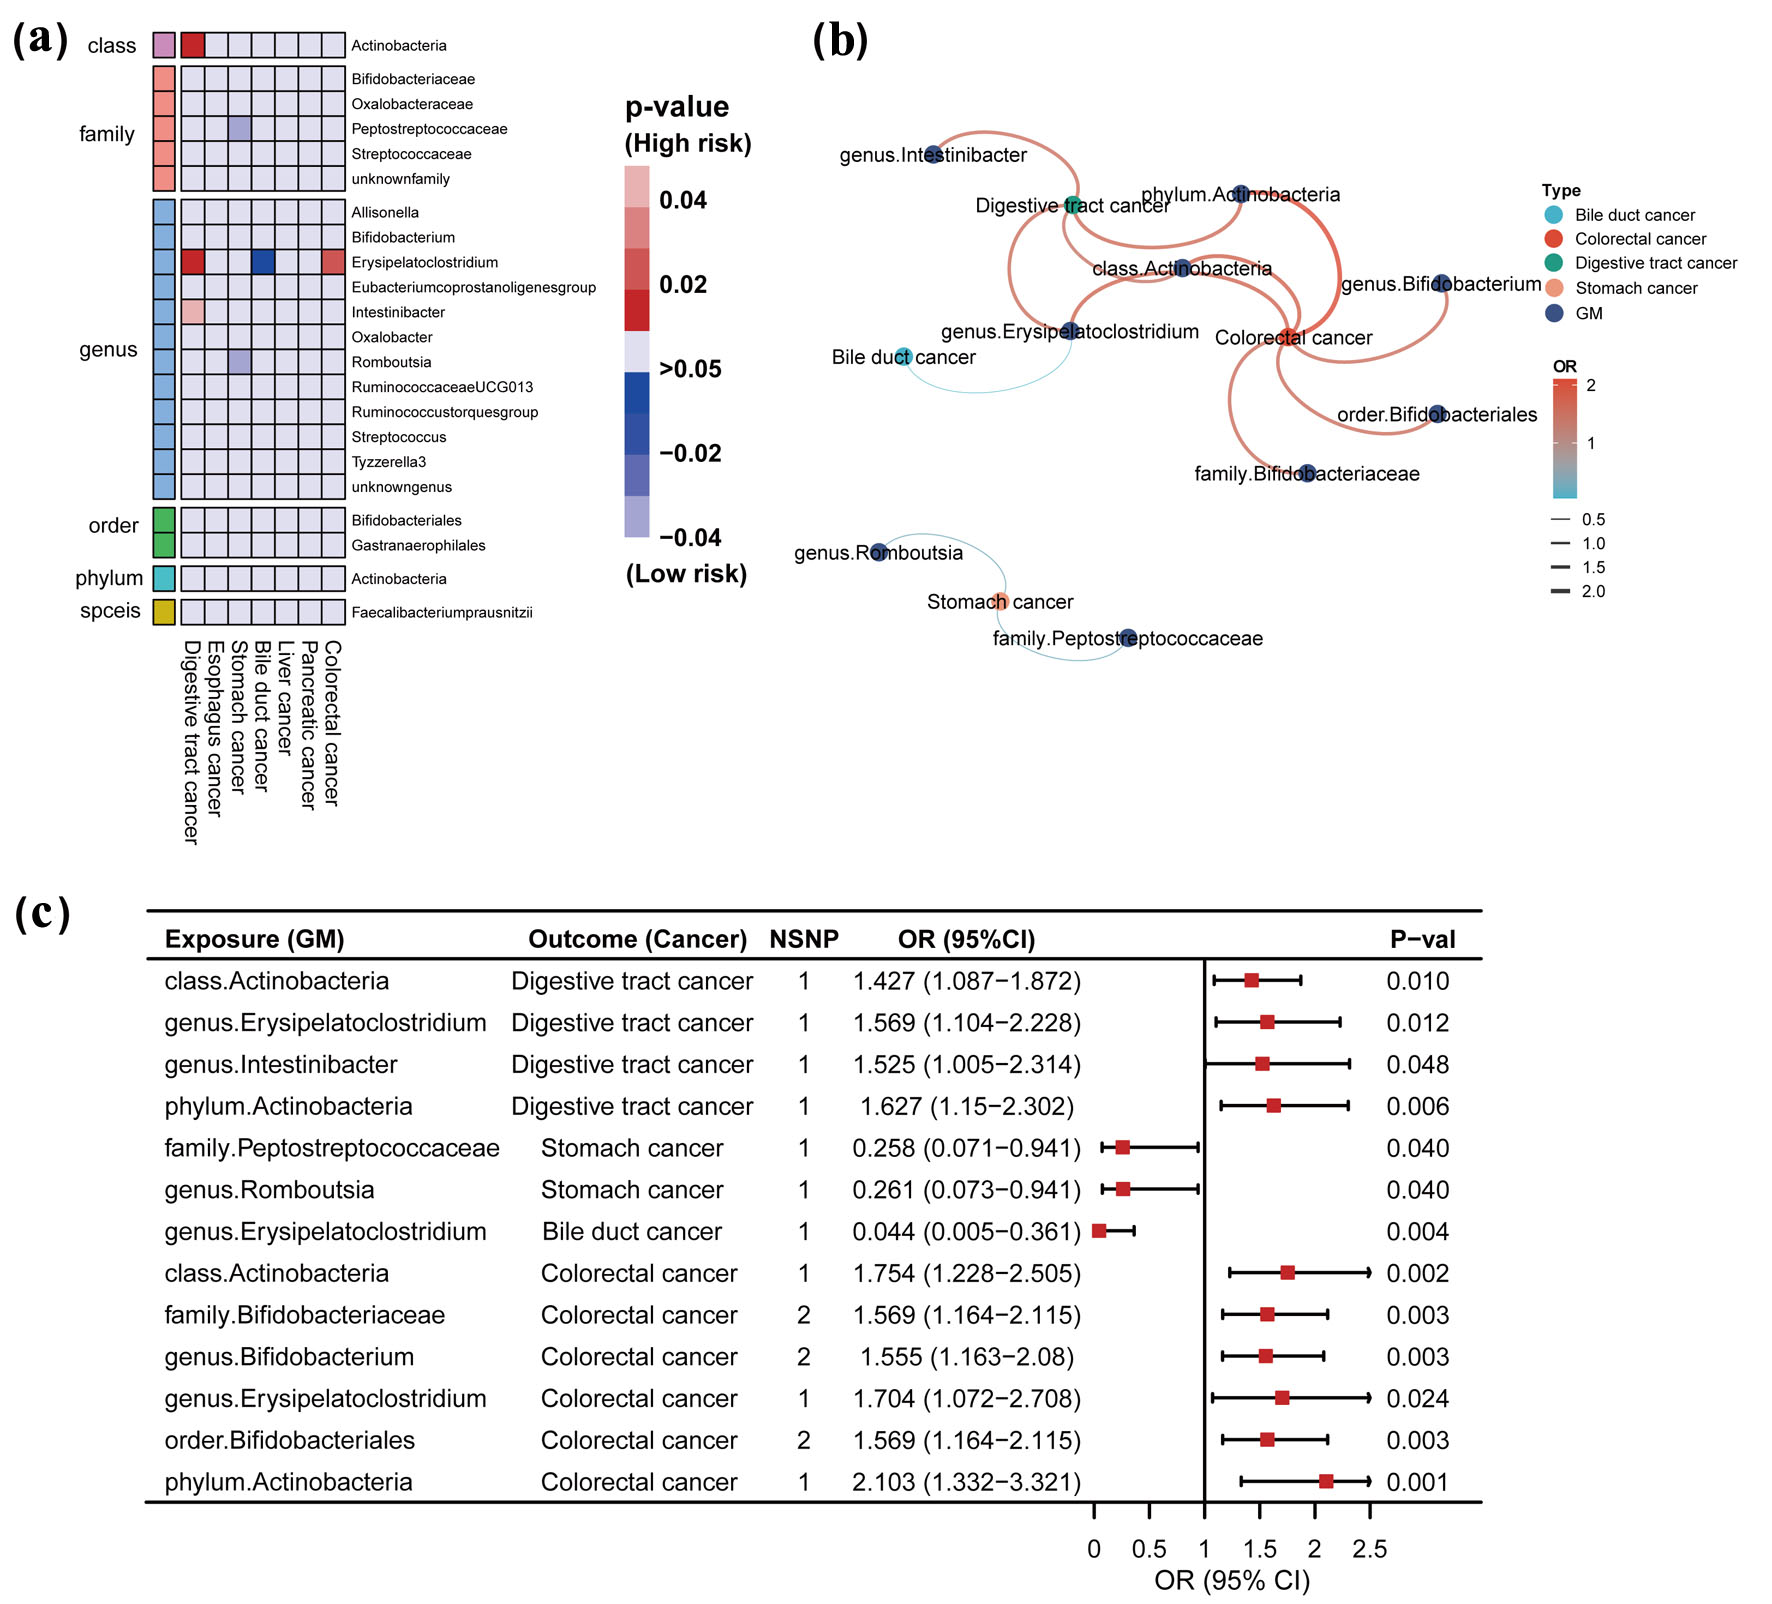
Figure 2. Causal effects of gut microbiome and digestive tract cancer based on the IVW method (SNPs with P < 5 × 10⁻⁸). (a) Heatmap of the P-value. Red color in the heatmap indicates a positive correlation between gut microbiome and digestive tract cancer and blue color indicates a negative correlation. The color depth represents the size of the P-value, with darker colors indicating more significant P-values. (b) Network interactions based on statistically significant ORs. Color and line thickness in the network diagram indicate the OR of gut microbiota and digestive tract cancer. Darker red color and thicker lines indicate higher OR values. (c) Forest plot with statistically significant ORs. OR > 1 indicates the positive correlation between a particular gut microbiota and a particular digestive tract cancer. OR < 1 indicates the negative correlation between the two. IVW: inverse-variance weighted; GM: gut microbiome; SNP: single-nucleotide polymorphism; OR: odds ratio; 95% CI: 95% confidence interval; NSNP: number of SNP.
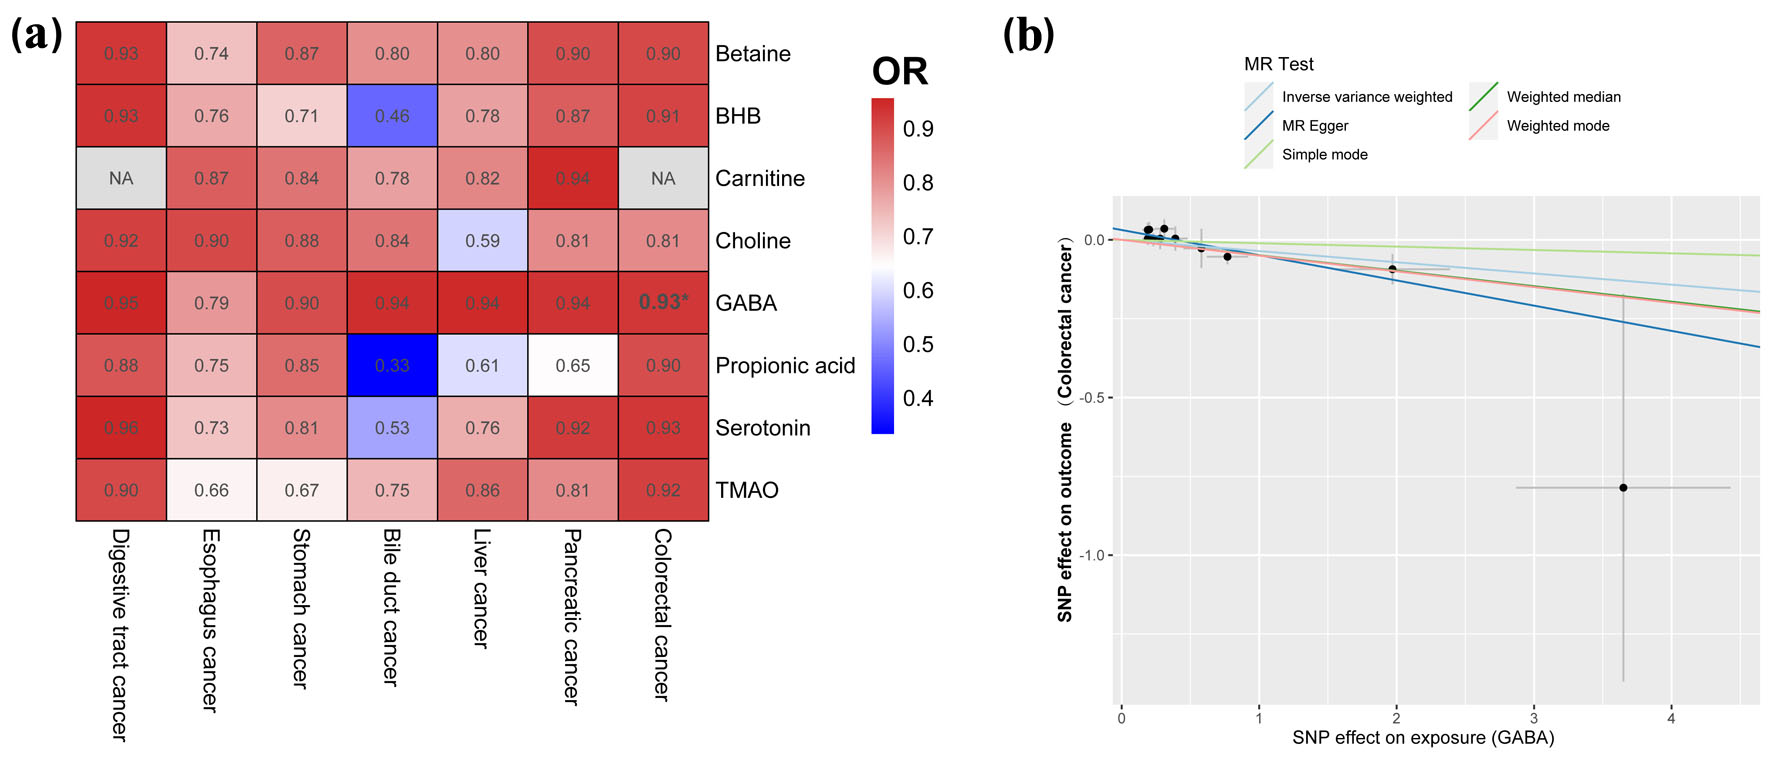
Figure 3. Causal effects of gut metabolite and digestive tract cancer based on the IVW method (SNPs with P < 1 × 10⁻⁵). (a) Heatmap of the ORs. Color in the heatmap indicates the OR of gut metabolite and digestive tract cancer. Darker red color indicates higher OR values. The asterisk indicates statistically significant OR. (b) Correlation between GABA and colorectal cancer. IVW: inverse-variance weighted; SNP: single-nucleotide polymorphism; OR: odds ratio; MR: Mendelian randomization.