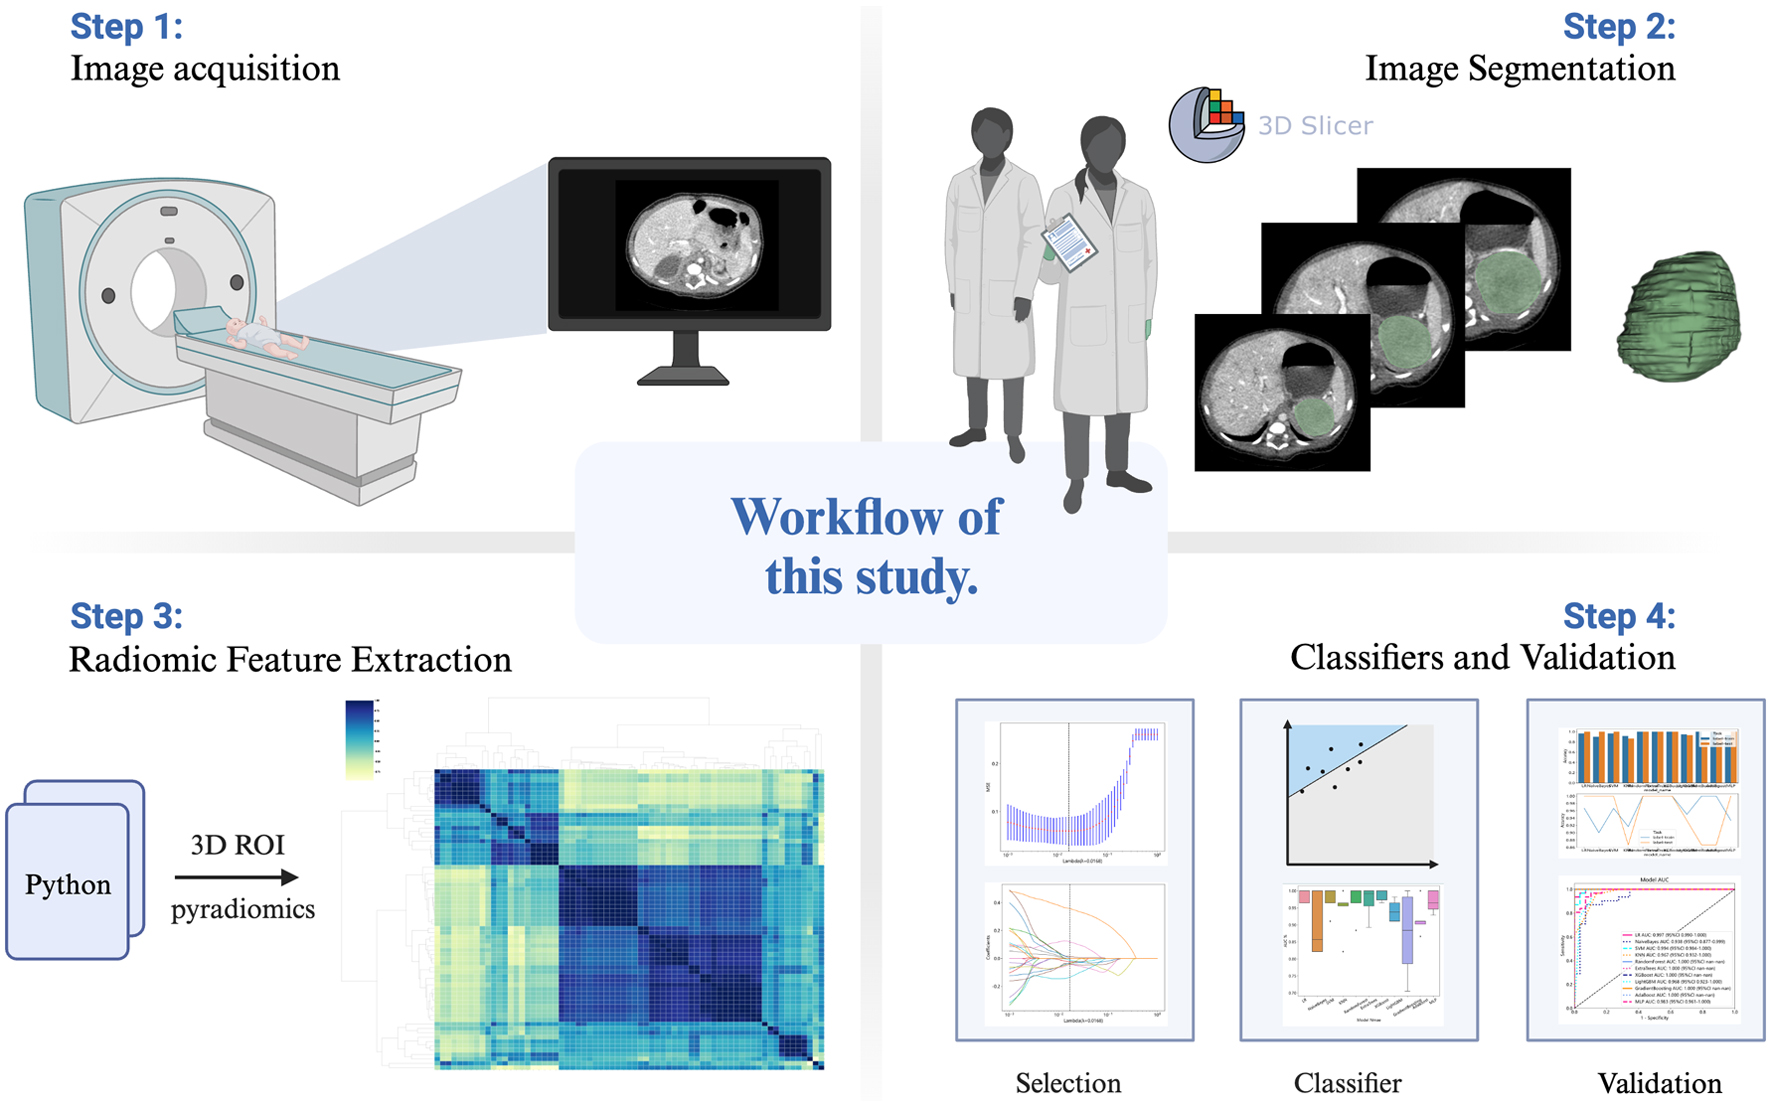
Figure 1. Workflow of this study.
| World Journal of Oncology, ISSN 1920-4531 print, 1920-454X online, Open Access |
| Article copyright, the authors; Journal compilation copyright, World J Oncol and Elmer Press Inc |
| Journal website https://www.wjon.org |
Original Article
Volume 15, Number 1, February 2024, pages 81-89
Application of Machine Learning and Deep EfficientNets in Distinguishing Neonatal Adrenal Hematomas From Neuroblastoma in Enhanced Computed Tomography Images
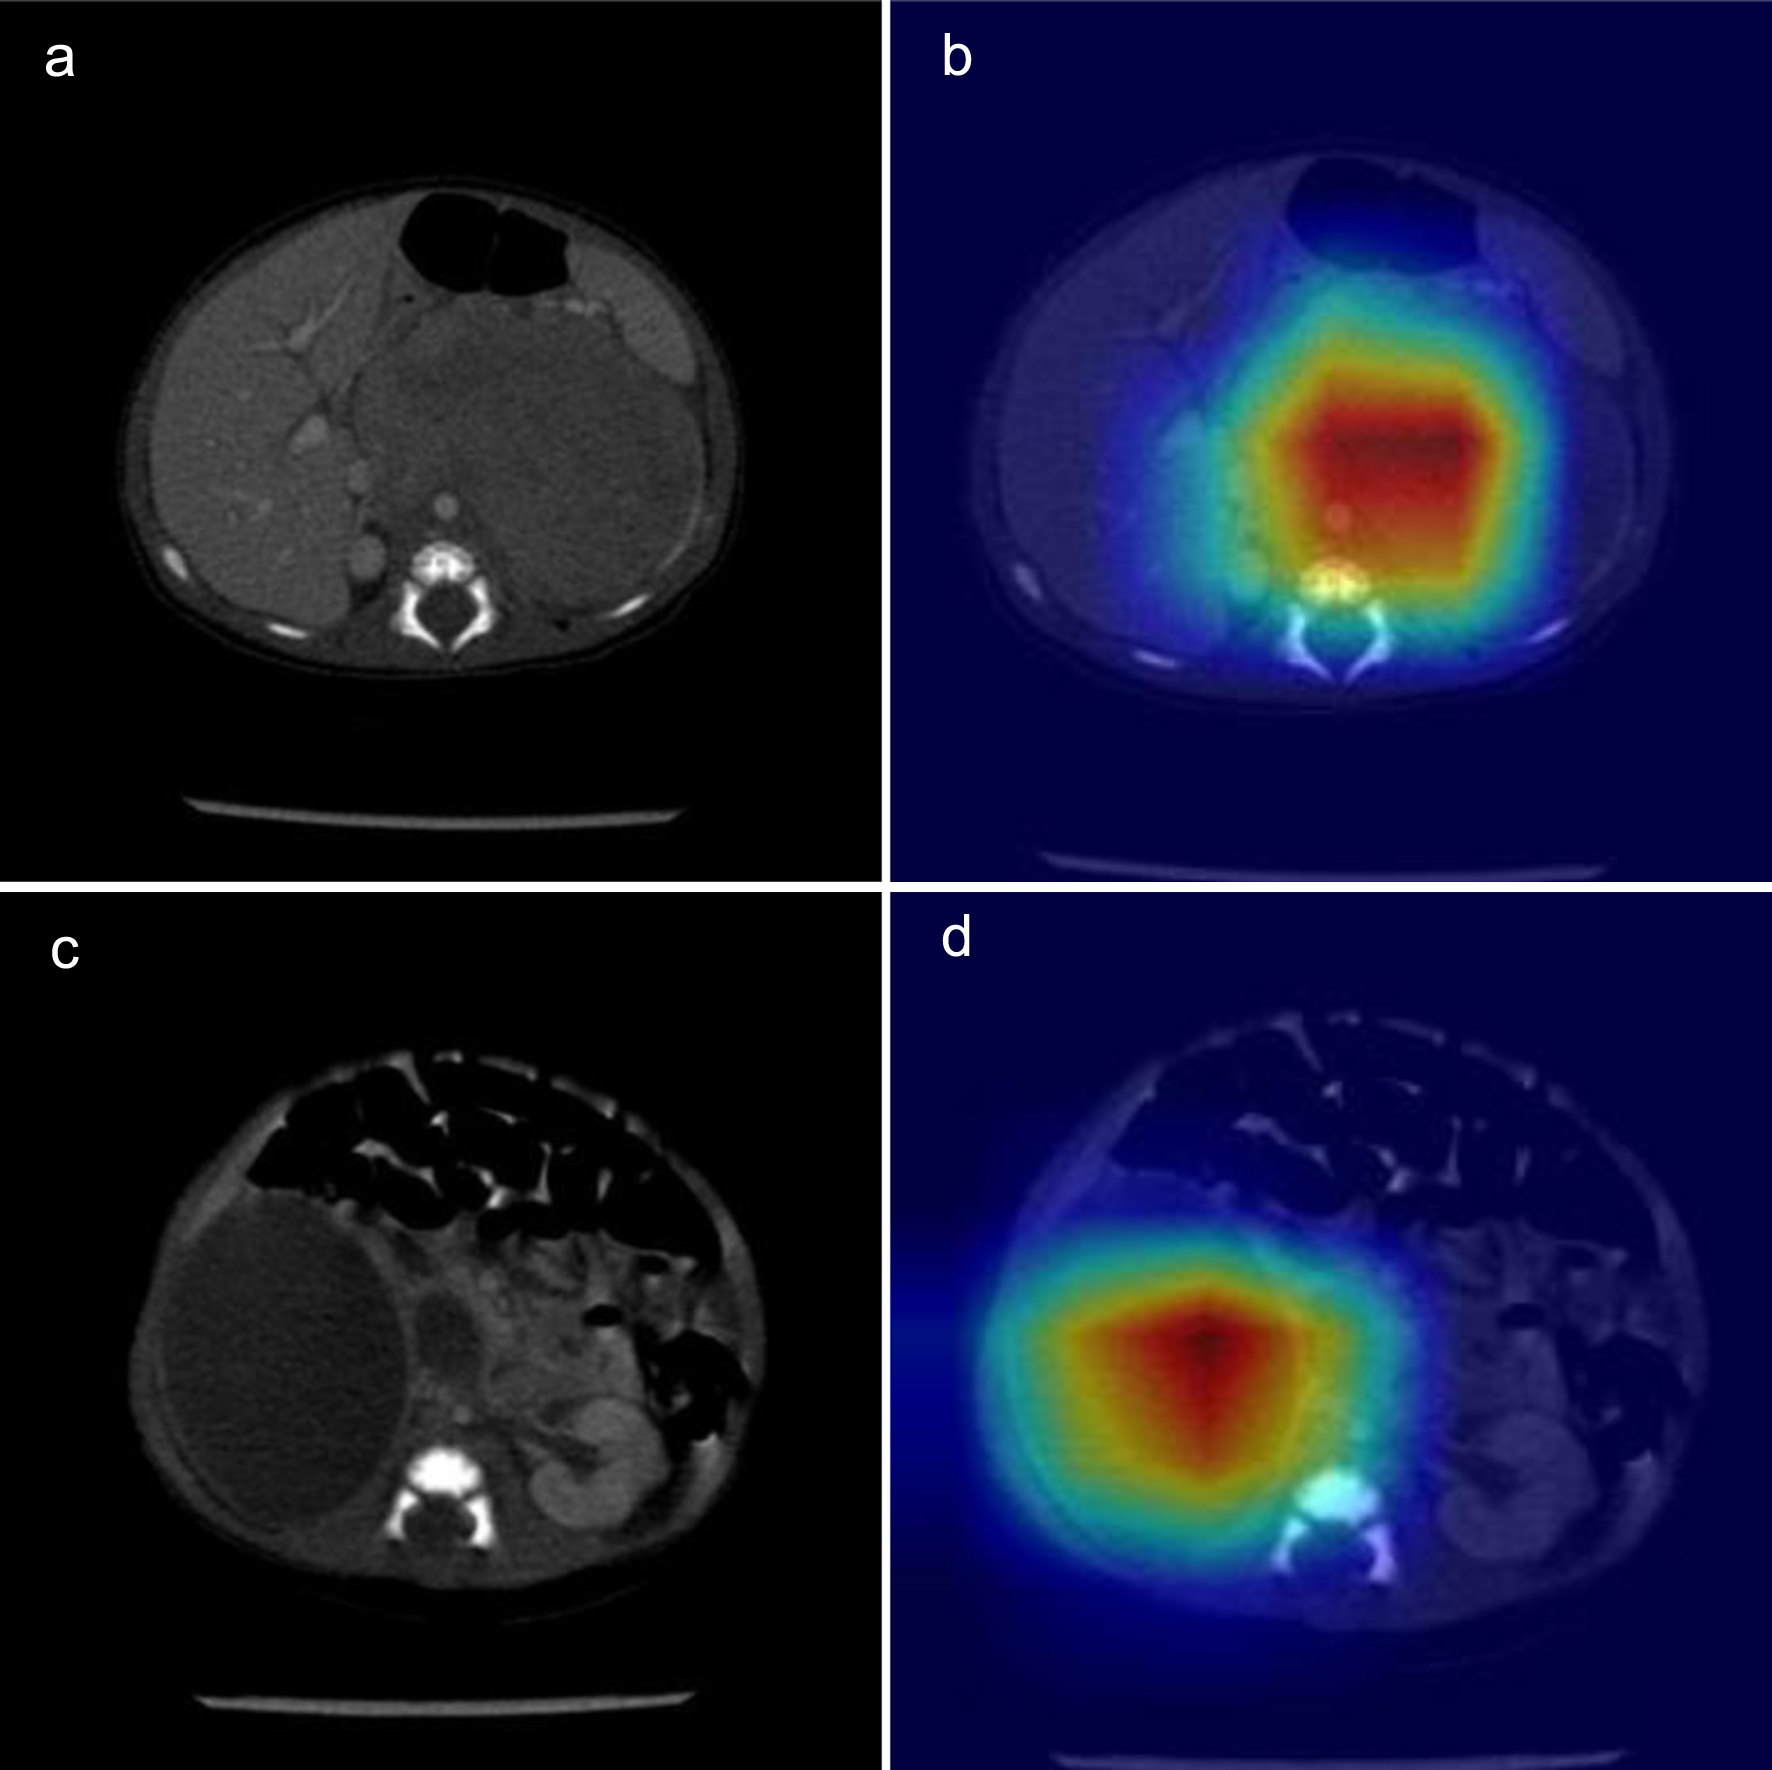
Figures
Tables
| Variable | Adrenal hematomas (N = 36) | Adrenal neuroblastoma (N = 40) | P-value |
|---|---|---|---|
| *P < 0.05. Continuous data are presented as median (interquartile range). Categorical data are presented as numbers (%). NSE: neuron-specific enolase; LDH: lactate dehydrogenase. | |||
| Time onset | |||
| Prenatal | 4 (11.1%) | 30 (75.0%) | < 0.001* |
| Postnatal | 32 (88.9%) | 10 (25.0%) | |
| Sex | |||
| Male | 19 (52.8%) | 25 (62.5%) | 0.391 |
| Female | 17 (47.2%) | 15 (37.5%) | |
| Localization | |||
| Left | 5 (13.9%) | 15 (37.5%) | 0.003* |
| Right | 31 (86.1%) | 21 (52.5%) | |
| Bilateral | 0 (0%) | 4 (10.0%) | |
| Weight (kg) | 3.56 (3.06 - 3.98) | 4.50 (3.65 - 6.50) | 0.001* |
| NSE (ng/mL) | 31.95 (22.37 - 42.17) | 45.65 (26.77 - 72.30) | 0.037* |
| Ferritin (µg/L) | 573.95 (359.85 - 769.23) | 318.90 (216.10 - 426.00) | < 0.001* |
| LDH (U/L) | 667.00 (441.50 - 881.50) | 299.00 (264.00 - 448.50) | < 0.001* |
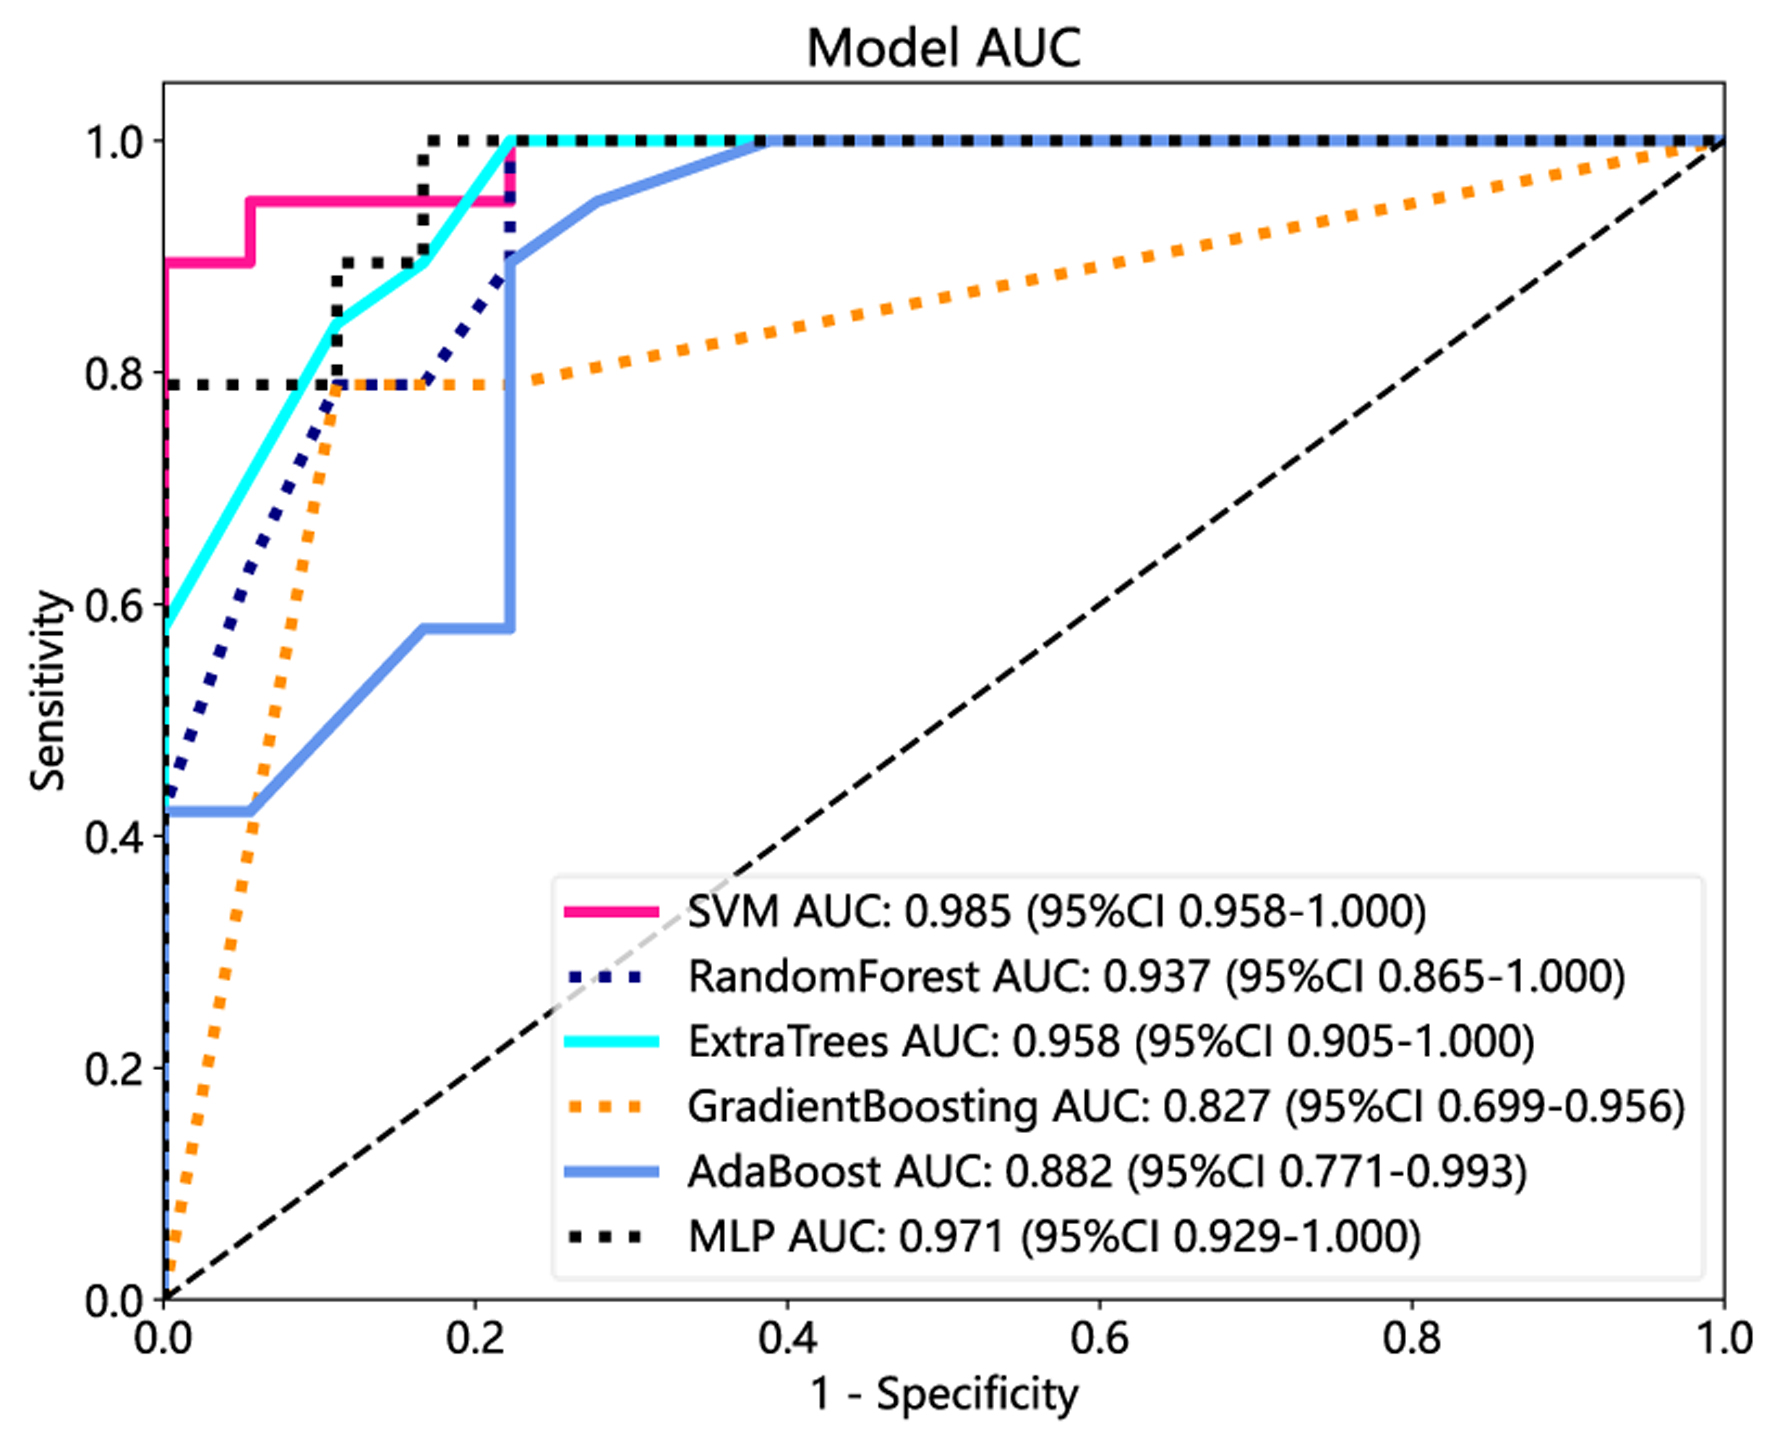
| Model name | AUC (95% CI) | Accuracy | Sensitivity | Specificity | PPV | NPV |
|---|---|---|---|---|---|---|
| CI: confidence interval; MLP: multi-layer perceptron; SVM: support vector machine; RF: random forest; AUC: area under the curve; NPV: negative prediction value; PPV: positive prediction value. | ||||||
| SVM | ||||||
| Training | 0.967 (0.900 - 1.00) | 0.974 | 0.944 | 1.000 | 1.000 | 0.952 |
| Test | 0.985 (0.958 - 1.00) | 0.946 | 1.000 | 0.895 | 0.900 | 1.000 |
| RF | ||||||
| Training | 1.000 (1.000 - 1.000) | 1.000 | 1.000 | 1.000 | 1.000 | 1.000 |
| Test | 0.937 (0.865 - 1.000) | 0.892 | 0.778 | 1.000 | 1.000 | 0.826 |
| Extra Trees | ||||||
| Training | 1.000 (1.000 - 1.000) | 1.000 | 1.000 | 1.000 | 1.000 | 1.000 |
| Test | 0.958 (0.905 - 1.000) | 0.892 | 0.778 | 1.000 | 1.000 | 0.826 |
| Gradient boosting | ||||||
| Training | 1.000 (1.000 - 1.000) | 1.000 | 1.000 | 1.000 | 1.000 | 1.000 |
| Test | 0.827 (0.699 - 0.956) | 0.838 | 0.889 | 1.000 | 0.800 | 0.882 |
| AdaBoost | ||||||
| Training | 0.967 (0.900 - 1.00) | 1.000 | 1.000 | 1.000 | 1.000 | 1.000 |
| Test | 0.882 (0.771 - 0.993) | 0.838 | 0.778 | 0.895 | 0.875 | 0.810 |
| MLP | ||||||
| Training | 0.969 (0.921 - 1.000) | 0.921 | 0.944 | 0.900 | 0.895 | 0.947 |
| Test | 0.971 (0.929 - 1.000) | 0.919 | 0.833 | 1.000 | 1.000 | 0.864 |