Figures
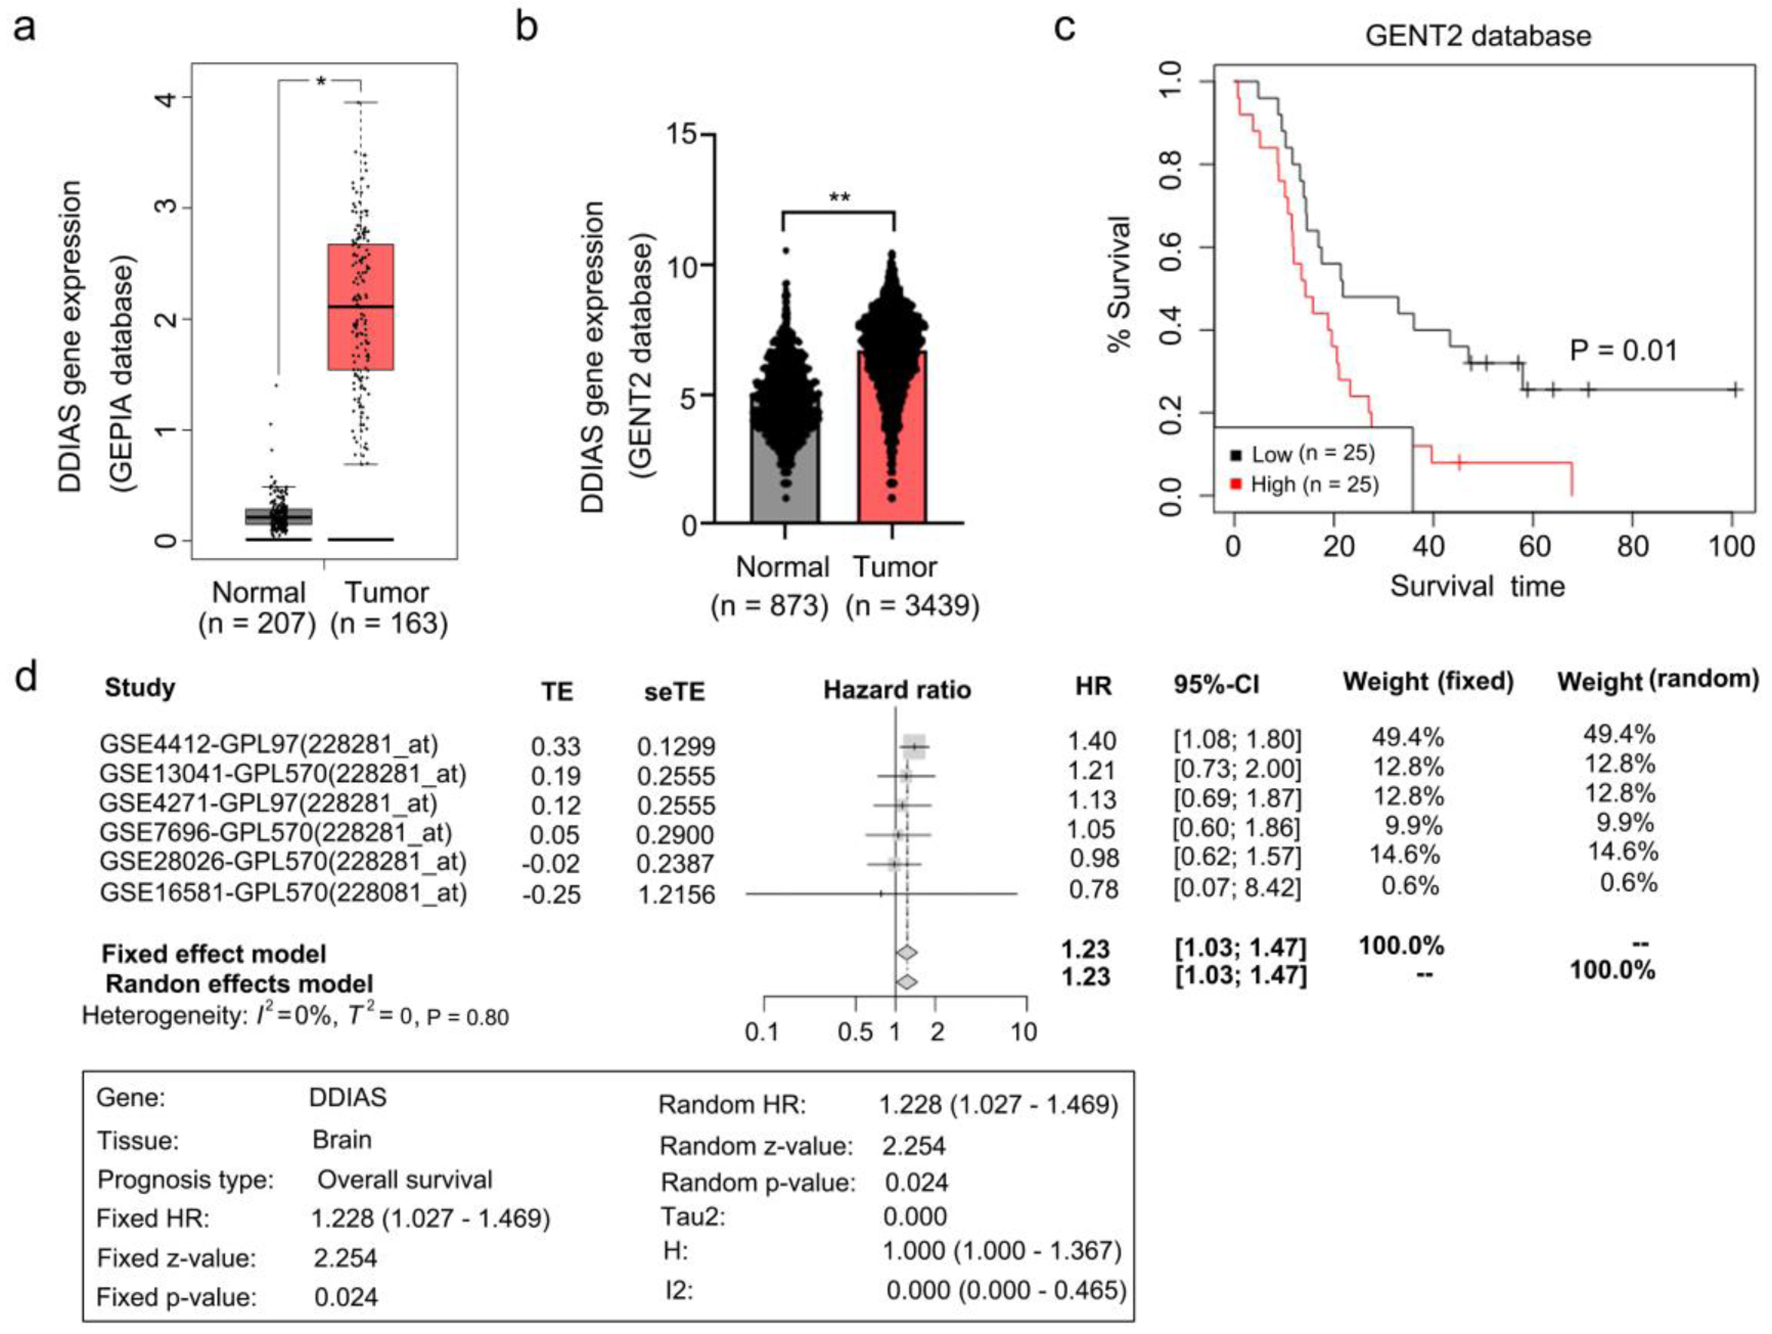
Figure 1. DDIAS is overexpressed in glioma and associated with glioma progression. (a, b) Expression of DDIAS in the GEPIA and GENT2 databases. (c) Overall survival analysis of patients with high or low DDIAS expression levels in the GENT2 database. (d) A meta-survival analysis by GENT2 was used to further confirm the prognostic relevance of DDIAS in glioma. *P < 0.05, **P < 0.01 as compared to the normal group. DDIAS: DNA damage-induced apoptosis suppressor; GEPIA: Gene Expression Profiling Interactive Analysis server; GENT2: Gene Expression database of Normal and Tumor tissue 2.
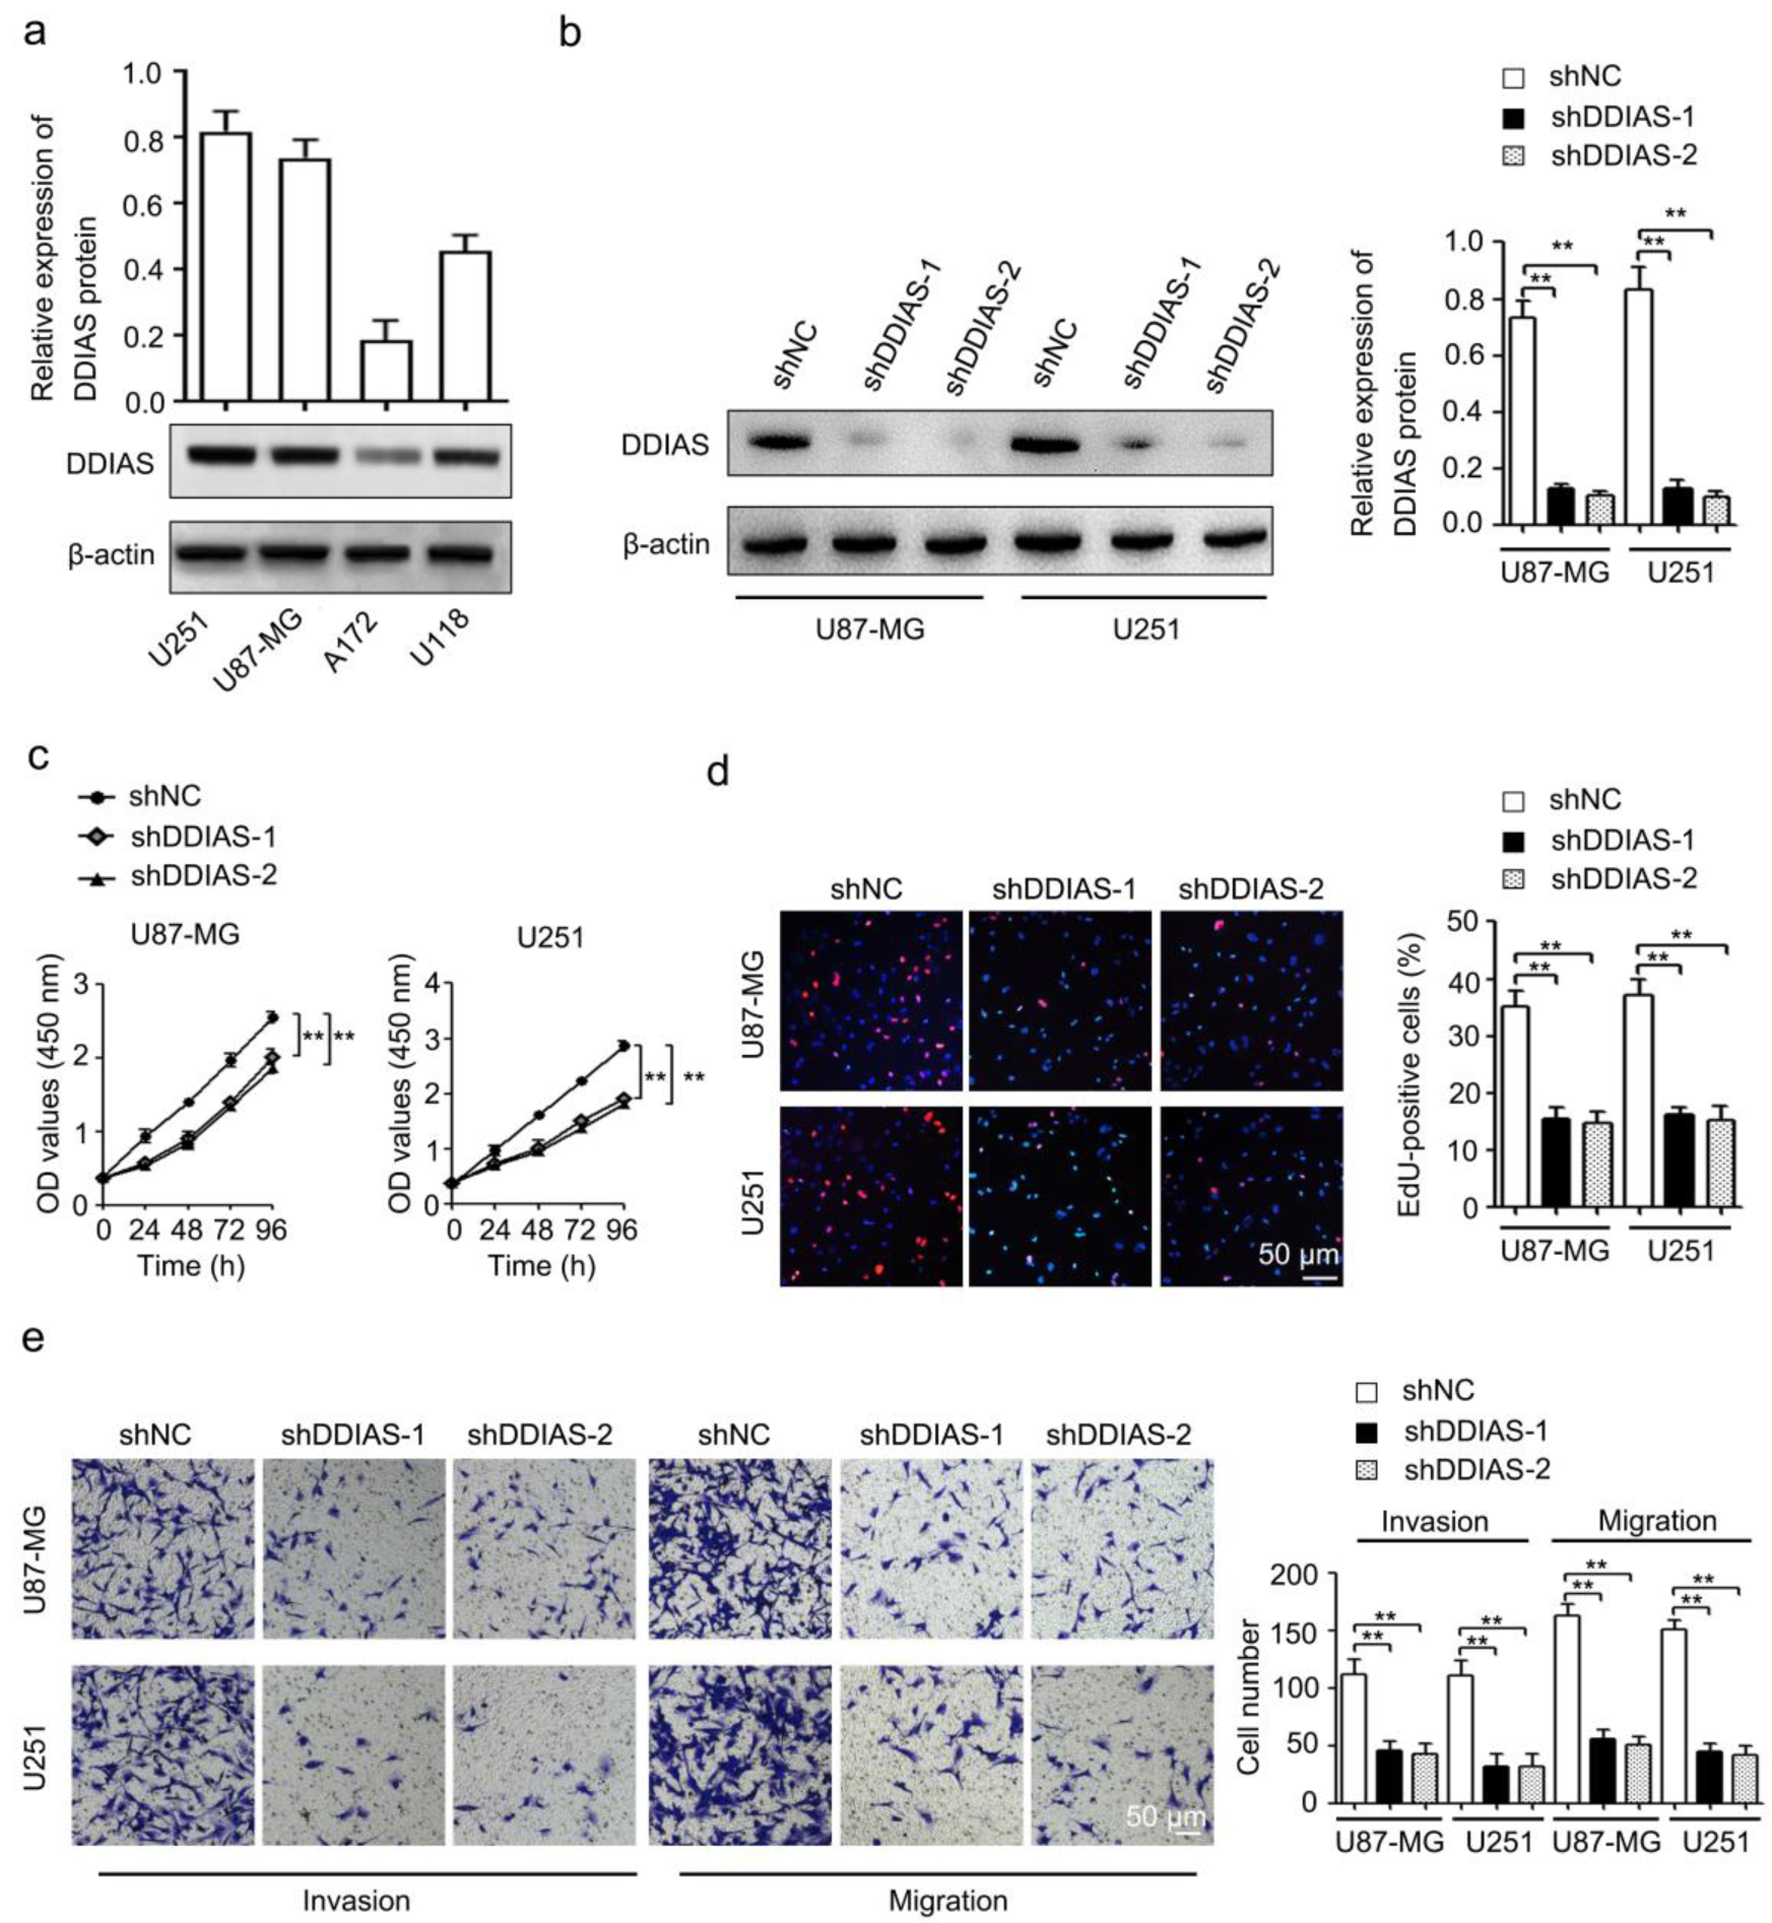
Figure 2. DDIAS downregulation inhibits cell viability, cell proliferation, invasion, and migration in glioma. (a) The protein expression levels of DDIAS in four glioma cell lines (U251, U87-MG, A172 and U118) were determined by western blotting. (b) The shDDIAS knockdown efficiency was determined at the protein level in U87-MG and U251 cells using western blotting. (c, d) CCK-8 and EdU assays were used to determine the cell viability and proliferation rates of U87-MG and U251 cells after transfection with shNC and shDDIAS. Scale bars, 50 µm. (e) The invasion and migration capacities of U87-MG and U251 cells with DDIAS knockdown were determined by Transwell assay. Scale bars, 50 µm. **P < 0.01 as compared to the shNC group. DDIAS: DNA damage-induced apoptosis suppressor; CCK-8: cell counting kit-8; shDDIAS: shRNA targeting DDIAS; shNC: shRNA negative control.
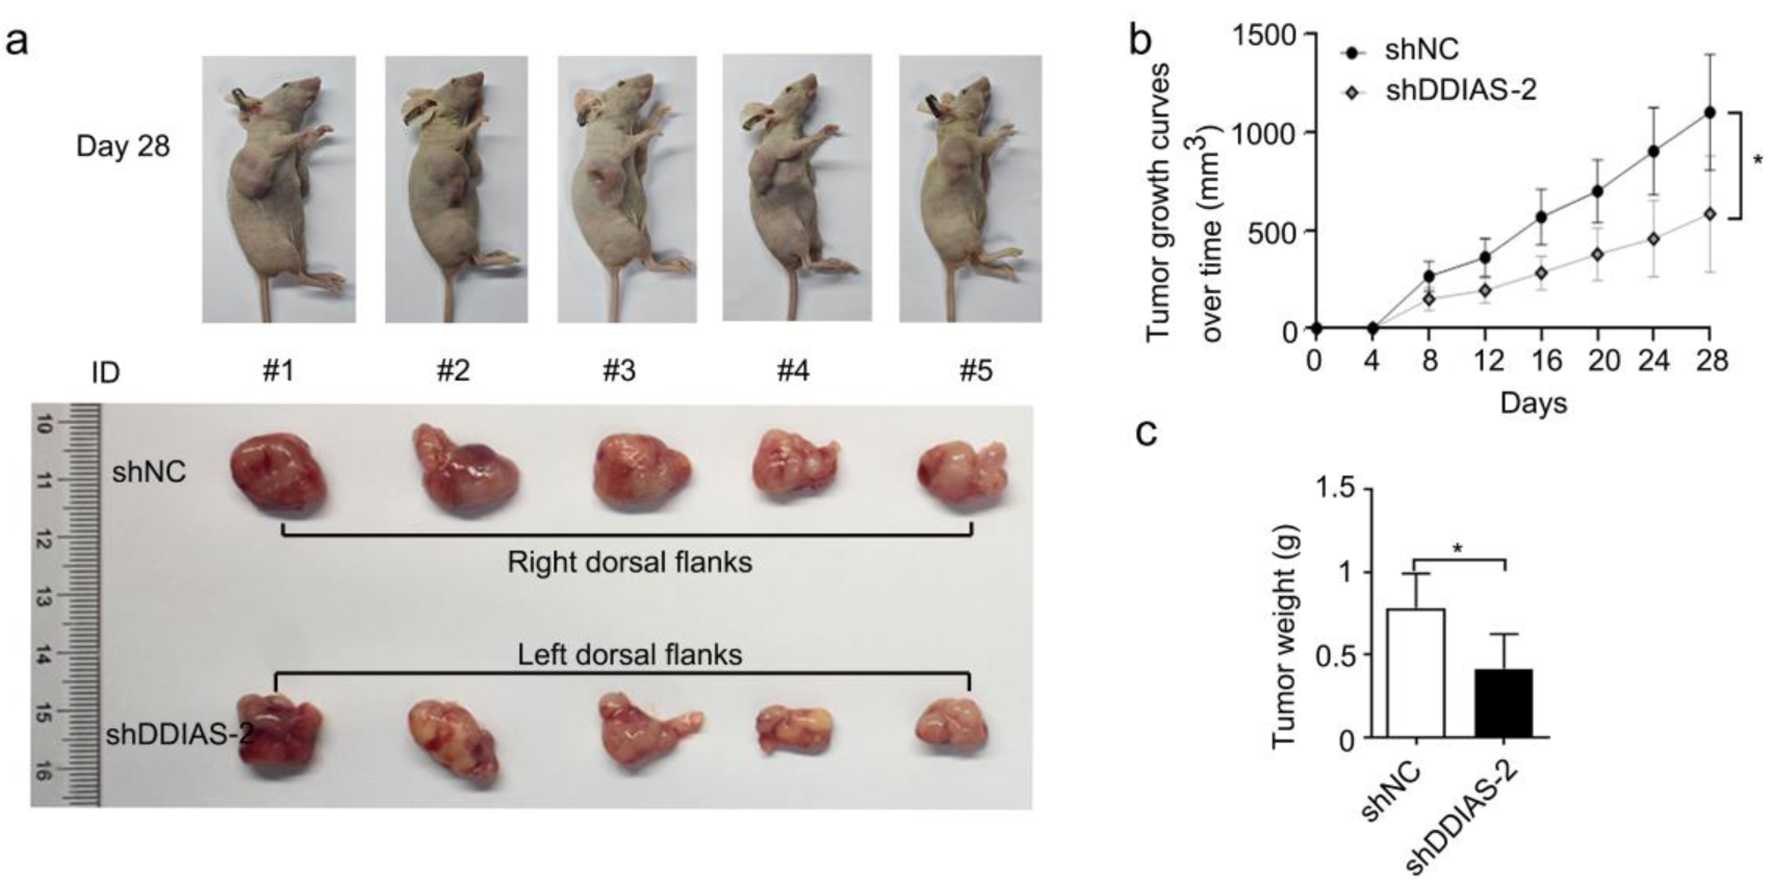
Figure 3. DDIAS knockdown inhibited glioma growth in vivo. (a) Representative images of mice and xenograft tumors of each group are shown. (b) The tumor volumes were measured every four days. (c) Weight of excised tumors in the shDDIAS-2 group and the shNC group. *P < 0.05 as compared to the shNC group. DDIAS: DNA damage-induced apoptosis suppressor; shDDIAS: shRNA targeting DDIAS; shNC: shRNA negative control.
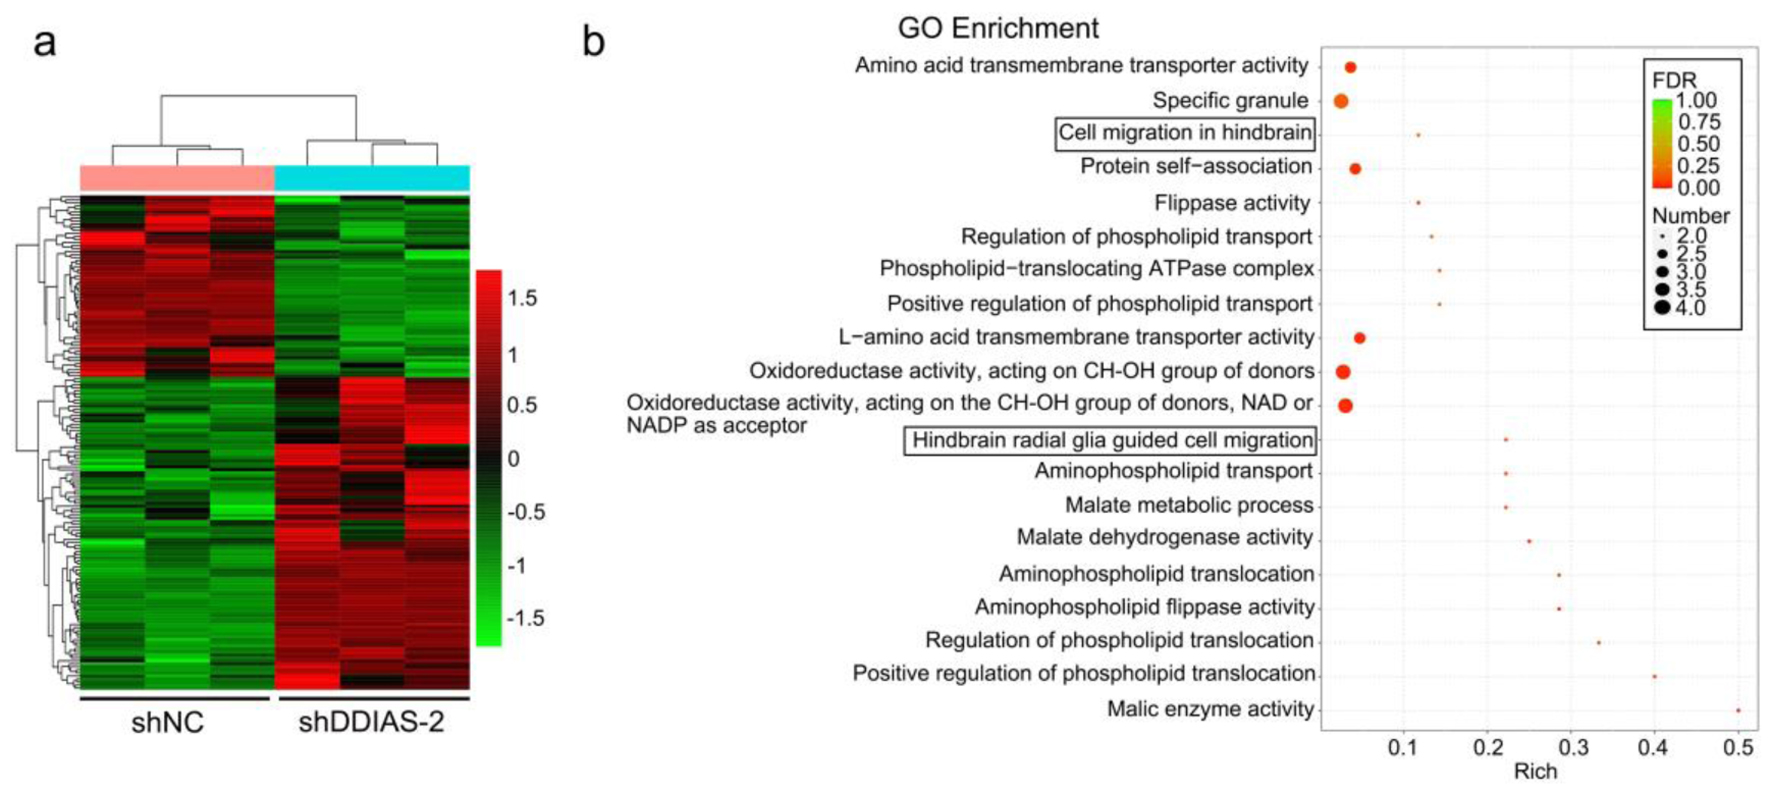
Figure 4. DDIAS downregulation induces DEGs in U251 cells. (a) Heatmaps showing the DEGs (FC, < -1-fold or > 1-fold) in U251 cells after transfection with shNC and shDDIAS-2. (b) GO enrichment of the downregulated genes in U251 cells after DDIAS knockdown. DDIAS: DNA damage-induced apoptosis suppressor; DEGs: differentially expressed genes; FC: fold change; shDDIAS: shRNA targeting DDIAS; shNC: shRNA negative control; GO: gene ontology.
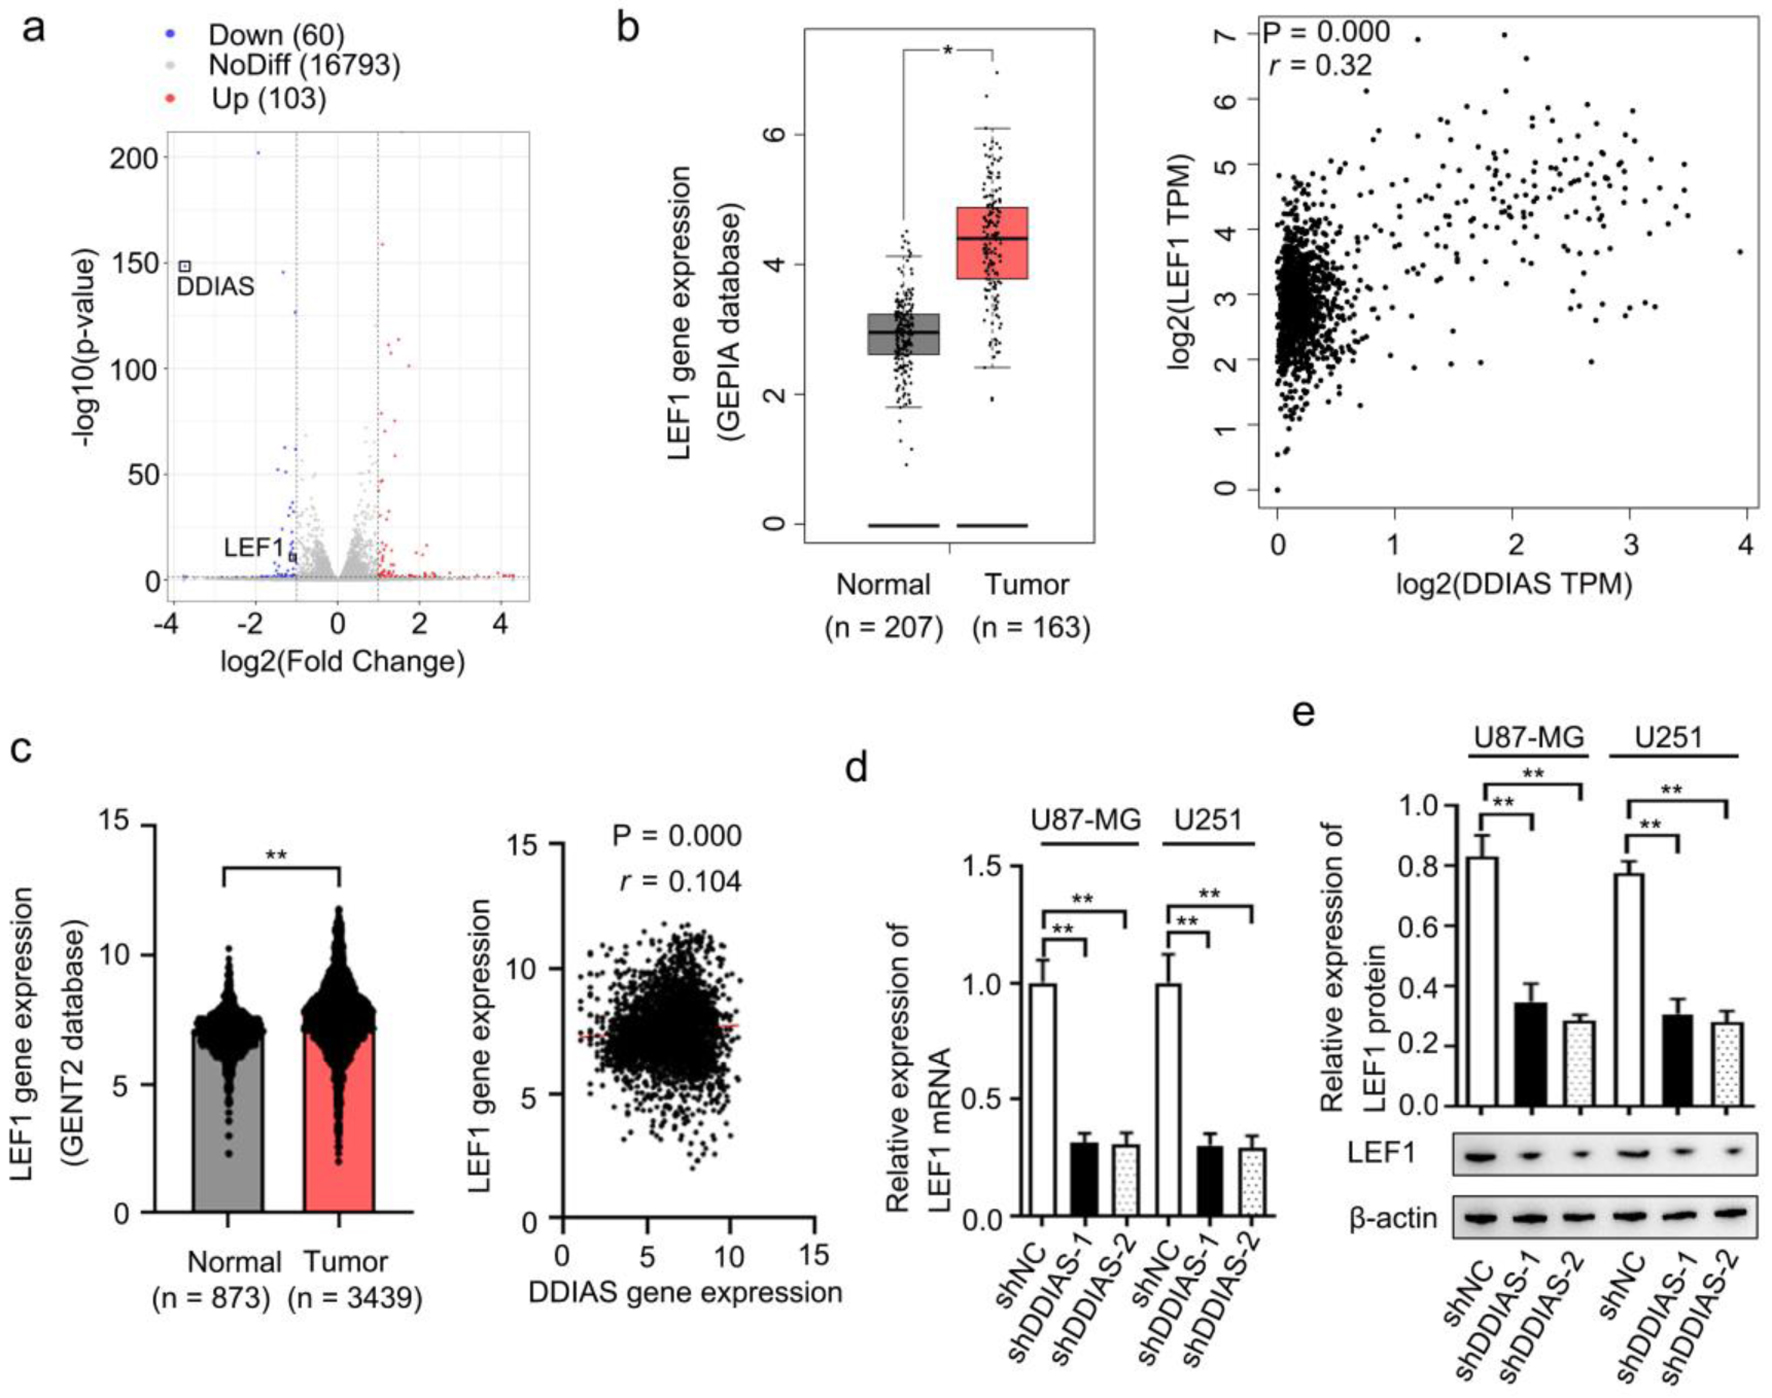
Figure 5. LEF1 was identified as the downstream effector of DDIAS. (a) Volcano plots showing the DEGs (FC, < -1-fold or > 1-fold) in U251 cells after DDIAS knockdown. (b) Expression of LEF1 in the GEPIA database. The association between DDIAS and LEF1 expression was determined by the Spearman’s correlation analysis (r = 0.32, P = 0.000). (c) Expression of LEF1 in the GENT2 database. The association between DDIAS and LEF1 expression was determined by the Spearman’s correlation analysis (r = 0.104, P = 0.000). (d, e) The effect of DDIAS knockdown on the expression levels of LEF1 mRNA and protein was measured by RT-qPCR and western blotting in U87-MG and U251 cells. *P < 0.05, **P < 0.01 as compared to the normal group or the shNC group. LEF1: lymphoid enhancer-binding factor 1; DDIAS: DNA damage-induced apoptosis suppressor; DEGs: differentially expressed genes; FC: fold change; GEPIA: Gene Expression Profiling Interactive Analysis server; GENT2: Gene Expression database of Normal and Tumor tissue 2; RT-qPCR: reverse transcription-quantitative polymerase chain reaction; shNC: shRNA negative control.
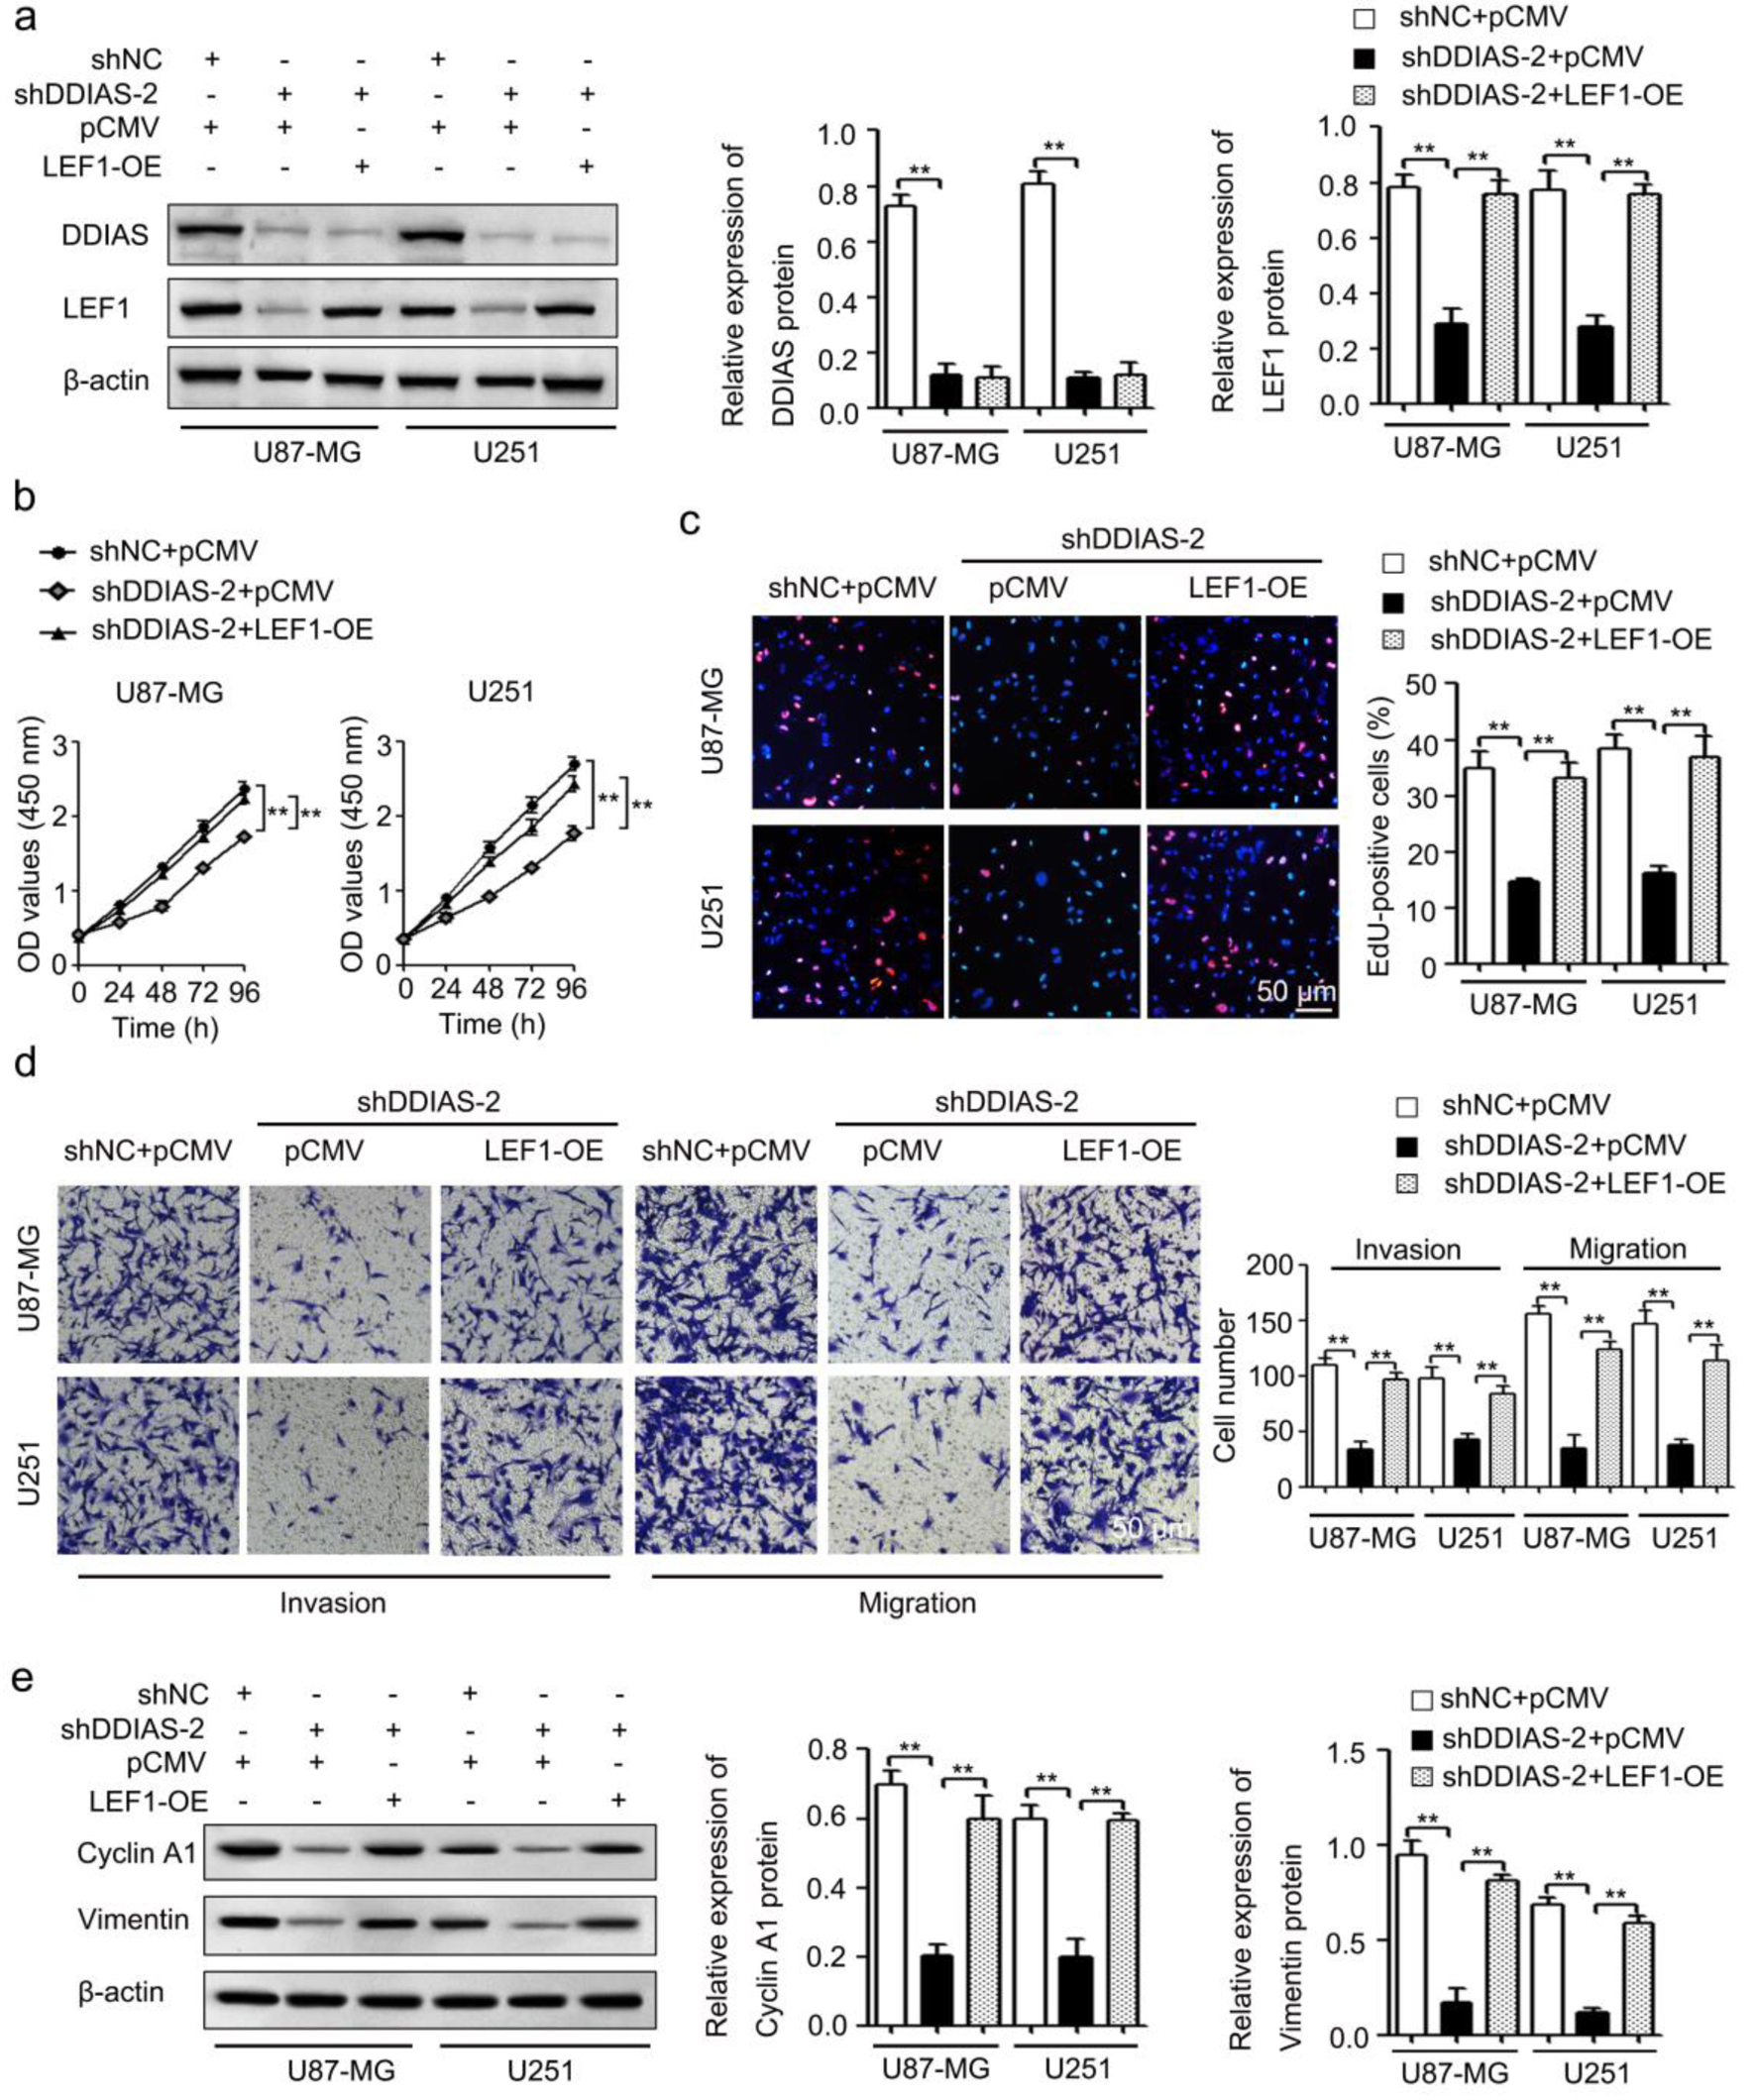
Figure 6. DDIAS induces glioma progression by upregulating LEF1. (a) The protein levels of DDIAS and LEF1 in U87-MG and U251 cells after cotransfection with shDDIAS-2 and LEF1-OE were measured using western blotting. (b and c) CCK-8 and EdU assays were used to determine the cell viability and proliferation rates of U87-MG and U251 cells after cotransfection with shDDIAS-2 and LEF1-OE. Scale bars, 50 µm. (d) The invasion and migration capacities of U87-MG and U251 cells cotransfected with shDDIAS-2 and LEF1-OE were determined by Transwell assay. Scale bars, 50 µm. (e) The expression levels of cyclin A1 and vimentin proteins in U87-MG and U251 cells after cotransfection with shDDIAS-2 and LEF1-OE were measured using western blotting. **P < 0.01 as compared to the shNC + pCMV group or the shDDIAS-2 + pCMV group. DDIAS: DNA damage-induced apoptosis suppressor; LEF1: lymphoid enhancer-binding factor 1; LEF1-OE: LEF1 overexpression vector; shDDIAS: shRNA targeting DDIAS; shNC: shRNA negative control.
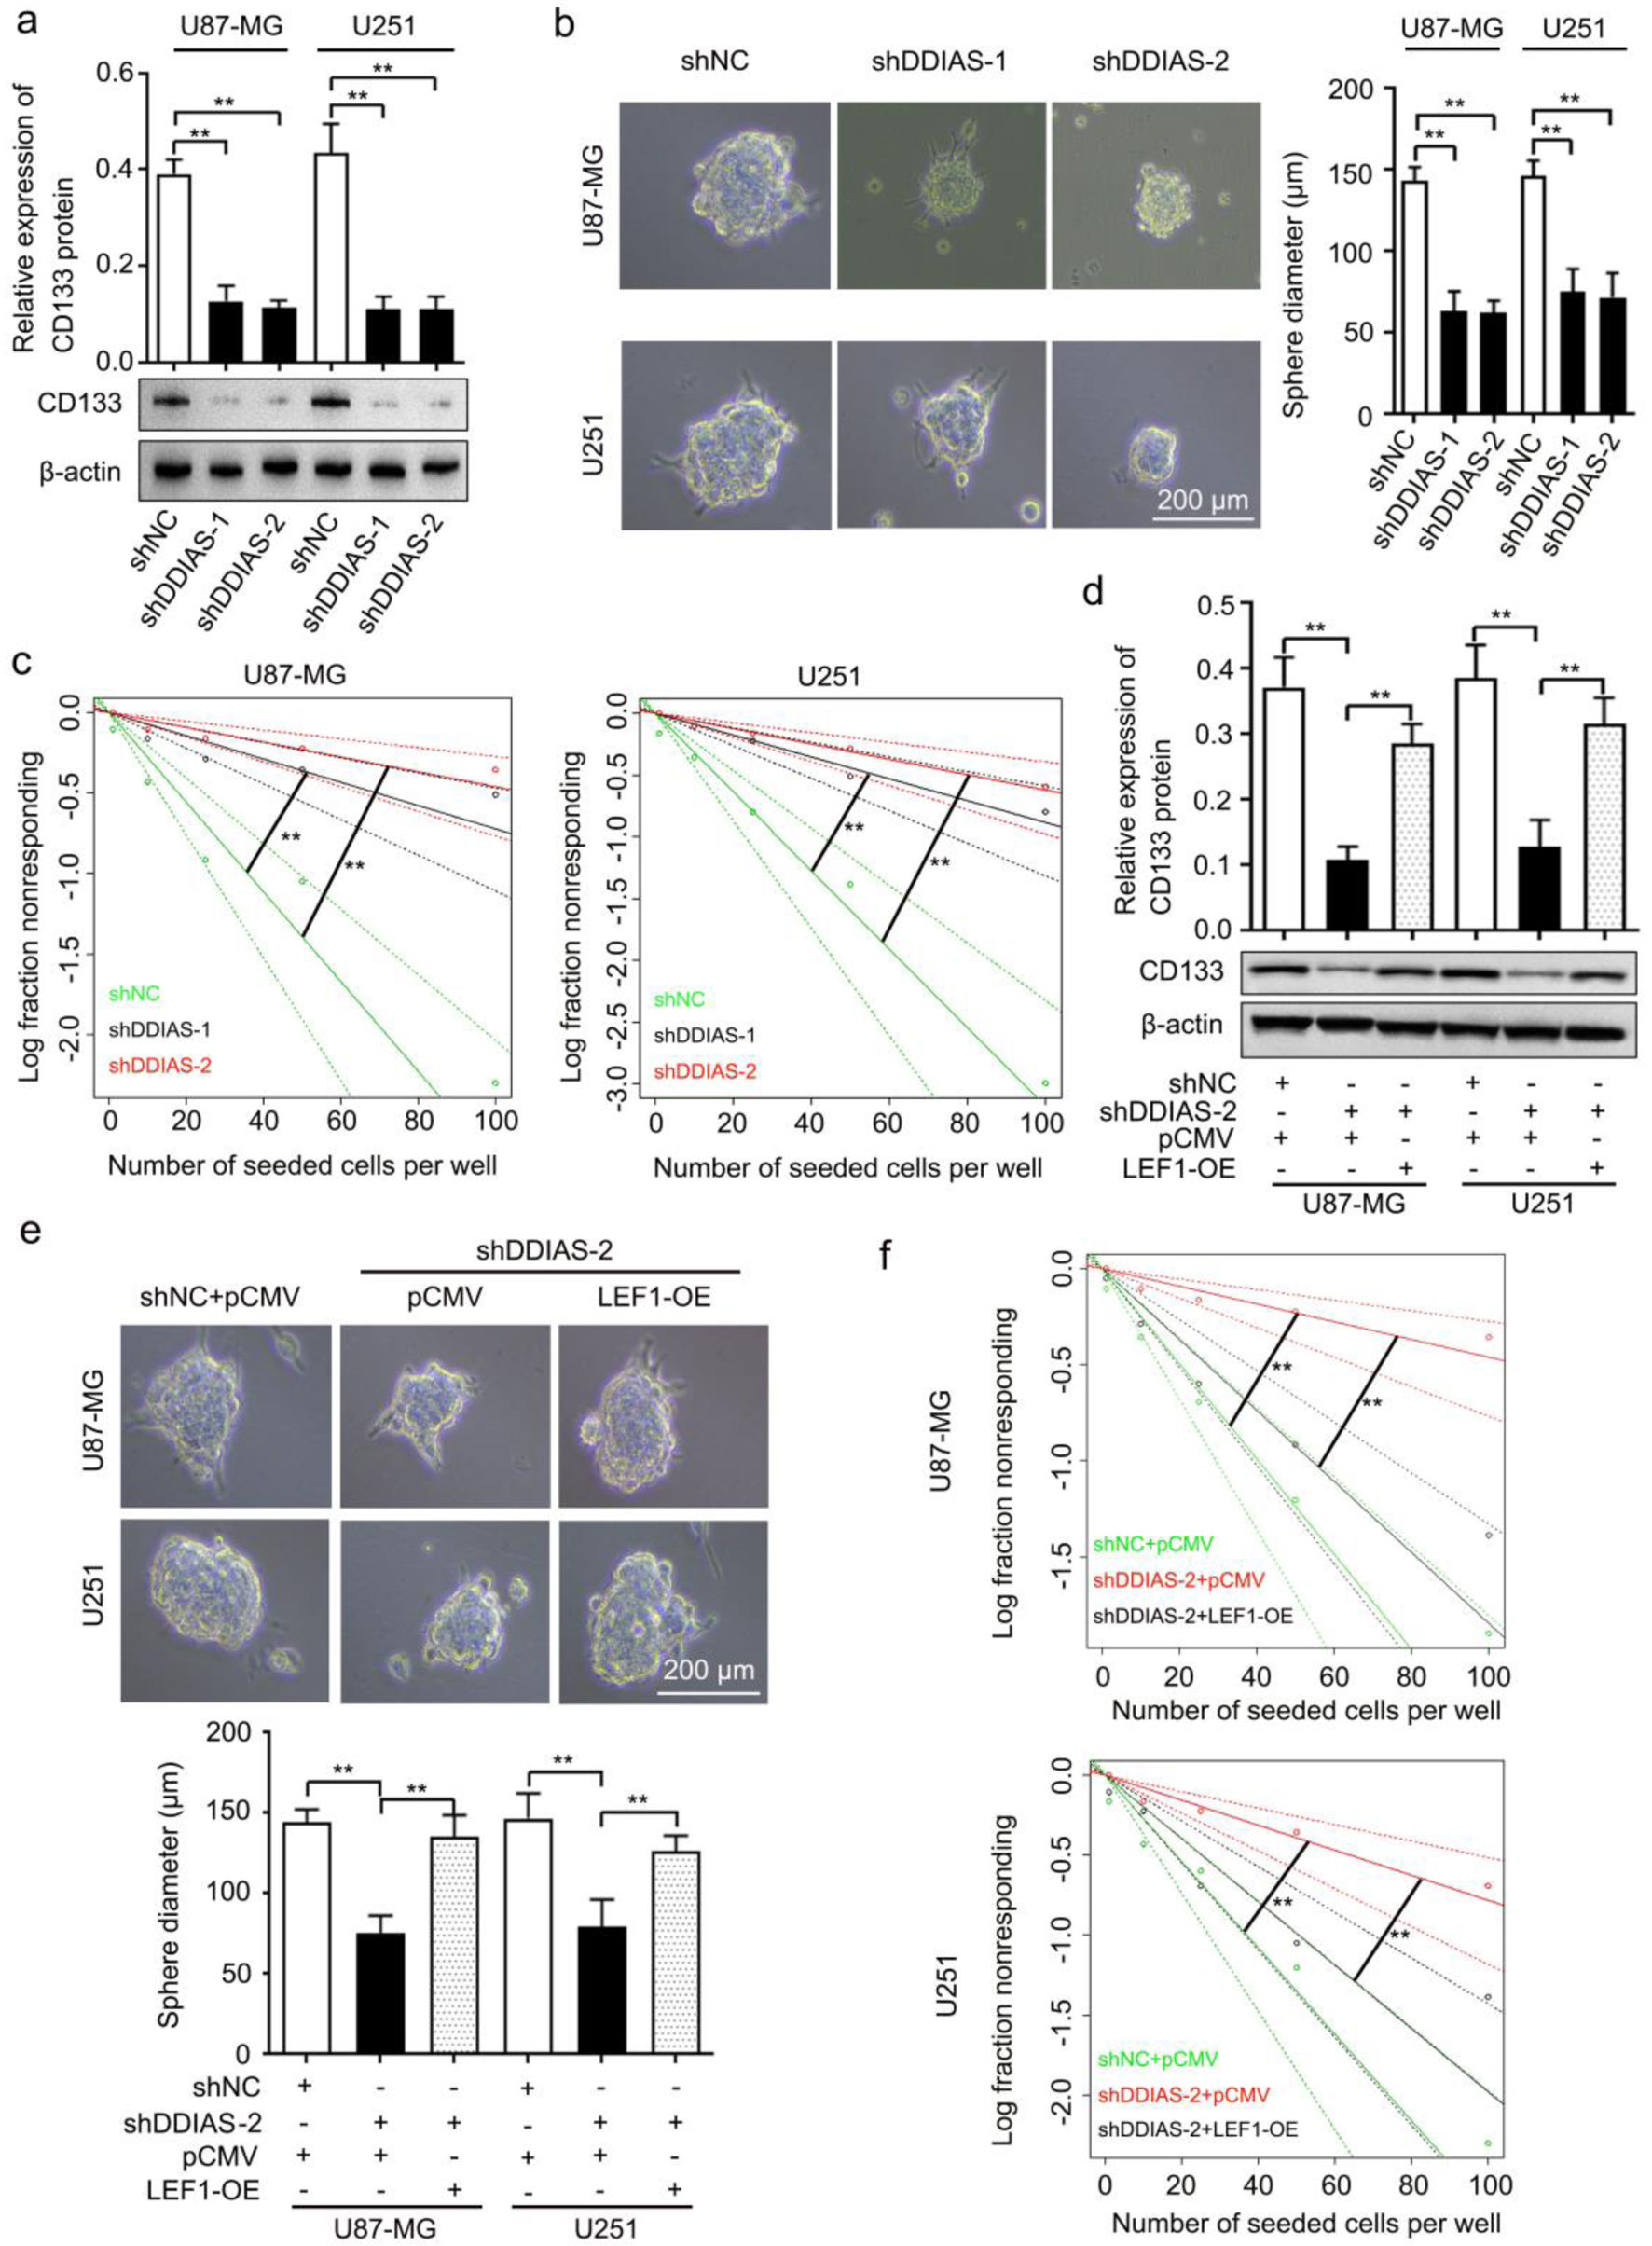
Figure 7. DDIAS is involved in glioma cell stemness by upregulating LEF1. (a) Western blotting analysis was performed to detect the expression level of CD133 protein in U87-MG and U251 cells after transfection with shDDIAS and shNC. (b) Representative images and quantification of the sphere formation assay in U87-MG and U251 cells after transfection with shDDIAS and shNC. Scale bars, 200 µm. (c) Limiting dilution assay was performed to detect the self-renewal capacity of U87-MG and U251 cells after transfection with shDDIAS and shNC. (d) Western blotting analysis was used to determine the expression level of CD133 protein in U87-MG and U251 cells after cotransfection with shDDIAS-2 and LEF1-OE. (e) Representative images and quantification of the sphere formation assay in U87-MG and U251 cells after cotransfection with shDDIAS-2 and LEF1-OE. Scale bars, 200 µm. (f) Limiting dilution assay was performed to detect the self-renewal capacity of U87-MG and U251 cells after cotransfection with shDDIAS-2 and LEF1-OE. **P < 0.01 as compared to the shNC group, the shNC + pCMV group or the shDDIAS-2 + pCMV group. DDIAS: DNA damage-induced apoptosis suppressor; LEF1: lymphoid enhancer-binding factor 1; shDDIAS: shRNA targeting DDIAS; shNC: shRNA negative control; LEF1-OE: LEF1 overexpression vector.
Table
Table 1. Primer Sequences
| Genes | Primer | Sequences |
|---|
| LEF1: lymphoid enhancer-binding factor 1. |
| LEF1 | Forward | 5′-ACAGATCACCCCACCTCTTG-3′ |
| Reverse | 5′-ATAGCTGGATGAGGGATGCC-3′ |
| β-actin | Forward | 5′-CTGGGACGACATGGAGAAAA-3′ |
| Reverse | 5′-AAGGAAGGCTGGAAGAGTGC-3′ |
| Cyclin A1 | Forward | 5′-CCAGAAACCCTTGCTGCATT-3′ |
| Reverse | 5′-TGAGGGACACACACAGGTAC-3′ |
| Cyclin D1 | Forward | 5′-GCATGTTCGTGGCCTCTAAG-3′ |
| Reverse | 5′-CGTGTTTGCGGATGATCTGT-3′ |
| Cyclin E1 | Forward | 5′-TCCTGGATGTTGACTGCCTT-3′ |
| Reverse | 5′-TGTGTGCATCTTCATCAGCG-3′ |
| E-cadherin | Forward | 5′-CGGACGATGATGTGAACACC-3′ |
| Reverse | 5′-TTGCTGTTGTGCTTAACCCC-3′ |
| N-cadherin | Forward | 5′-CGGTTTCATTTGAGGGCACA-3′ |
| Reverse | 5′-TTGGAGCCTGAGACACGATT-3′ |
| Vimentin | Forward | 5′-GAGTCCACTGAGTACCGGAG-3′ |
| Reverse | 5′-ACGAGCCATTTCCTCCTTCA-3′ |