Figures
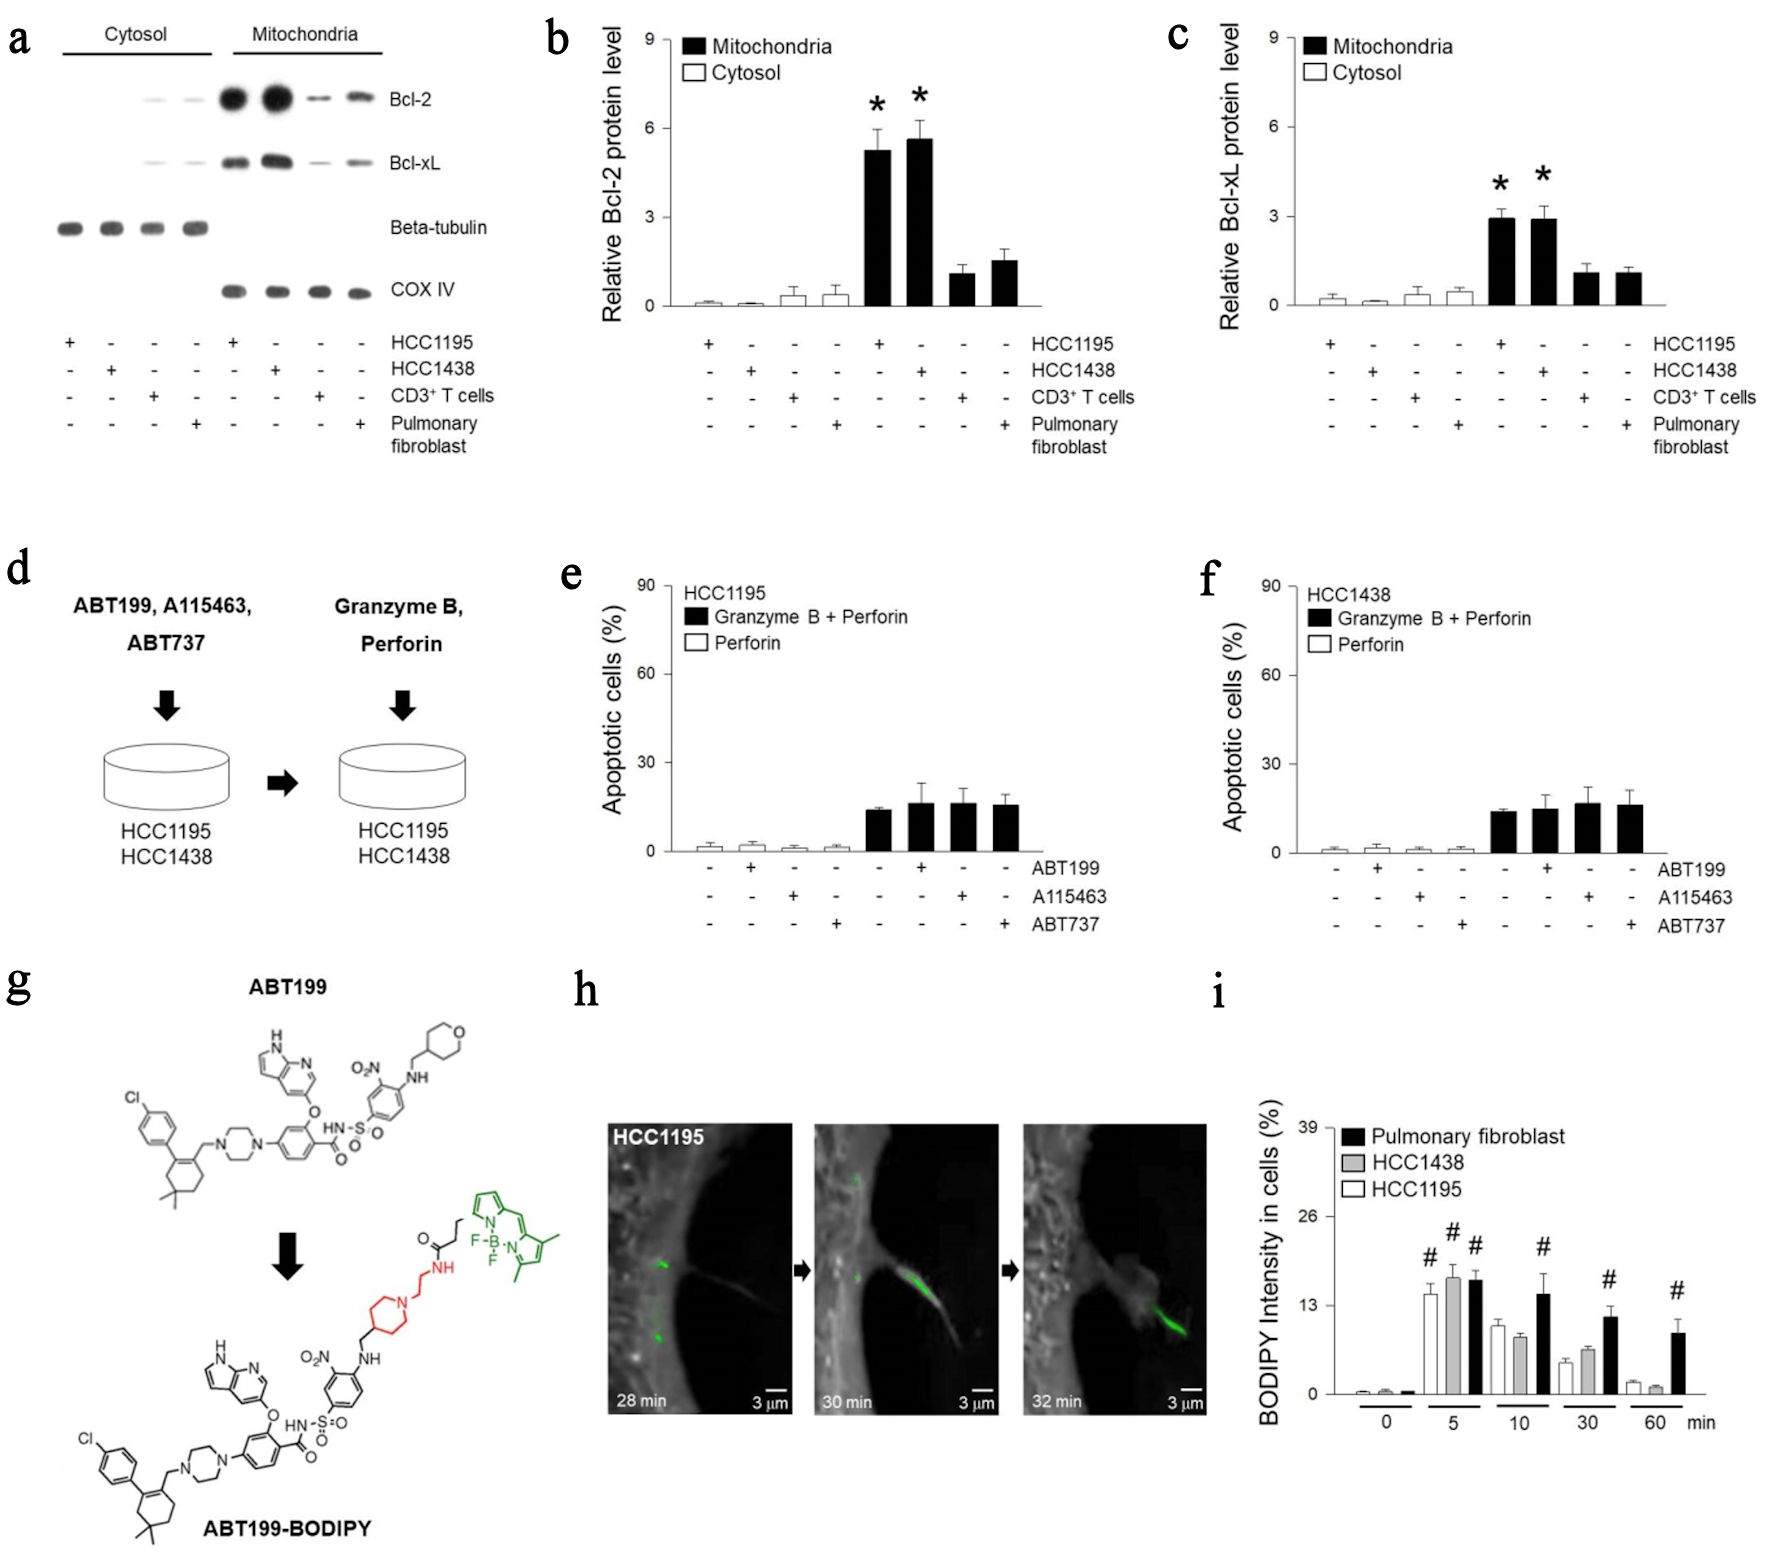
Figure 1. Treatment of BH3-mimetic drugs in HCC1195 and HCC1438 cells. (a-c) Cytosol and mitochondrial proteins were extracted from HCC1195, HCC1438, CD3+ T, pulmonary fibroblast cells, and expression of Bcl-2 or Bcl-xL was determined using western blotting. Beta-tubulin was used as a positive marker for the cytosol, while COX IV was used as a positive marker for the mitochondrial fraction. (d) Cell death was measured following treatment with 3 nM ABT199, 19 nM A115463, or 15 µM ABT737 for 1 h, or incubation with 200 pg/µL granzyme B and 100 pg/µL perforin for 2 h. (e, f) The cells were fixed up to 5 h, and apoptosis were determined using ELISA kit. (g) Structures of ABT199 and ABT199-BODIPY. (h) Following treatment of synthetic ABT199-BODIPY, refractive index images of HCC1195 were enlarged at 28, 30, or 32 min, and ABT199-BODIPY were colored in green. (i) Quantified mean fluorescent intensity of the BODIPY signal in cells was measured at 512 nm. Results are the means ± standard error (SE) of six experiments in each group. *Significantly different from cytosol fraction, P < 0.05. #Significantly different from treatment of ABT199-BODIPY at 0 min, P < 0.05. COX IV: cytochrome c oxidase subunit IV; BH3: Bcl-2 homology 3; Bcl-2: B-cell lymphoma 2; Bcl-xL: B-cell lymphoma extra-large; ELISA: enzyme-linked immunoassay; BODIPY: boron dipyrromethene.
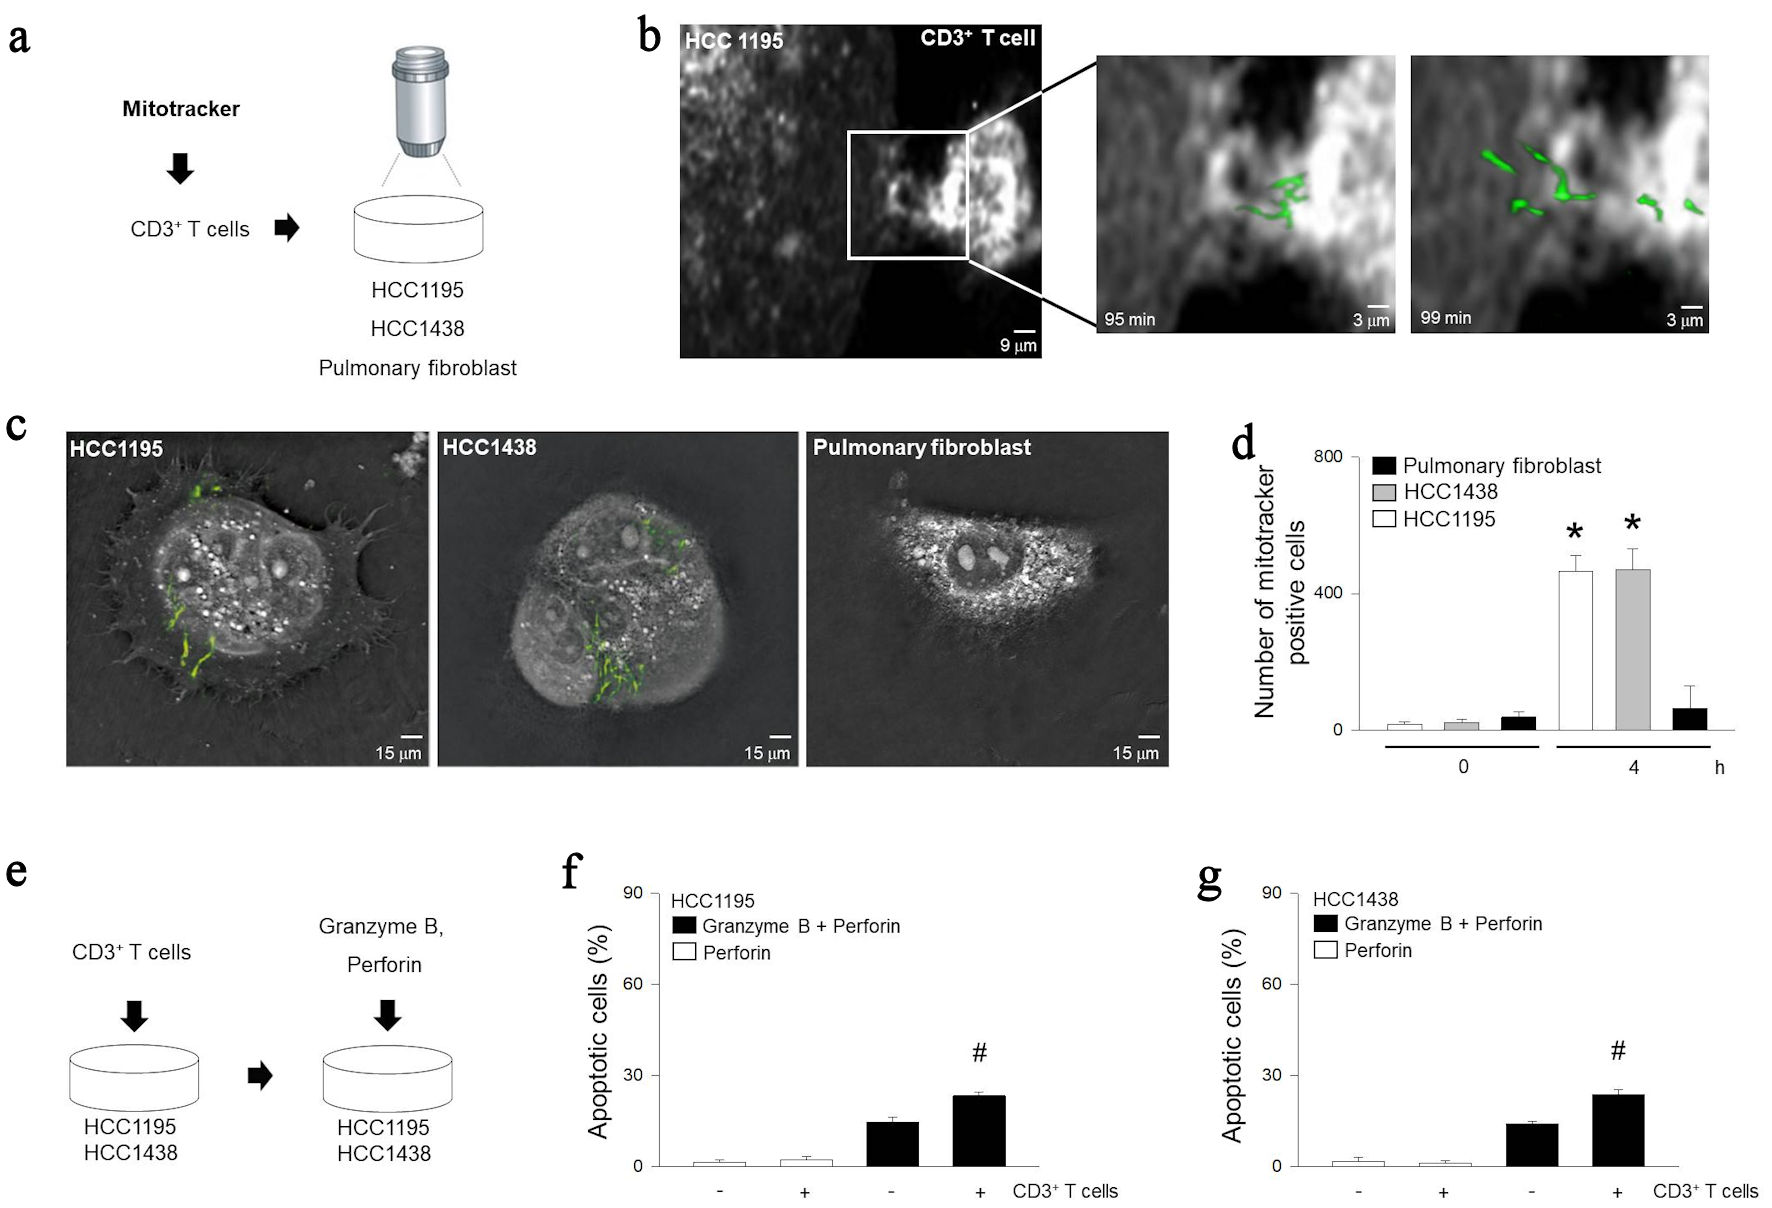
Figure 2. Relationship between granzyme B-induced apoptosis and mitochondrial trafficking from immune cells. (a) Diagram for observing mitochondrial internalization. After treating inactivated T cells with mitotracker and incubating with HCC1195, HCC1438, or pulmonary fibroblast for 5 h. (b) Cell images were rendered with tomographic microscopy. (c) Cellular internalization of mitochondria was visualized with mitotracker at 490 nm. (d) Quantization of internalization of mitochondria was determined by tomographic phase microscopy. (e) Diagram for model of apoptosis with mitochondrial trafficking from immune cells. After incubating inactivated T cells with HCC1195 or HCC1438 cells for 5 h, apoptosis was induced following combinations of recombinant 100 pg/µL of perforin and 200 pg/µL of granzyme B. (f, g) Apoptosis was determined using ELISA kit. Results are the means ± standard error (SE) of six experiments in each group. *Significantly different from incubation of CD3+ T cells at 0 h, P < 0.05. #Significantly different from treatment of granzyme B and perforin, P < 0.05. ELISA: enzyme-linked immunoassay.
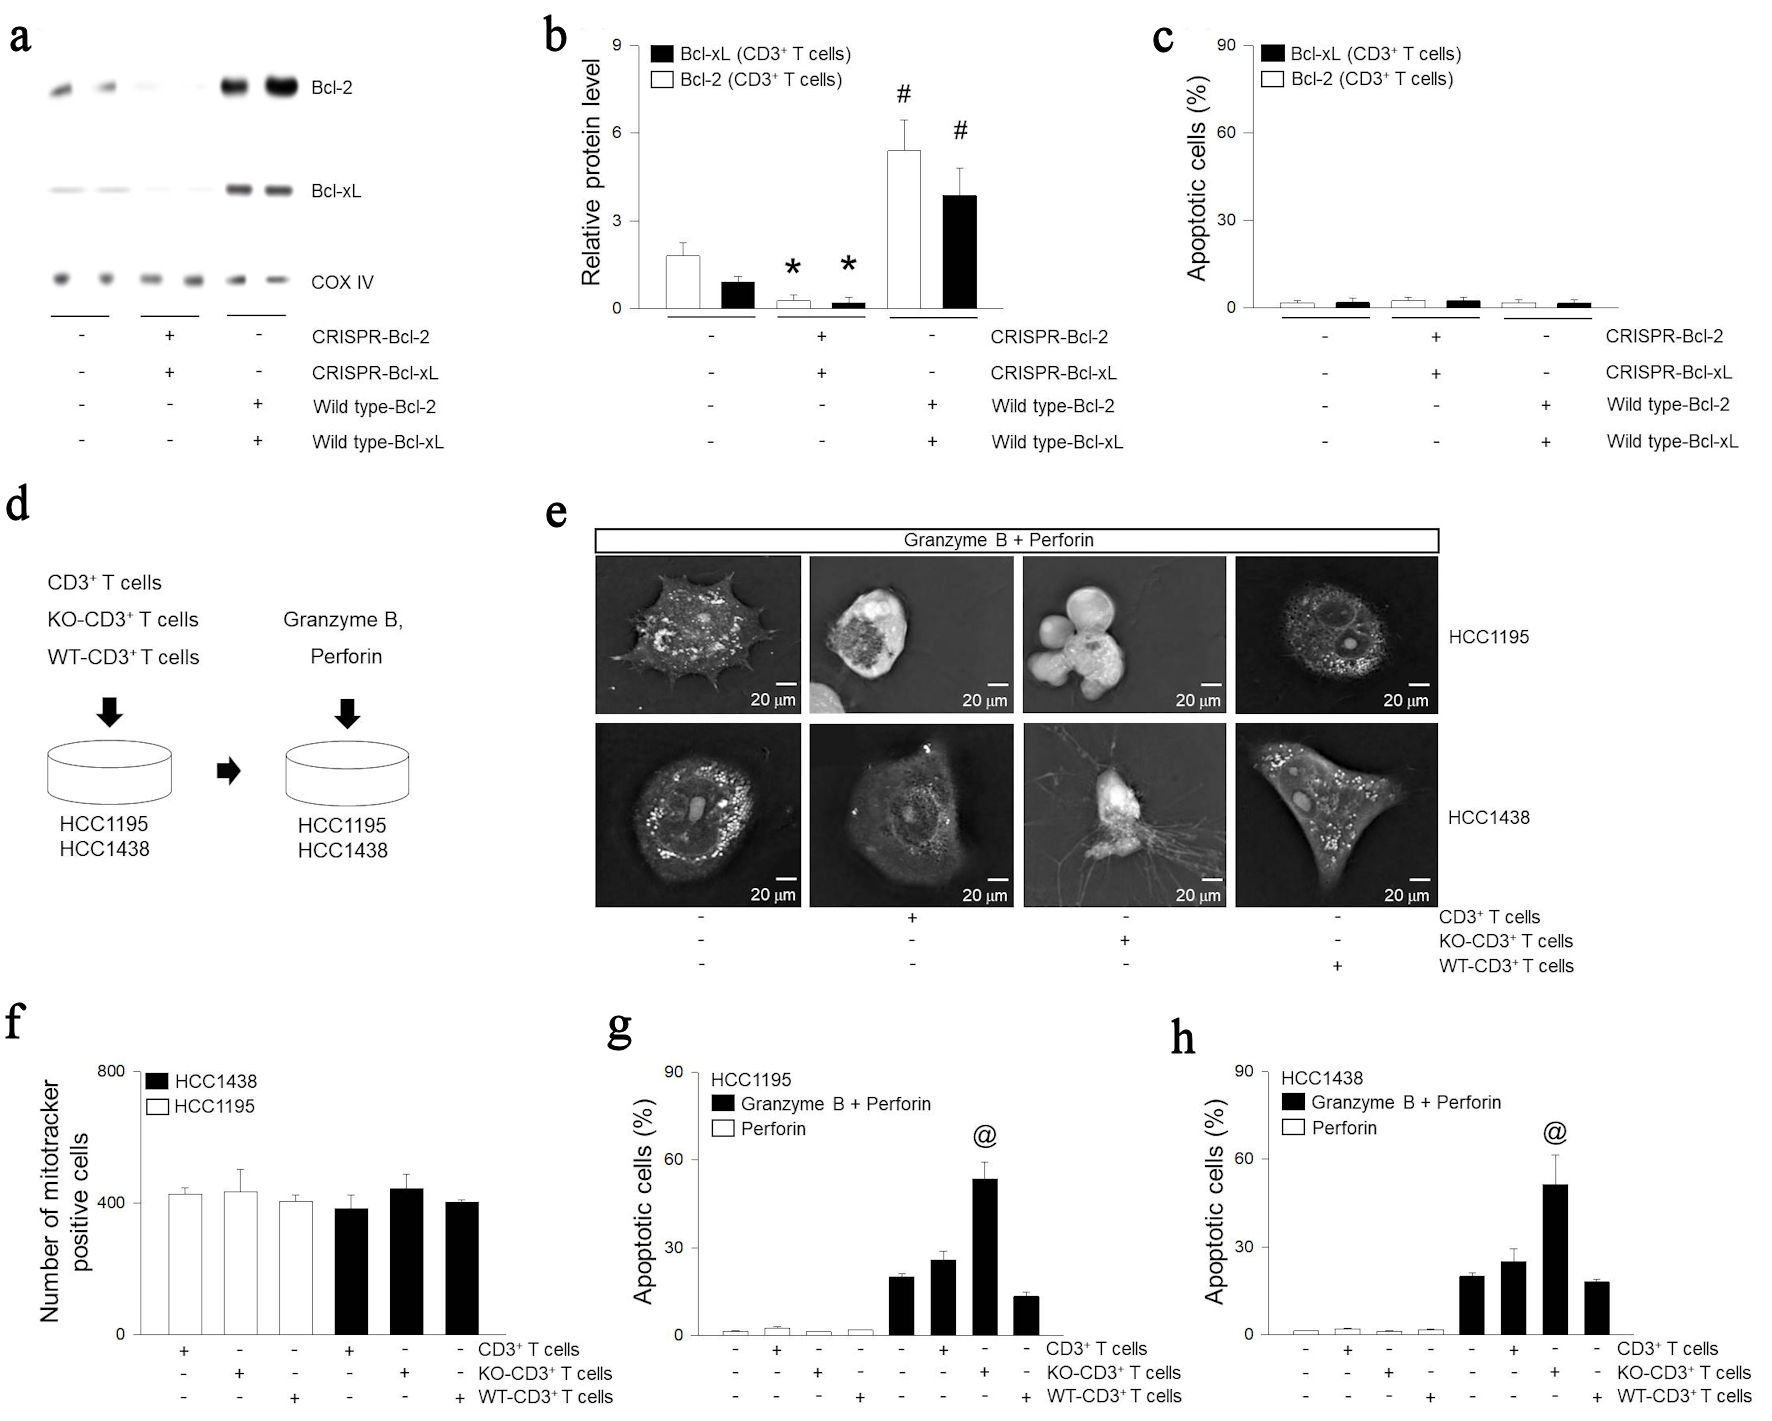
Figure 3. Role of expression of Bcl-2 or Bcl-xL in extracellular mitochondria on lung cancer cells. (a, b) CD3+ T cells treated with Bcl-2 CRISPR-plasmid, Bcl-2 wild type (WT)-plasmid, Bcl-xL CRISPR-plasmid, or Bcl-xL wild type-plasmid. The overexpressed (OE) and knocked out (KO) indicate overexpress and knock out. Mitochondrial proteins were extracted from CD3+ T cells and expressions of Bcl-2, Bcl-xL, or COX IV were determined using western blotting. (c) Apoptosis was determined using ELISA kit. (d) CD3+ T cells, KO-CD3+ T cells, or OE-CD3+ T cells was incubated with HCC1195 or HCC1438 cells for 5 h. Apoptosis was induced following combinations of recombinant 100 pg/µL of perforin and 200 pg/µL of granzyme B. Cell images were rendered (e) or quantization of internalization of mitochondria (f) was determined by tomographic phase microscopy. (g, h) Apoptosis was determined using ELISA kit. Results are the means ± standard error (SE) of six experiments in each group. *Significantly different from treatment of negative control plasmid, P < 0.05. #Significantly different from treatment of CRISPR plasmid, P < 0.05. @Significantly different from all other groups, P < 0.05. Bcl-2: B-cell lymphoma 2; Bcl-xL: B-cell lymphoma extra-large; COX IV: cytochrome c oxidase subunit IV; CRISPR: clustered regularly interspaced short palindromic repeats; ELISA: enzyme-linked immunoassay.
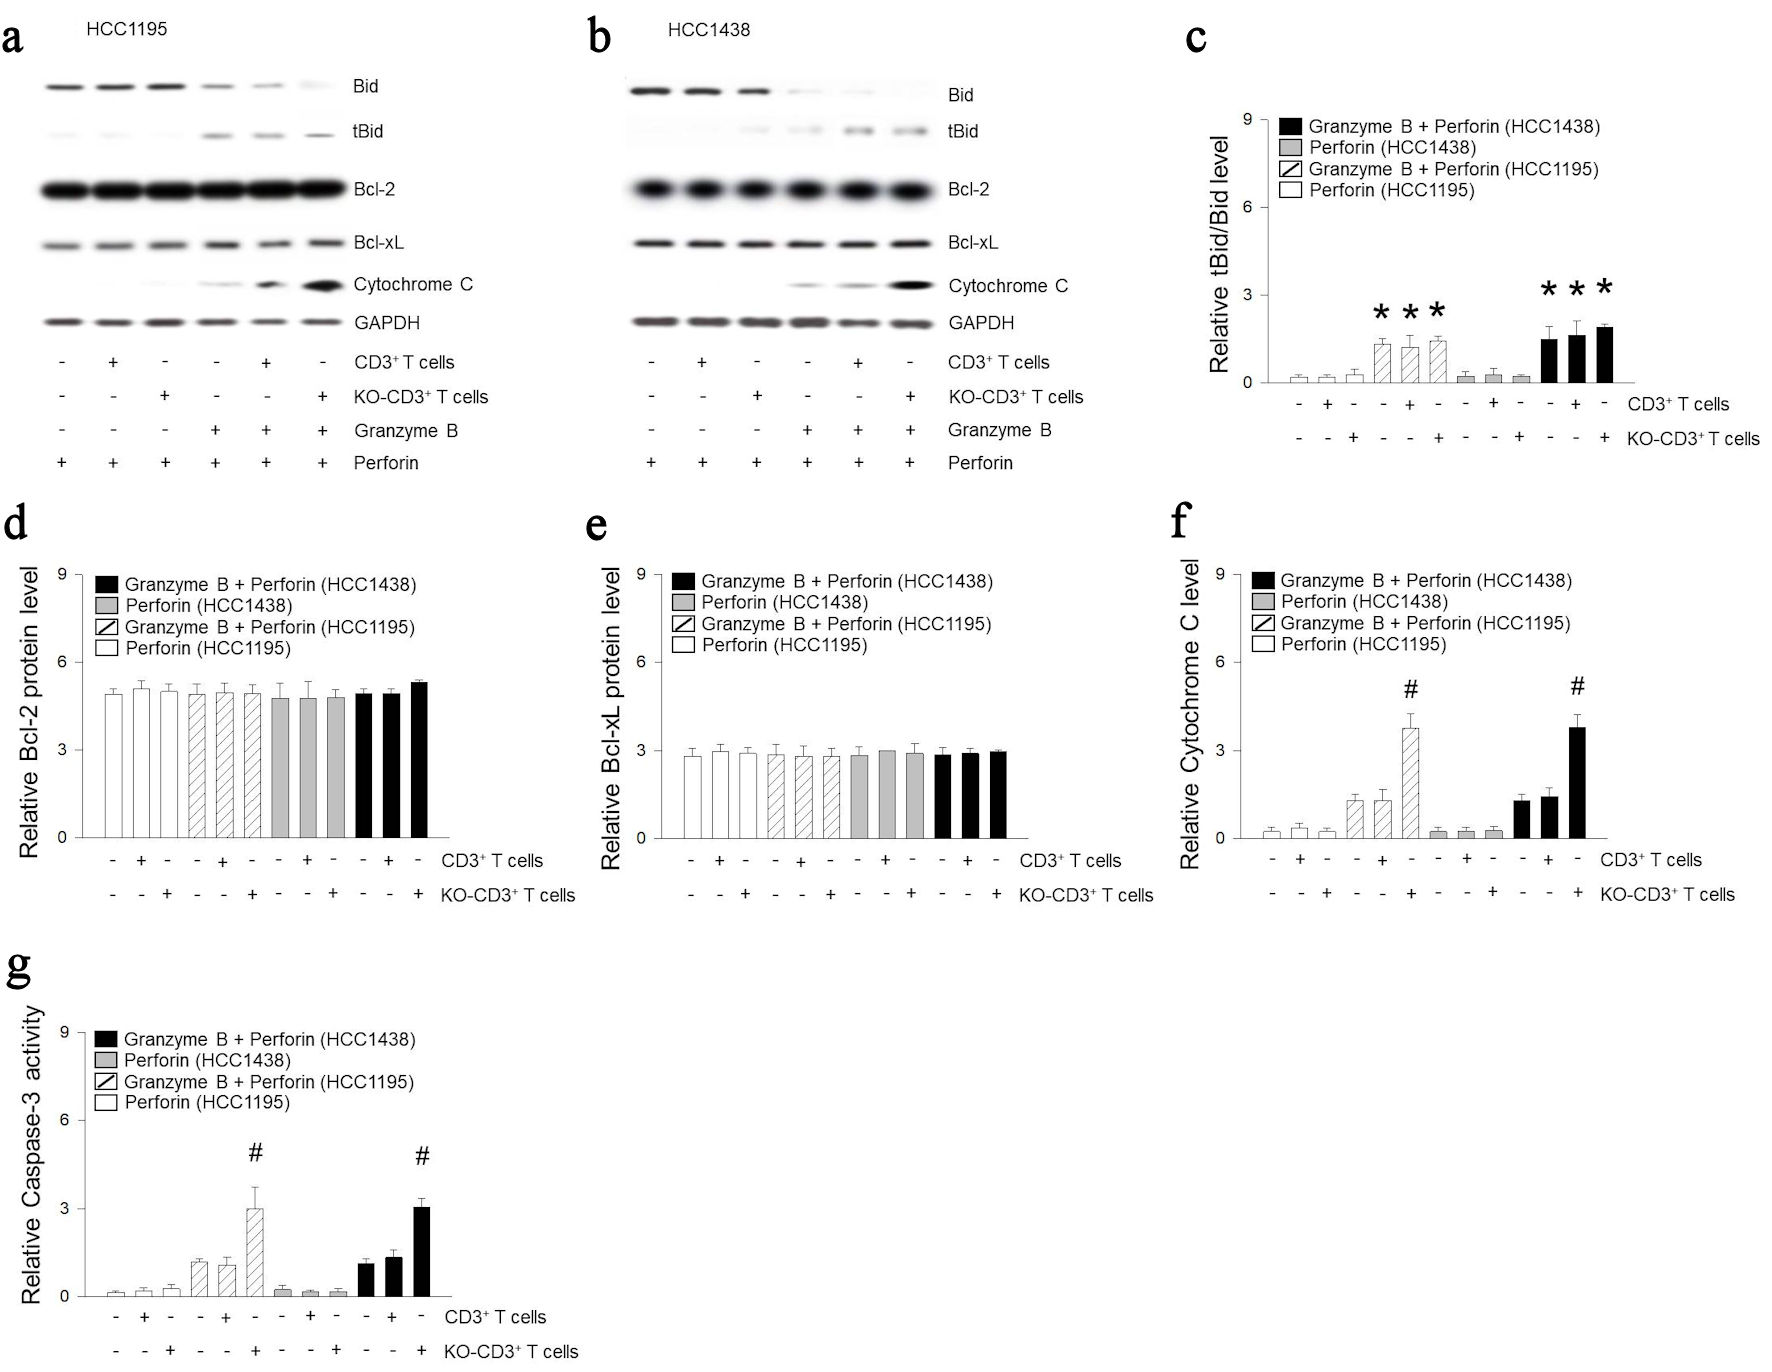
Figure 4. Mitochondria of immune cells deficient in Bcl-2 and Bcl-xL are related to cytochrome C-related apoptotic signals. (a-f) CD3+ T cells was incubated with HCC1195 or HCC1438 cells for 5 h. Apoptosis was induced following combinations of perforin and granzyme B. Proteins were extracted from HCC1195 or HCC1438 cells, and expression of Bid, Bcl-2, Bcl-xL, cytochrome C or GAPDH were determined using western blotting. (g) Caspase-3 activity was determined using ELISA kit. Results are the means ± standard error (SE) of six experiments in each group. *Significantly different from treatment of perforin, P < 0.05. #Significantly different from incubation of CD3+ T cells, P < 0.05. Bcl-2: B-cell lymphoma 2; Bcl-xL: B-cell lymphoma extra-large; GAPDH: glyceraldehyde-3-phosphate dehydrogenase; ELISA: enzyme-linked immunoassay; KO: knocked out.
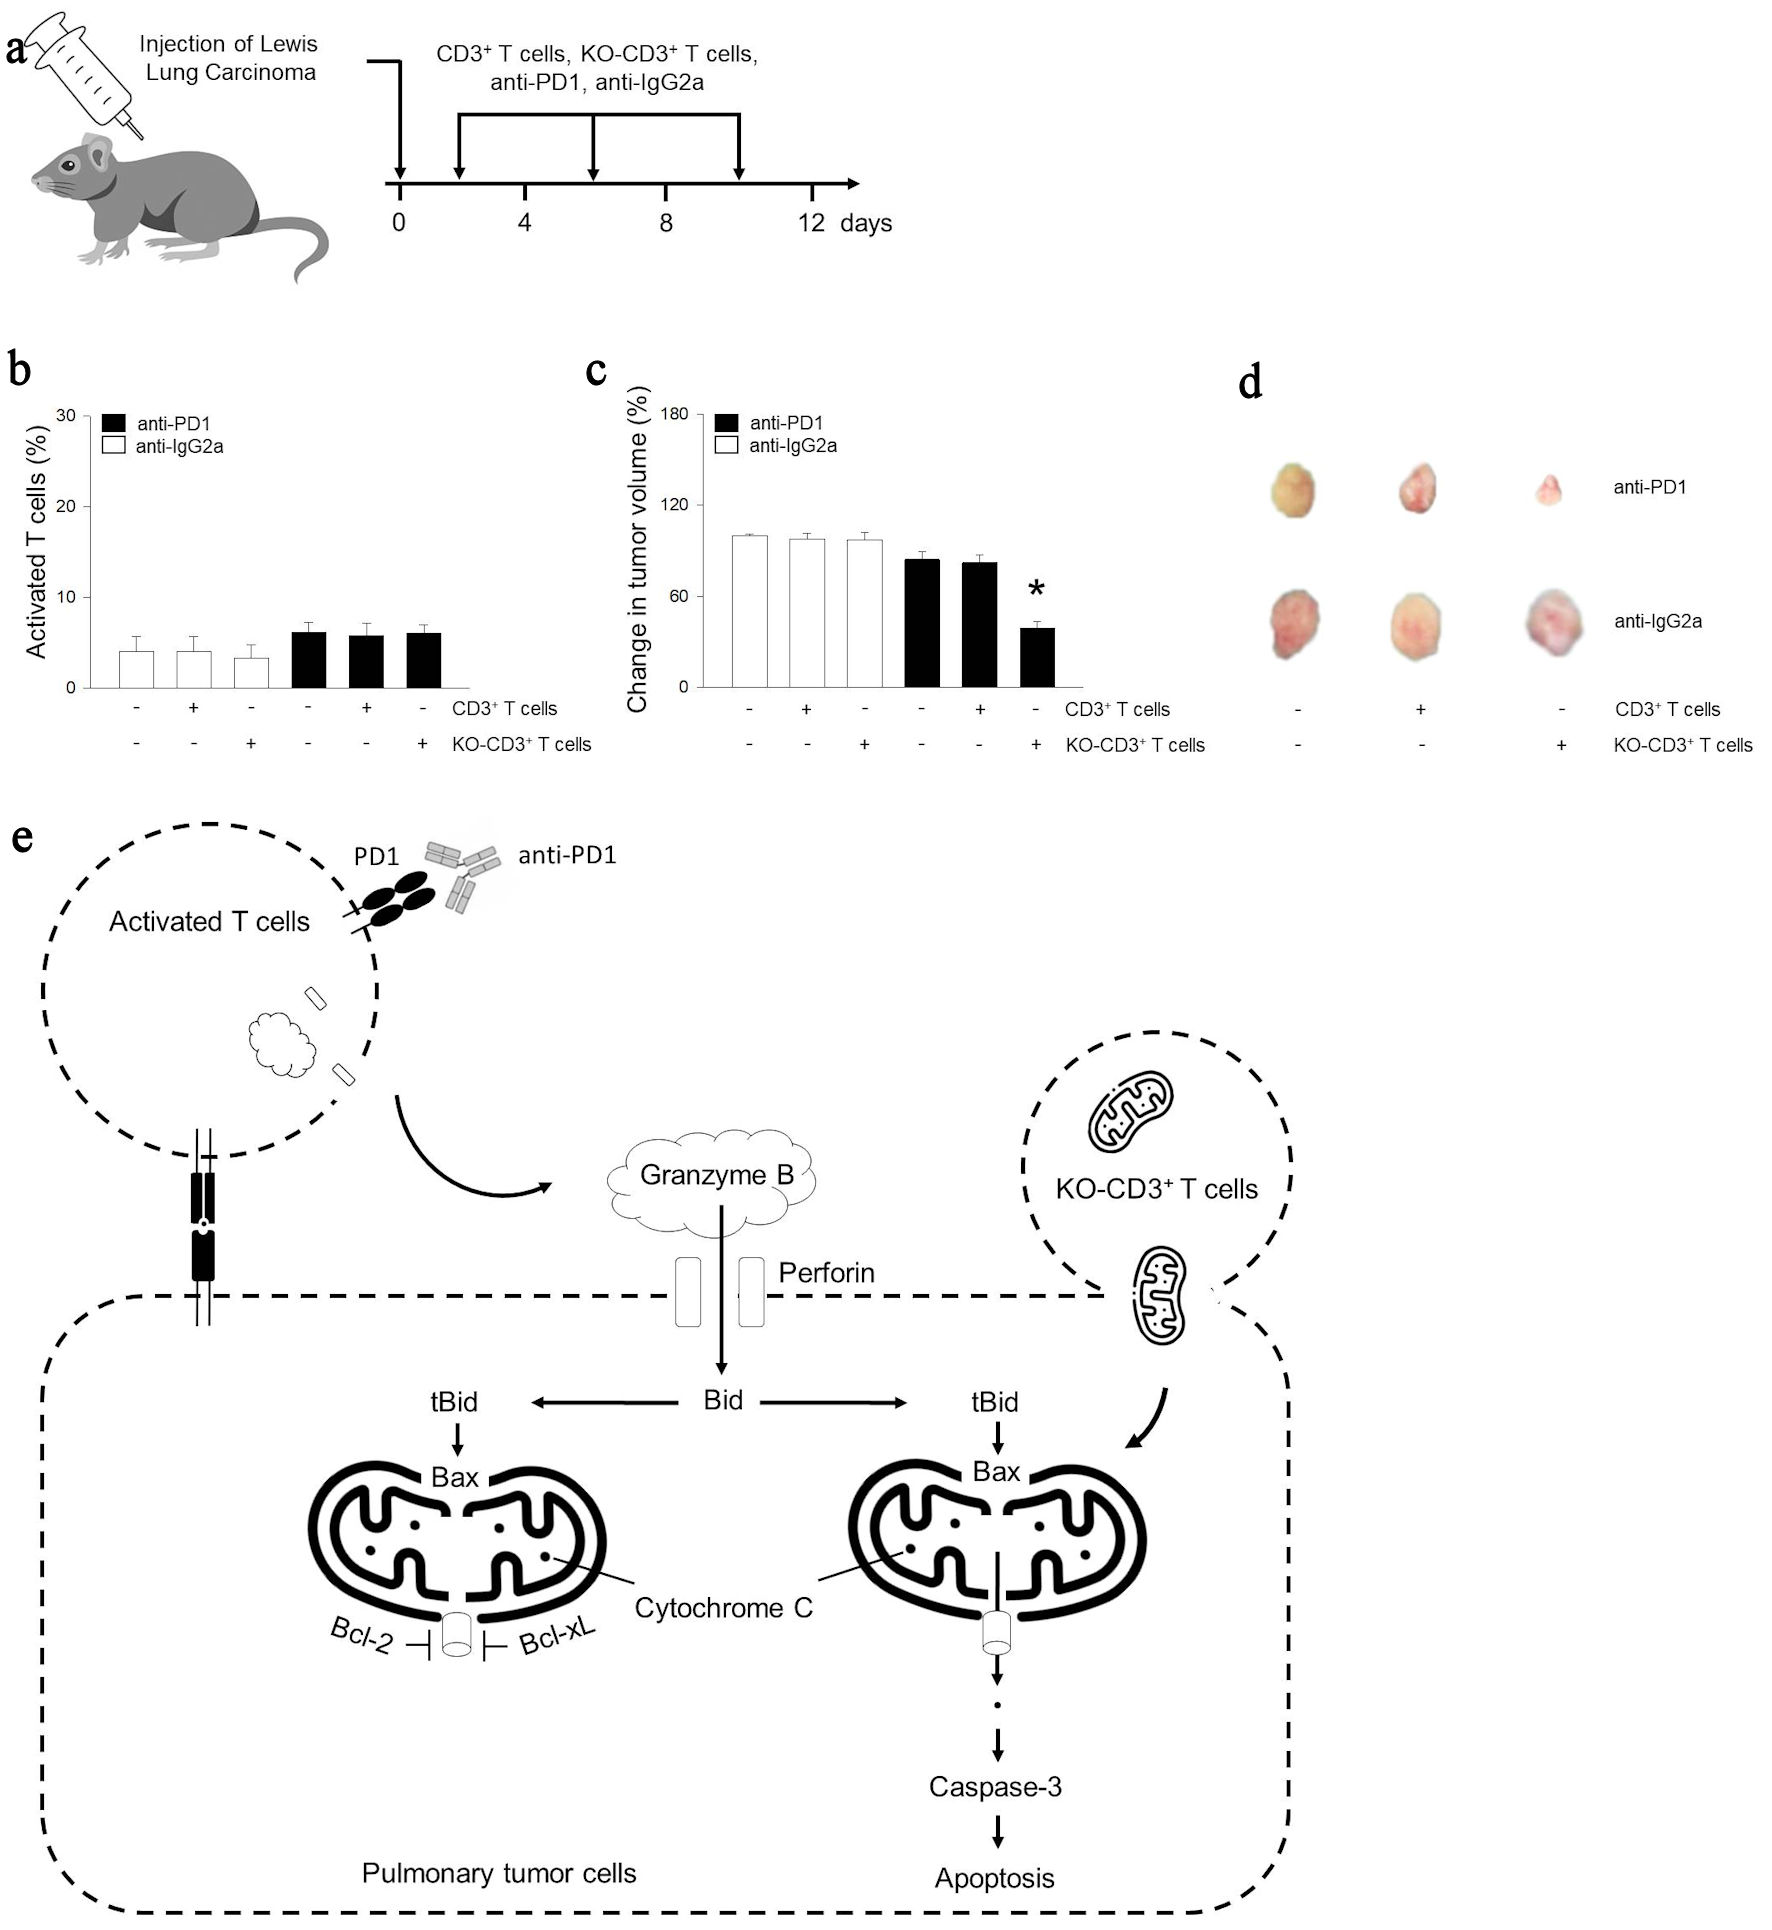
Figure 5. Mitochondria of immune cells prevents tumor growth following activated immunity in vivo. (a) Beginning at 5 weeks of age, male mice were given intraperitoneally with anti-IgG2a, anti-PD-1 (10 mg/kg), CD3+ T cells (1 × 10⁶ cells), or KO-CD3+ T cells (1 × 10⁶ cells) for 12 days. The arrow indicates the injection days. (b) Graph showing the effect of treatments on the population of activated CD69+ T cells using CD69 ELISA kit. (c, d) Bar graph or images of tumor volume change for mice. (e) Cellular internalization of mitochondria from immune cells promoted antitumor immune response through cytochrome C related apoptosis. Results are the means ± standard error (SE) of six experiments in each group. *Significantly different from all other groups, P < 0.05. ELISA: enzyme-linked immunoassay; KO: knocked out; Bcl-2: B-cell lymphoma 2; Bcl-xL: B-cell lymphoma extra-large; ELISA: enzyme-linked immunoassay; Ig: immunoglobulin; PD-1: programmed cell death 1.